Category
Economy
GDP, inflation, jobs, trade. The big economic indicators, charted with the actual data and the methodology Statistics Canada uses.
For the full breakdown — core measures, provinces and categories — see the Canada inflation rate (CPI) tracker.
The economy in six numbers
Live headline indicators, straight from Statistics Canada.
Data as of 24 September 2026, updated after each Statistics Canada release. Each number links to its Statistics Canada source table on the full tracker.
Latest economy stories
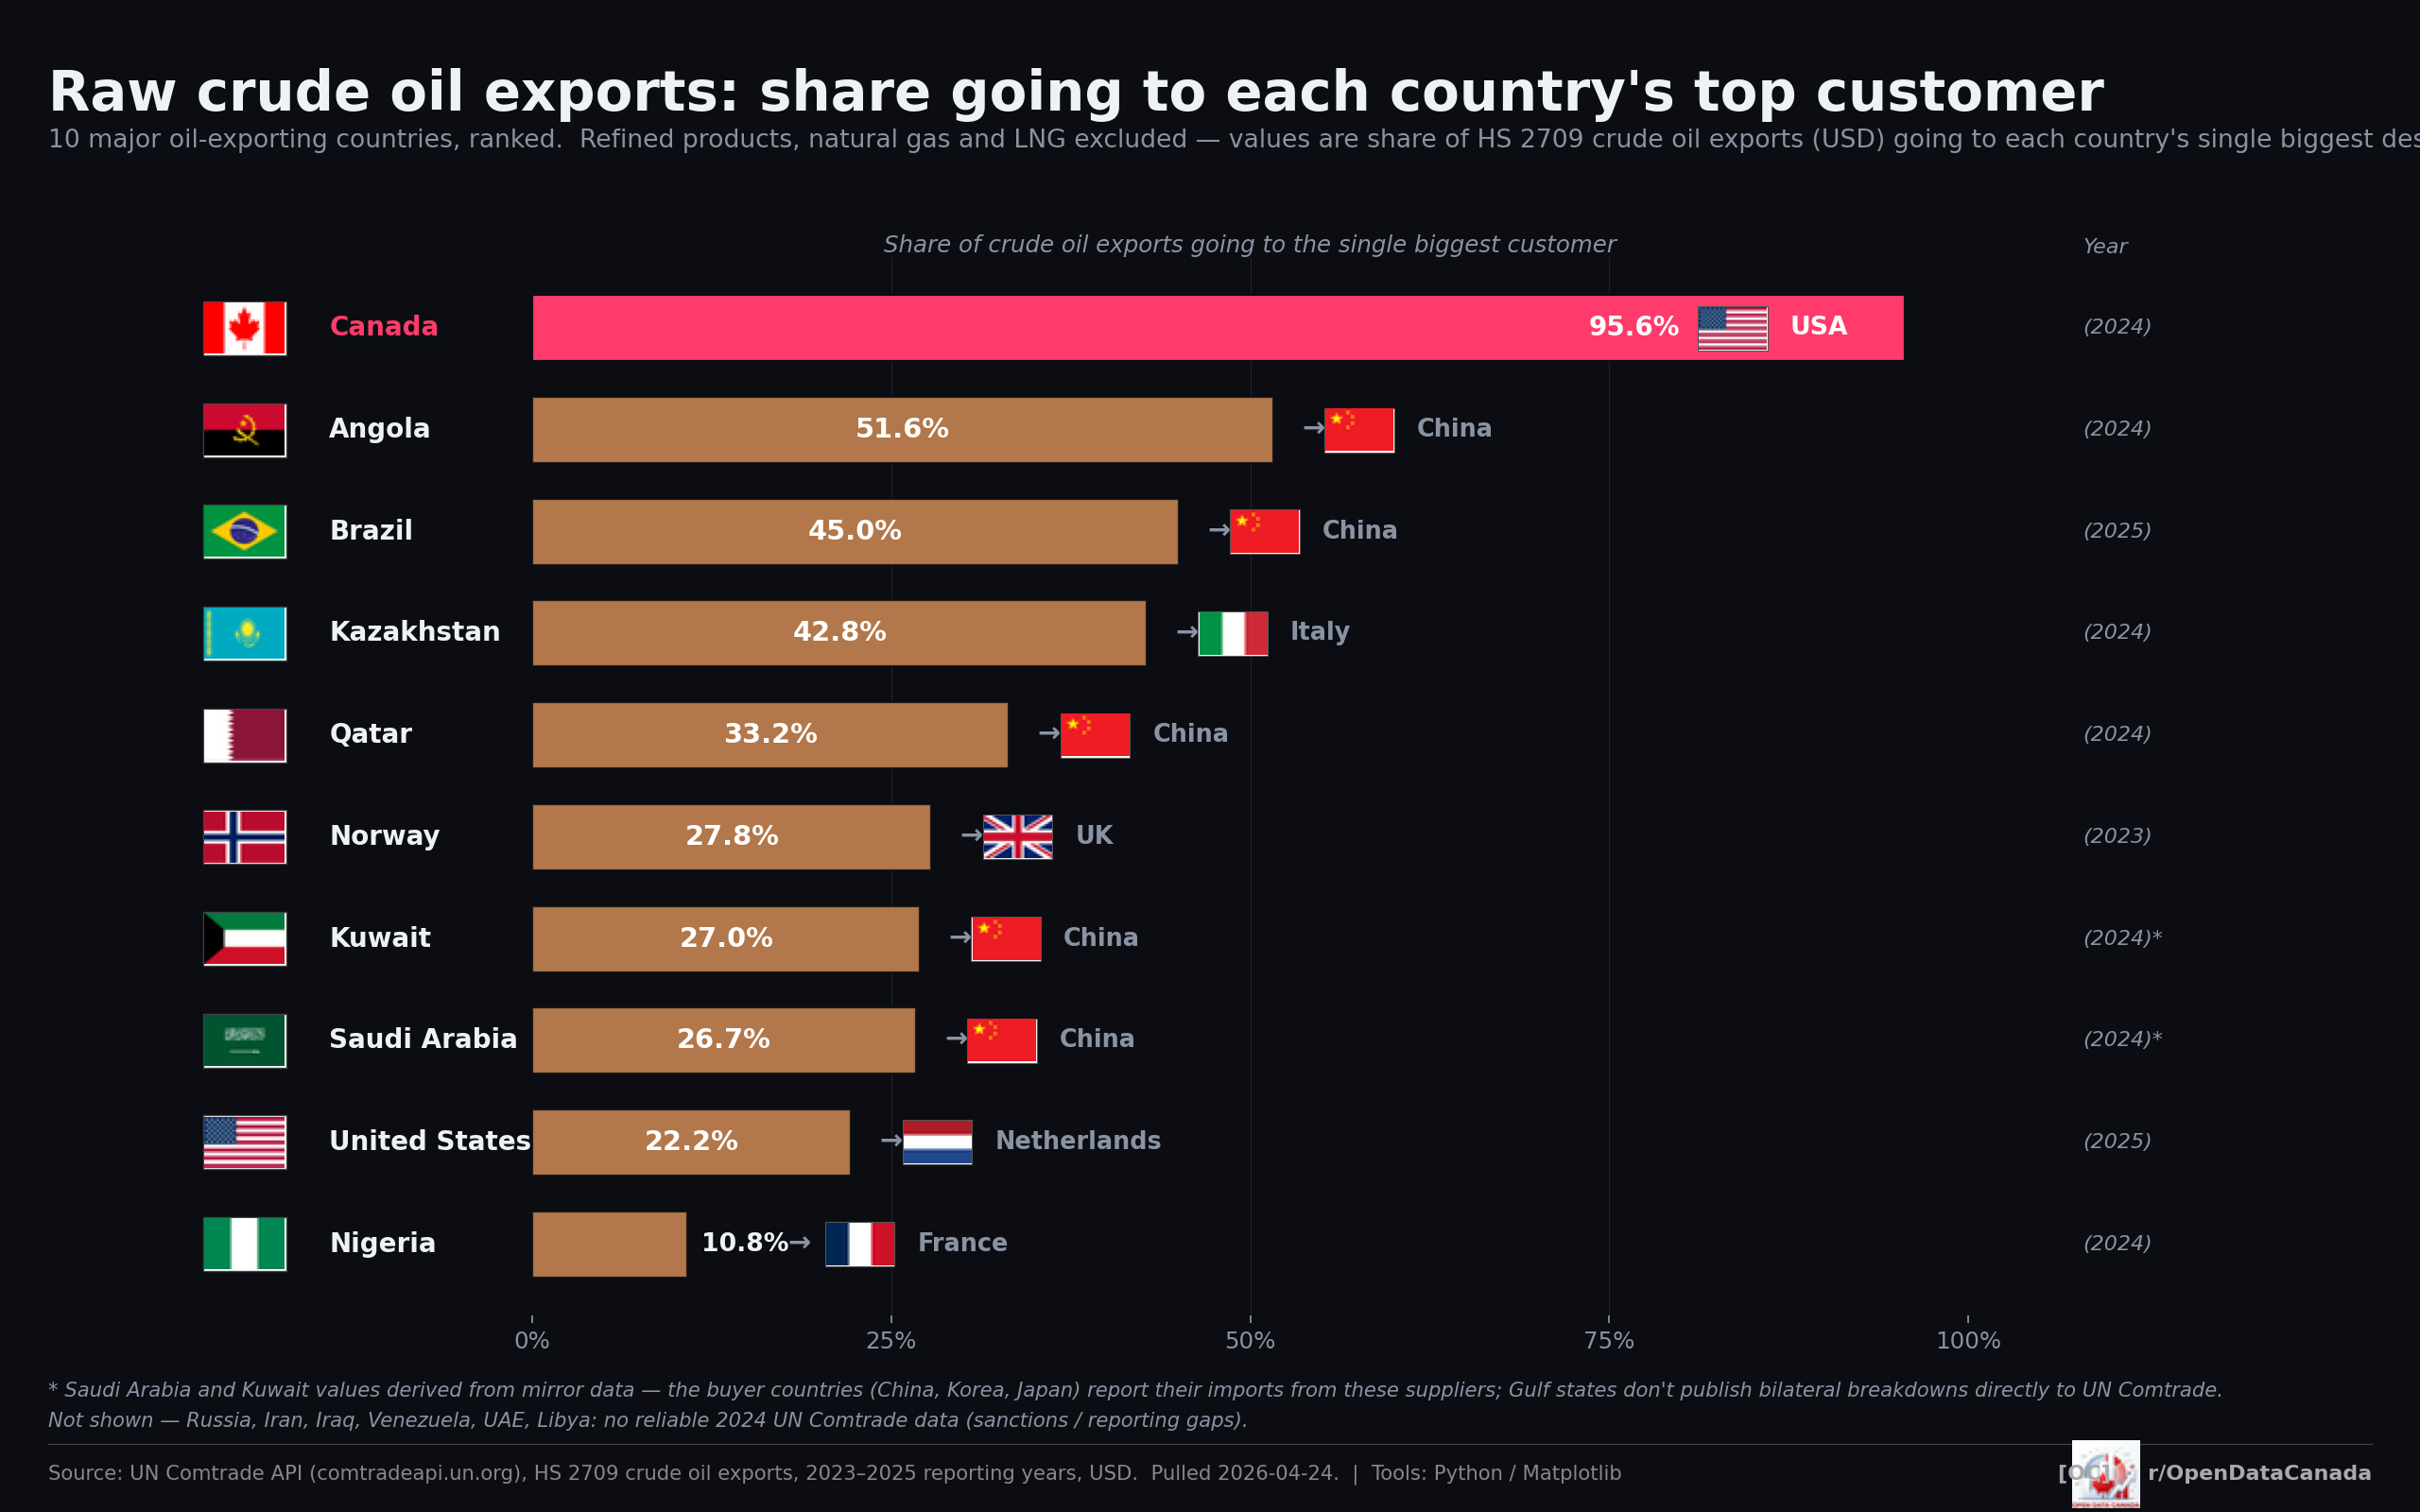
Canada is the most single-customer-dependent oil exporter in the world
95.6 % of Canada's raw crude oil exports go to the United States. Angola and Brazil — the next-most-concentrated exporters — sit around 50 %. Every other major exporter sits below 35 %.
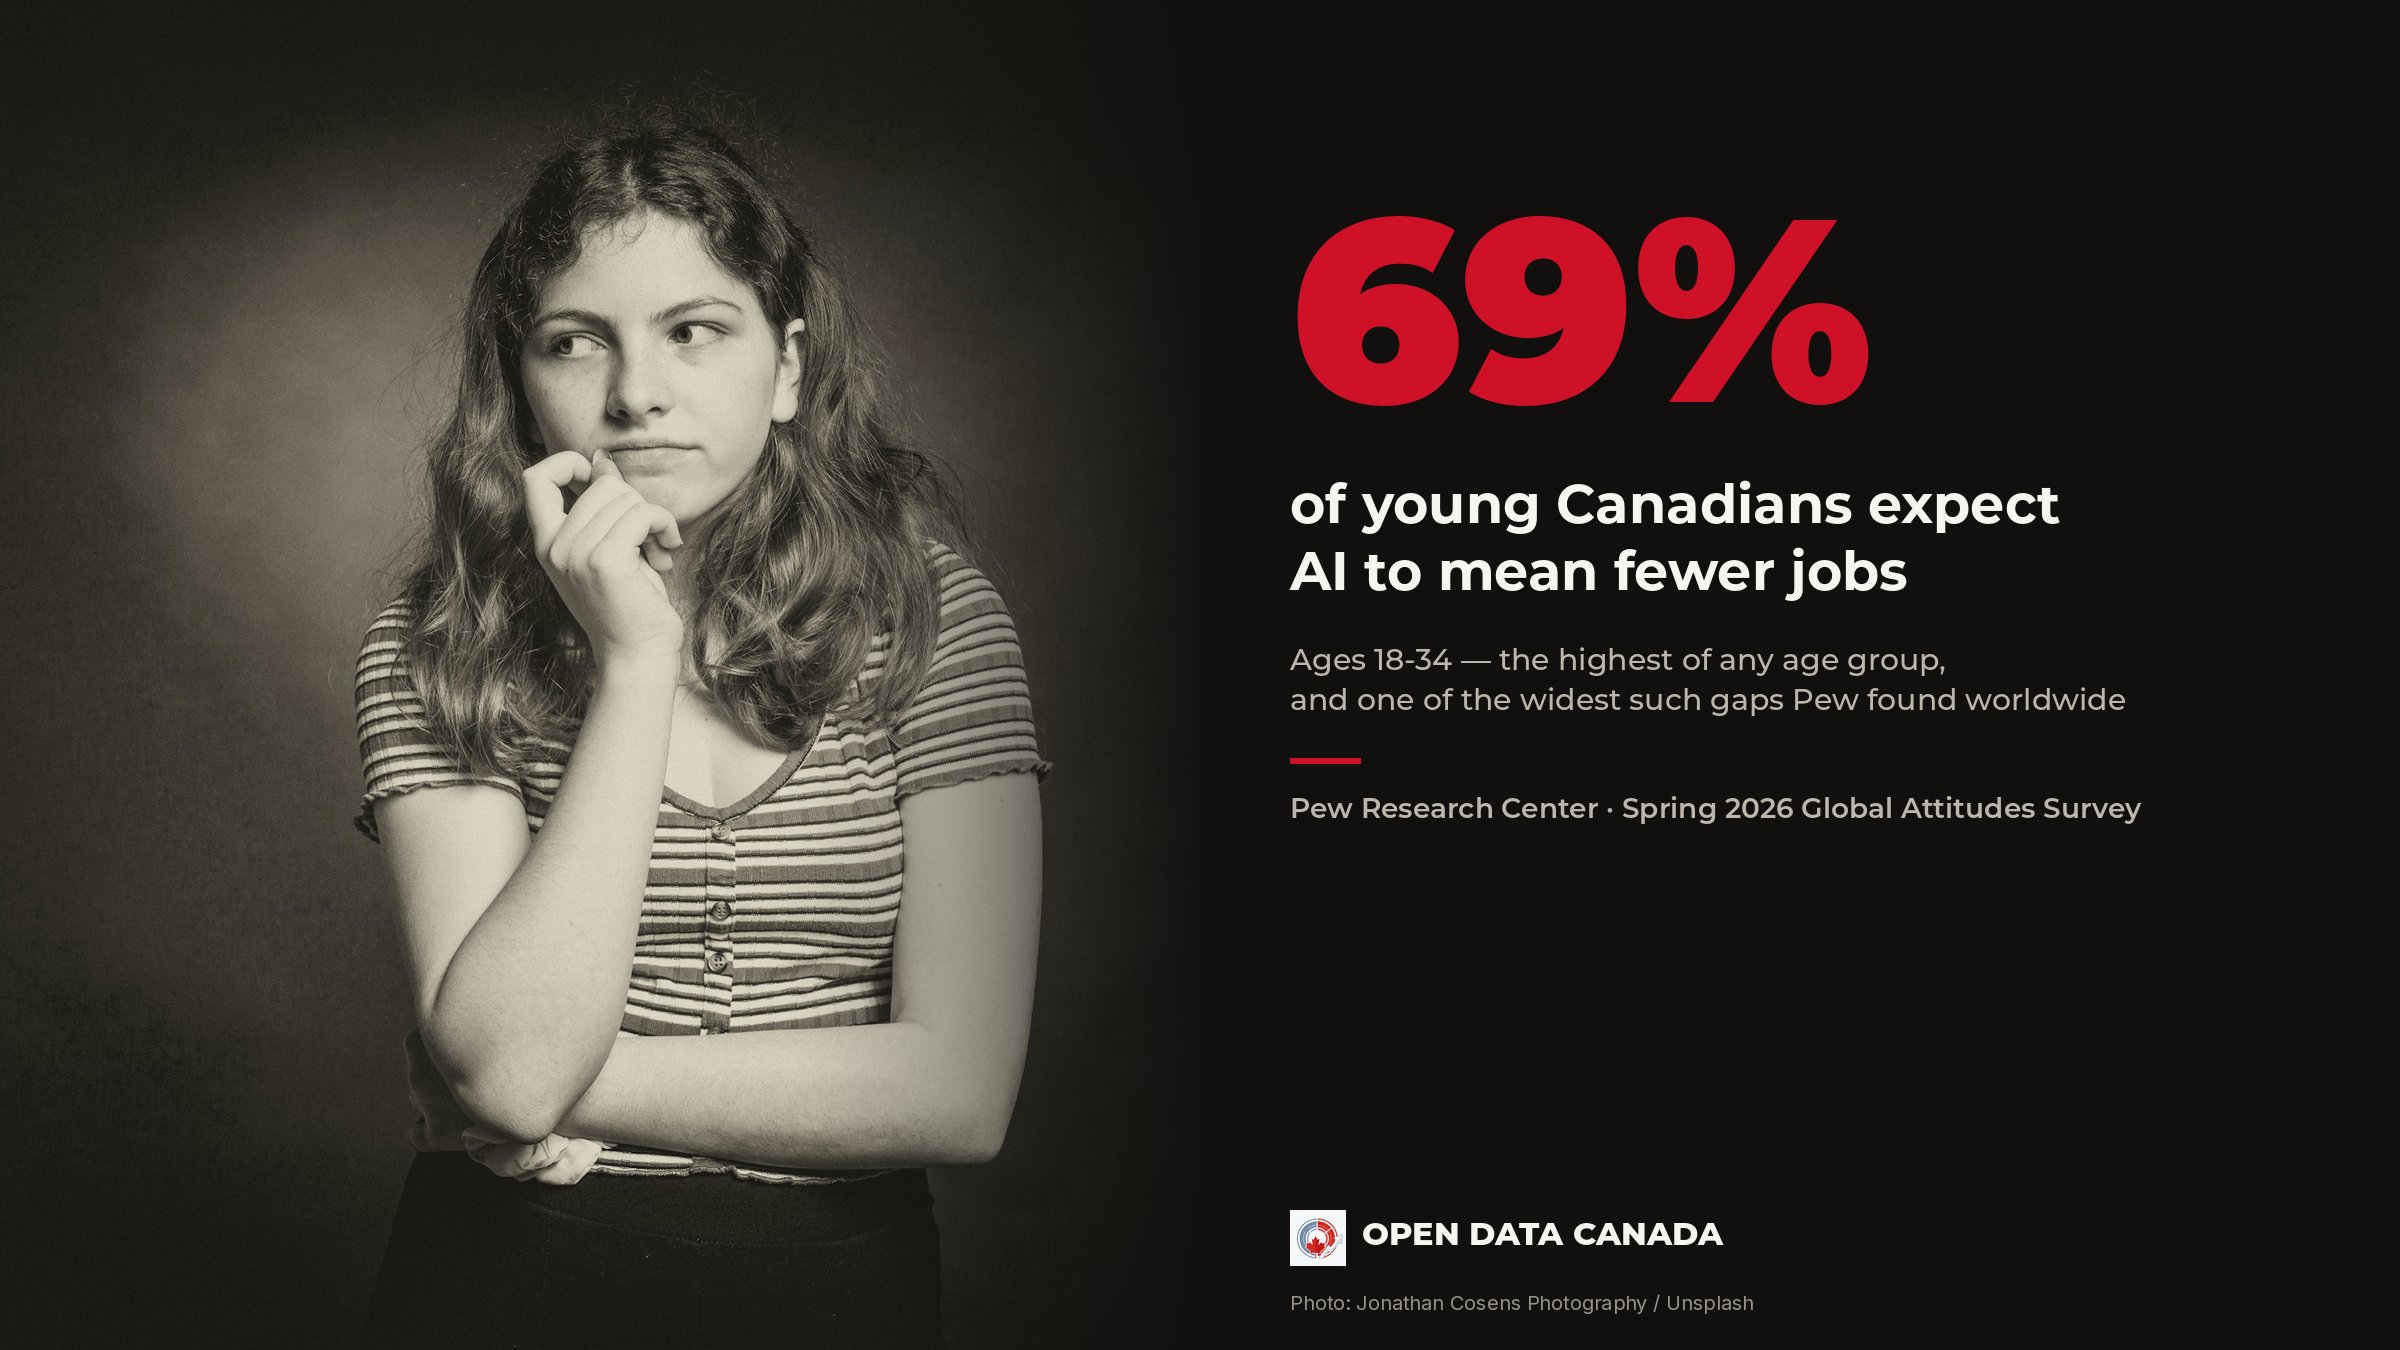
Young Canadians Are the Most Pessimistic About What AI Will Do to Jobs
69% of Canadians aged 18-34 expect AI to mean fewer jobs in Canada over the next 20 years — more than any older age group, and one of the larger such generational gaps Pew found anywhere in the world.
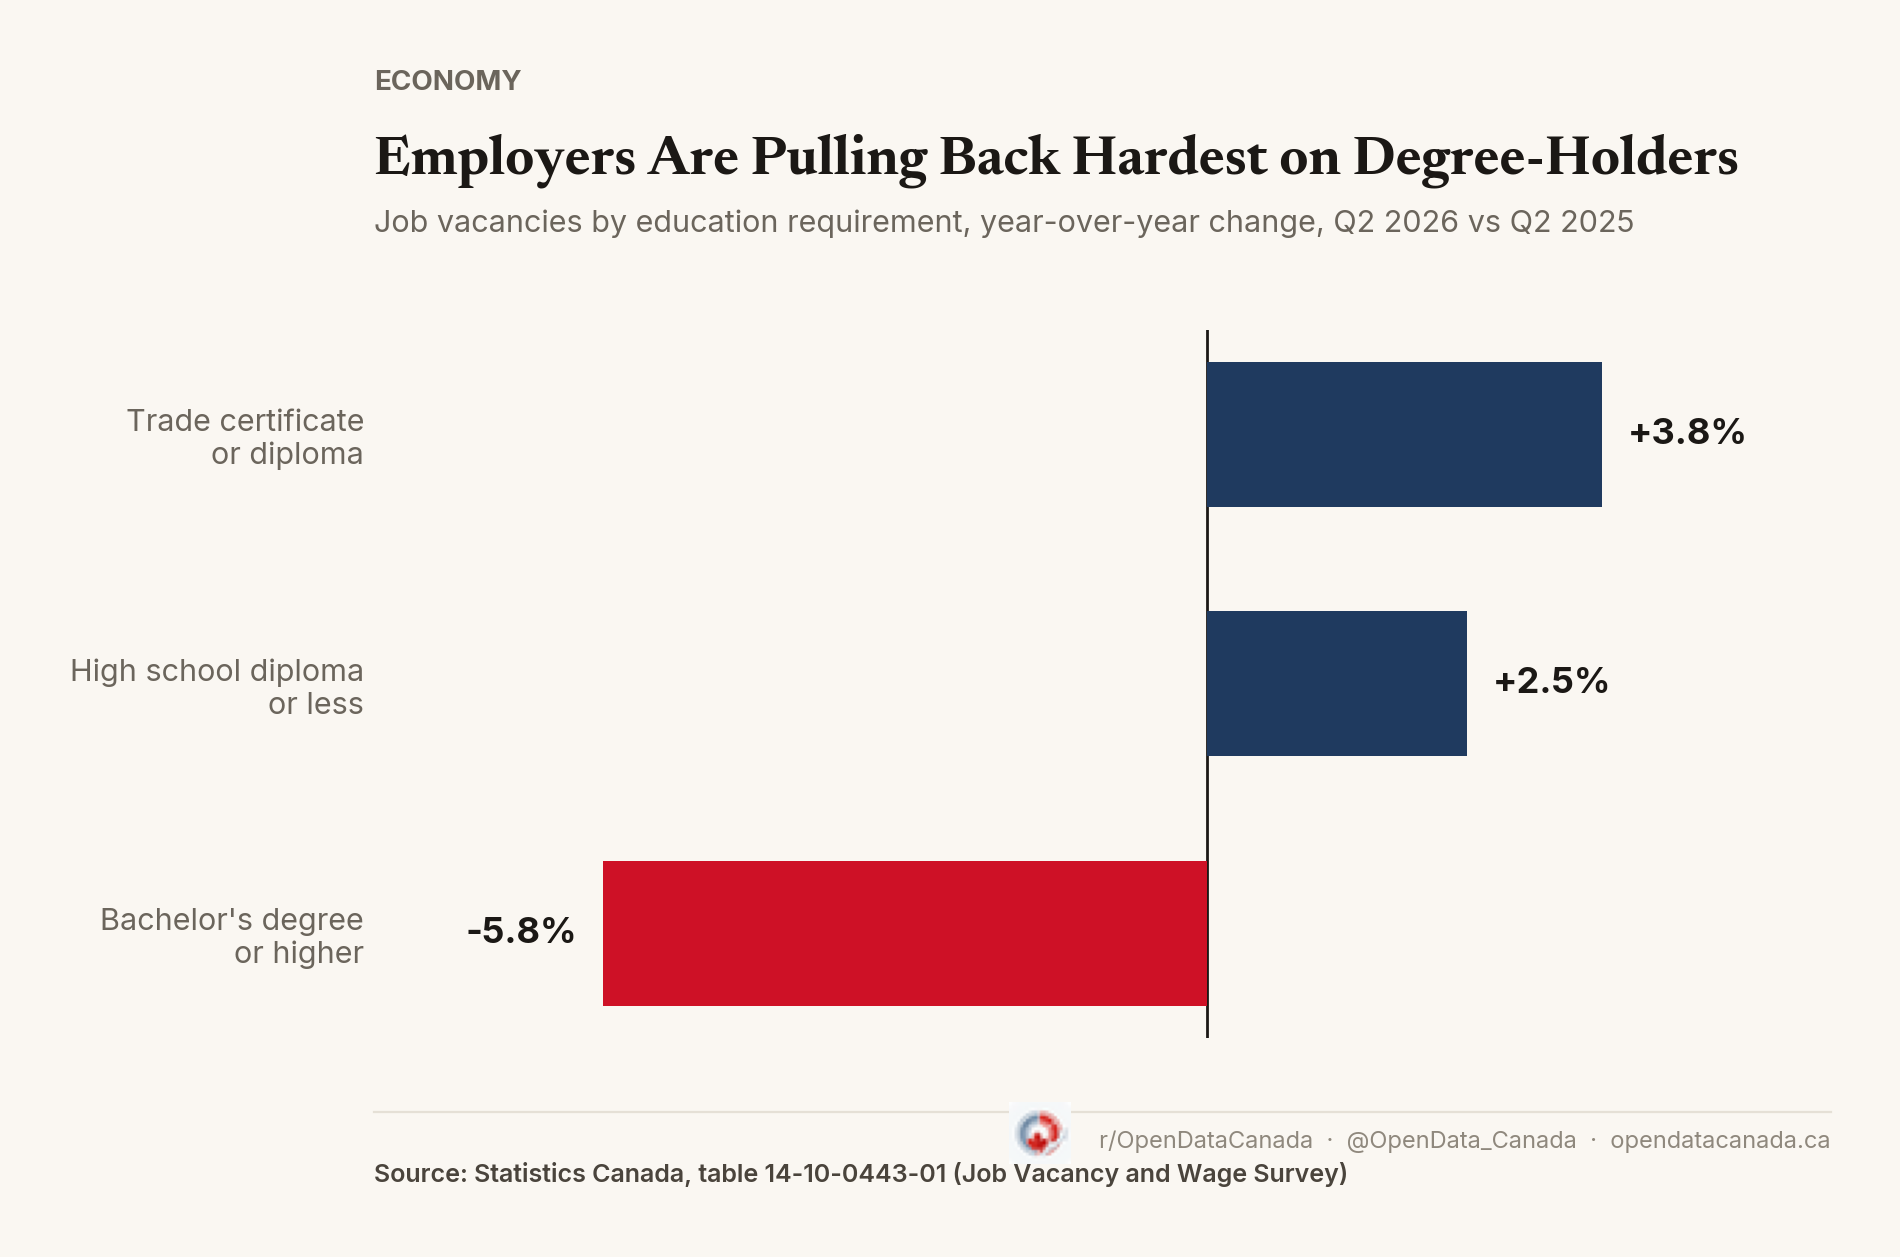
Canada's Job Market Is Changing Unevenly
Total job vacancies barely moved in the second quarter. But vacancies moved in different directions by education and occupation: down 5.8 percent for positions requiring a bachelor's degree, up 3.8 percent for positions requiring a trade certificate.
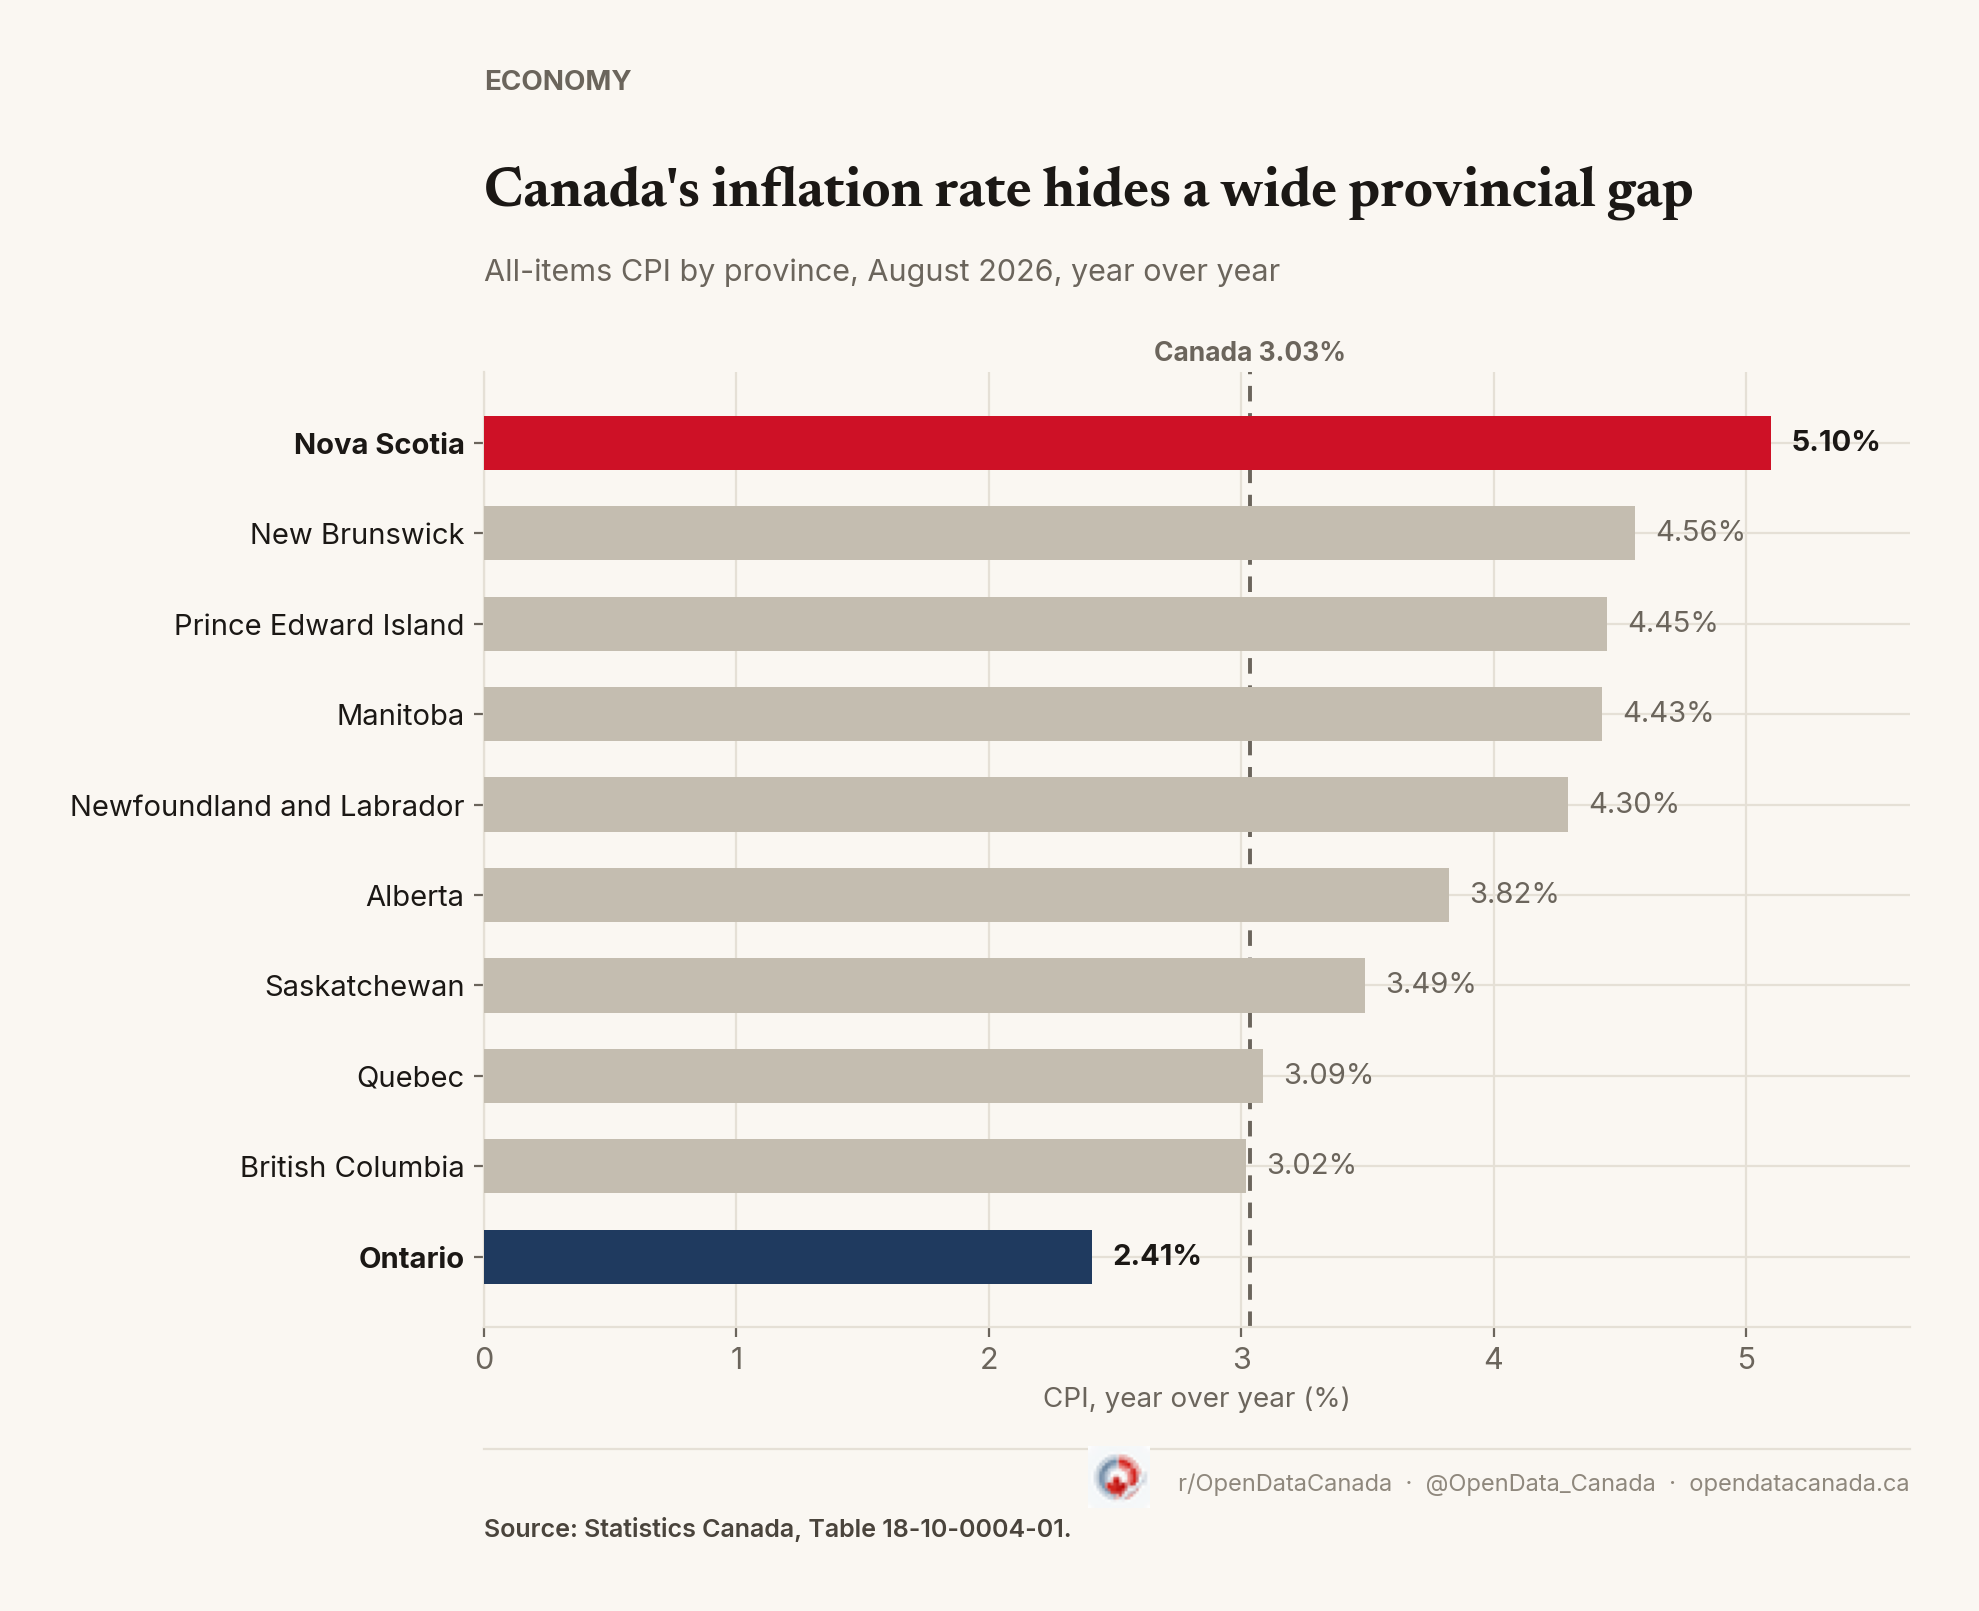
Canada's 3% inflation rate masks a much wider provincial split
From 2.41% in Ontario to 5.10% in Nova Scotia — Statistics Canada's August 2026 CPI release shows one of the widest provincial inflation gaps of the past year, and it traces back almost entirely to a single category: shelter.

Women in Public-Sector Industries Were 34% More Likely to Have a First Child
A new StatCan study links Canadian women's chances of having a first child to where they work. Women in public administration, education and health have pulled far ahead of women in administrative and service jobs since 2017. Union coverage matters too, but only modestly, and income still matters more than either.
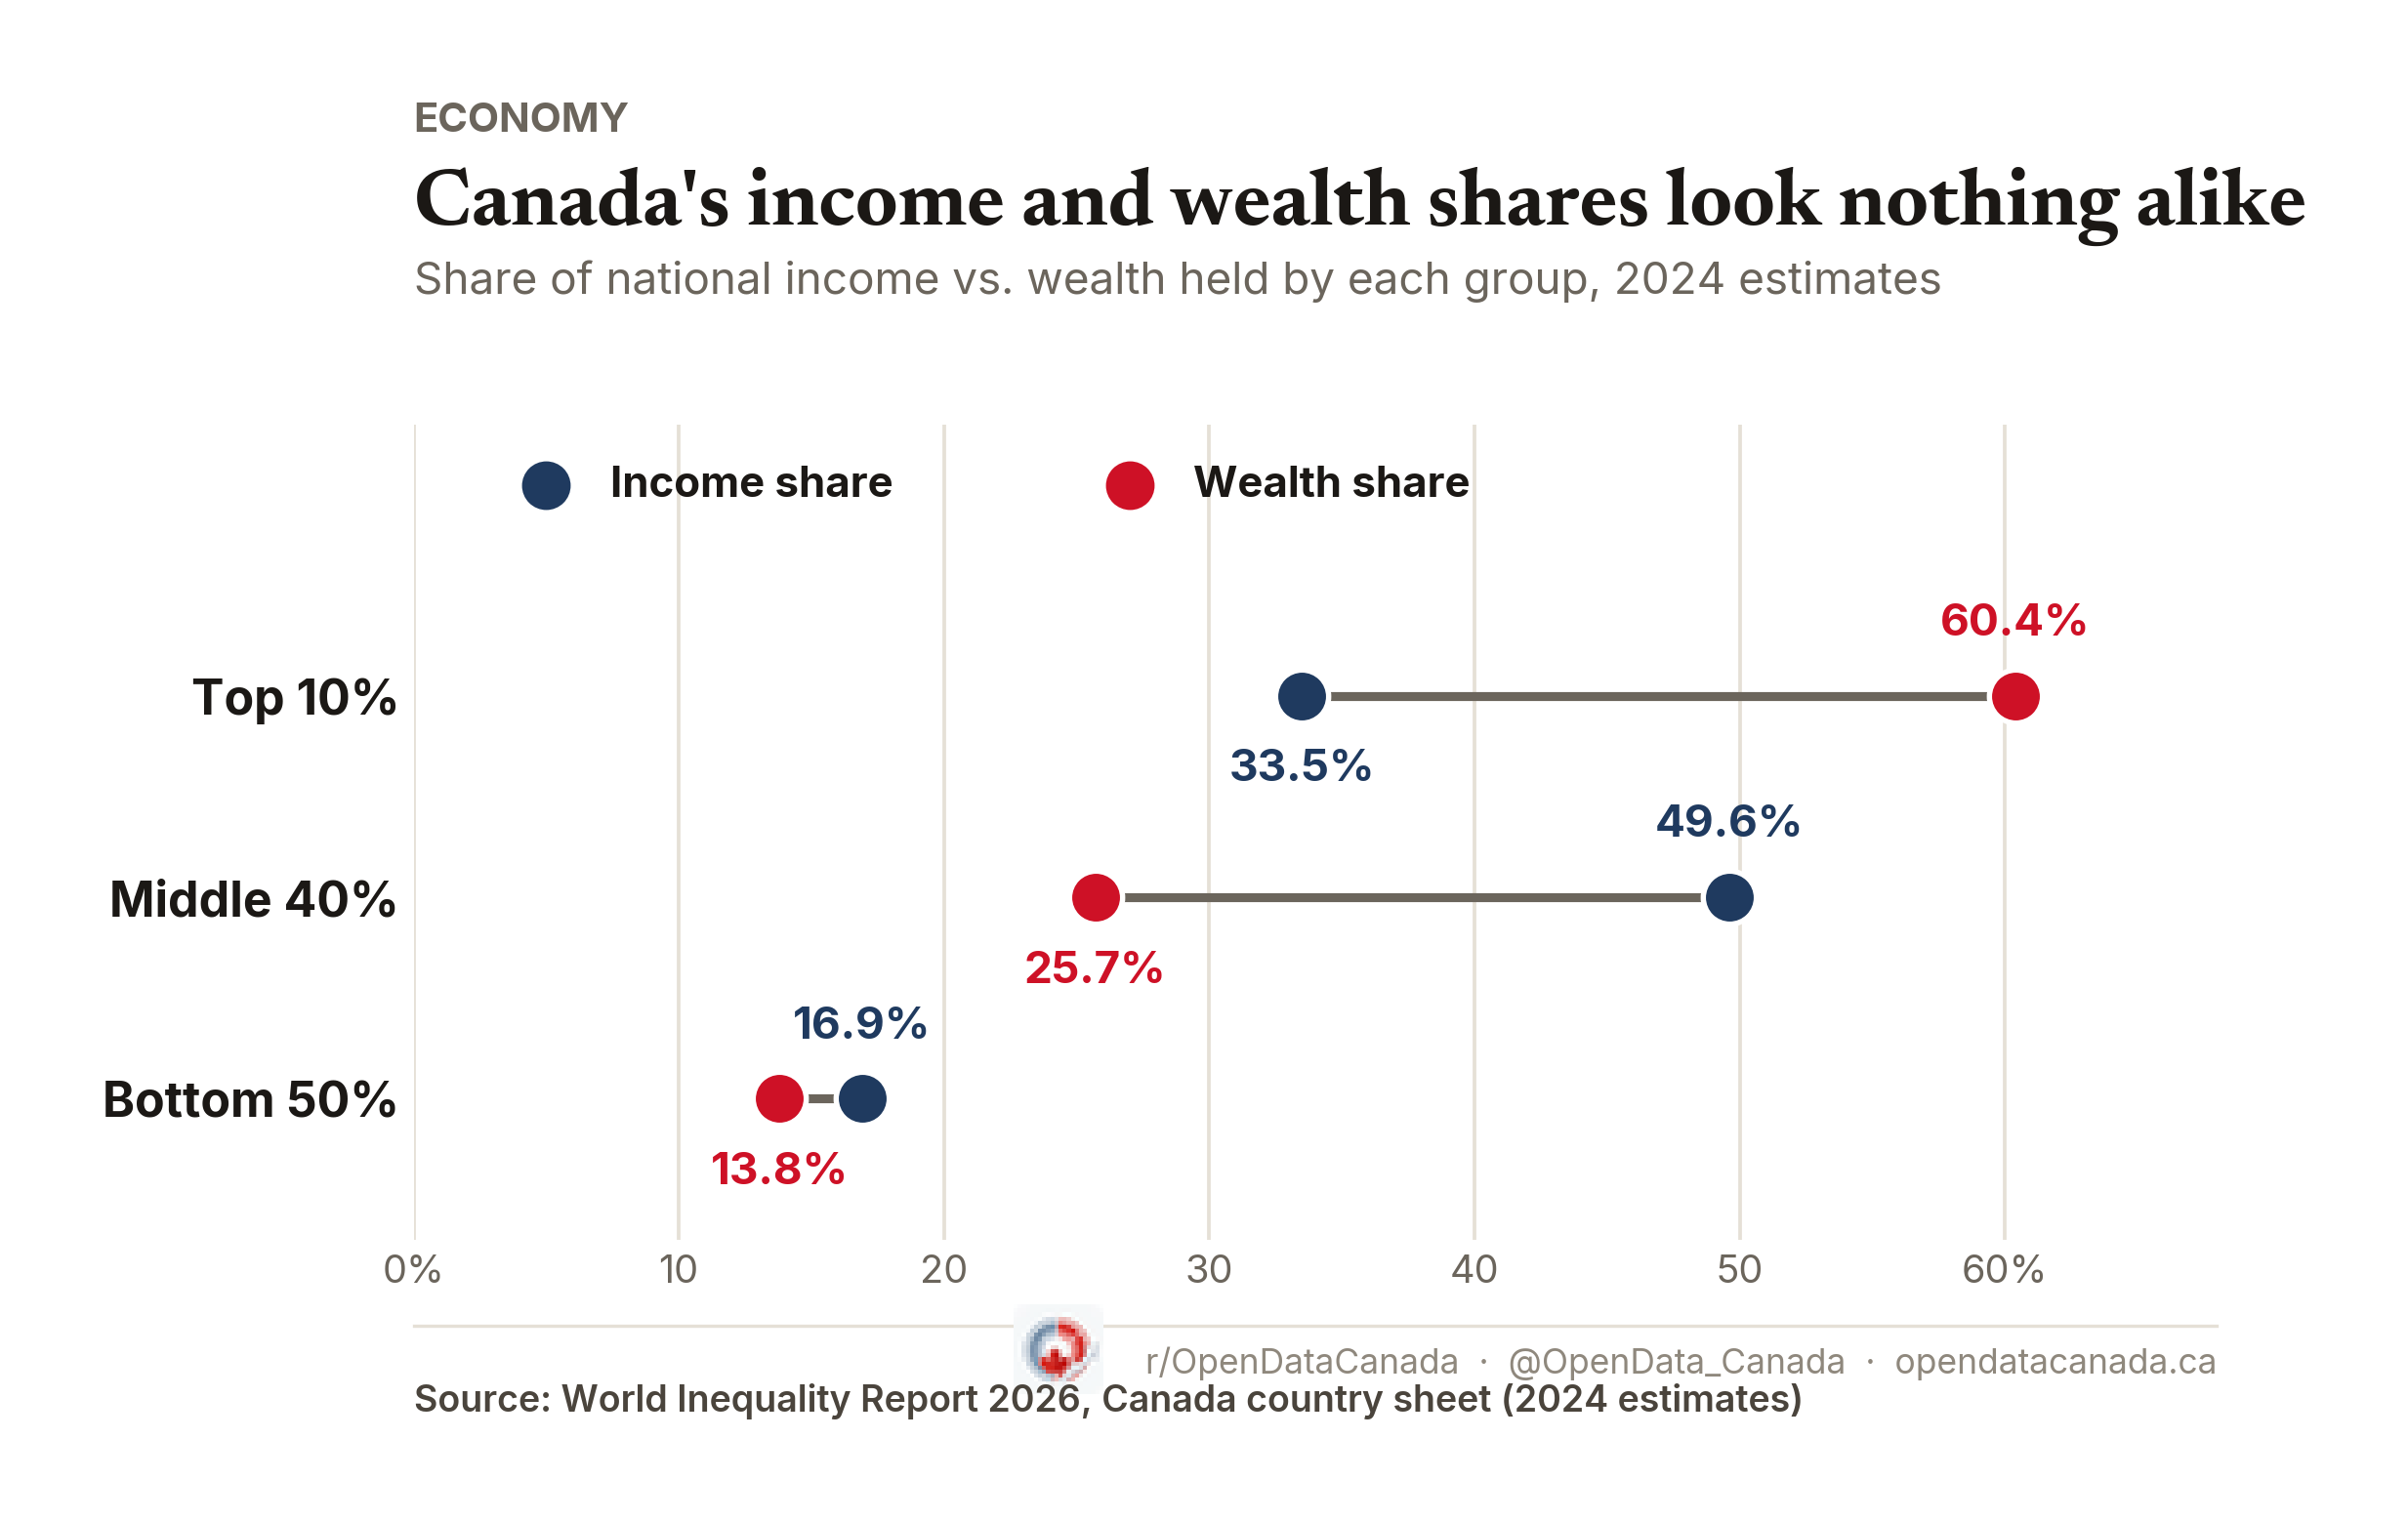
Canada Looks Relatively Equal on Income. Then You Look at Wealth.
Canada's top 10% earn 33.5% of national income but hold 60.4% of wealth. The middle 40% owns just 25.7% of wealth, the lowest share of 15 high-income democracies compared here.
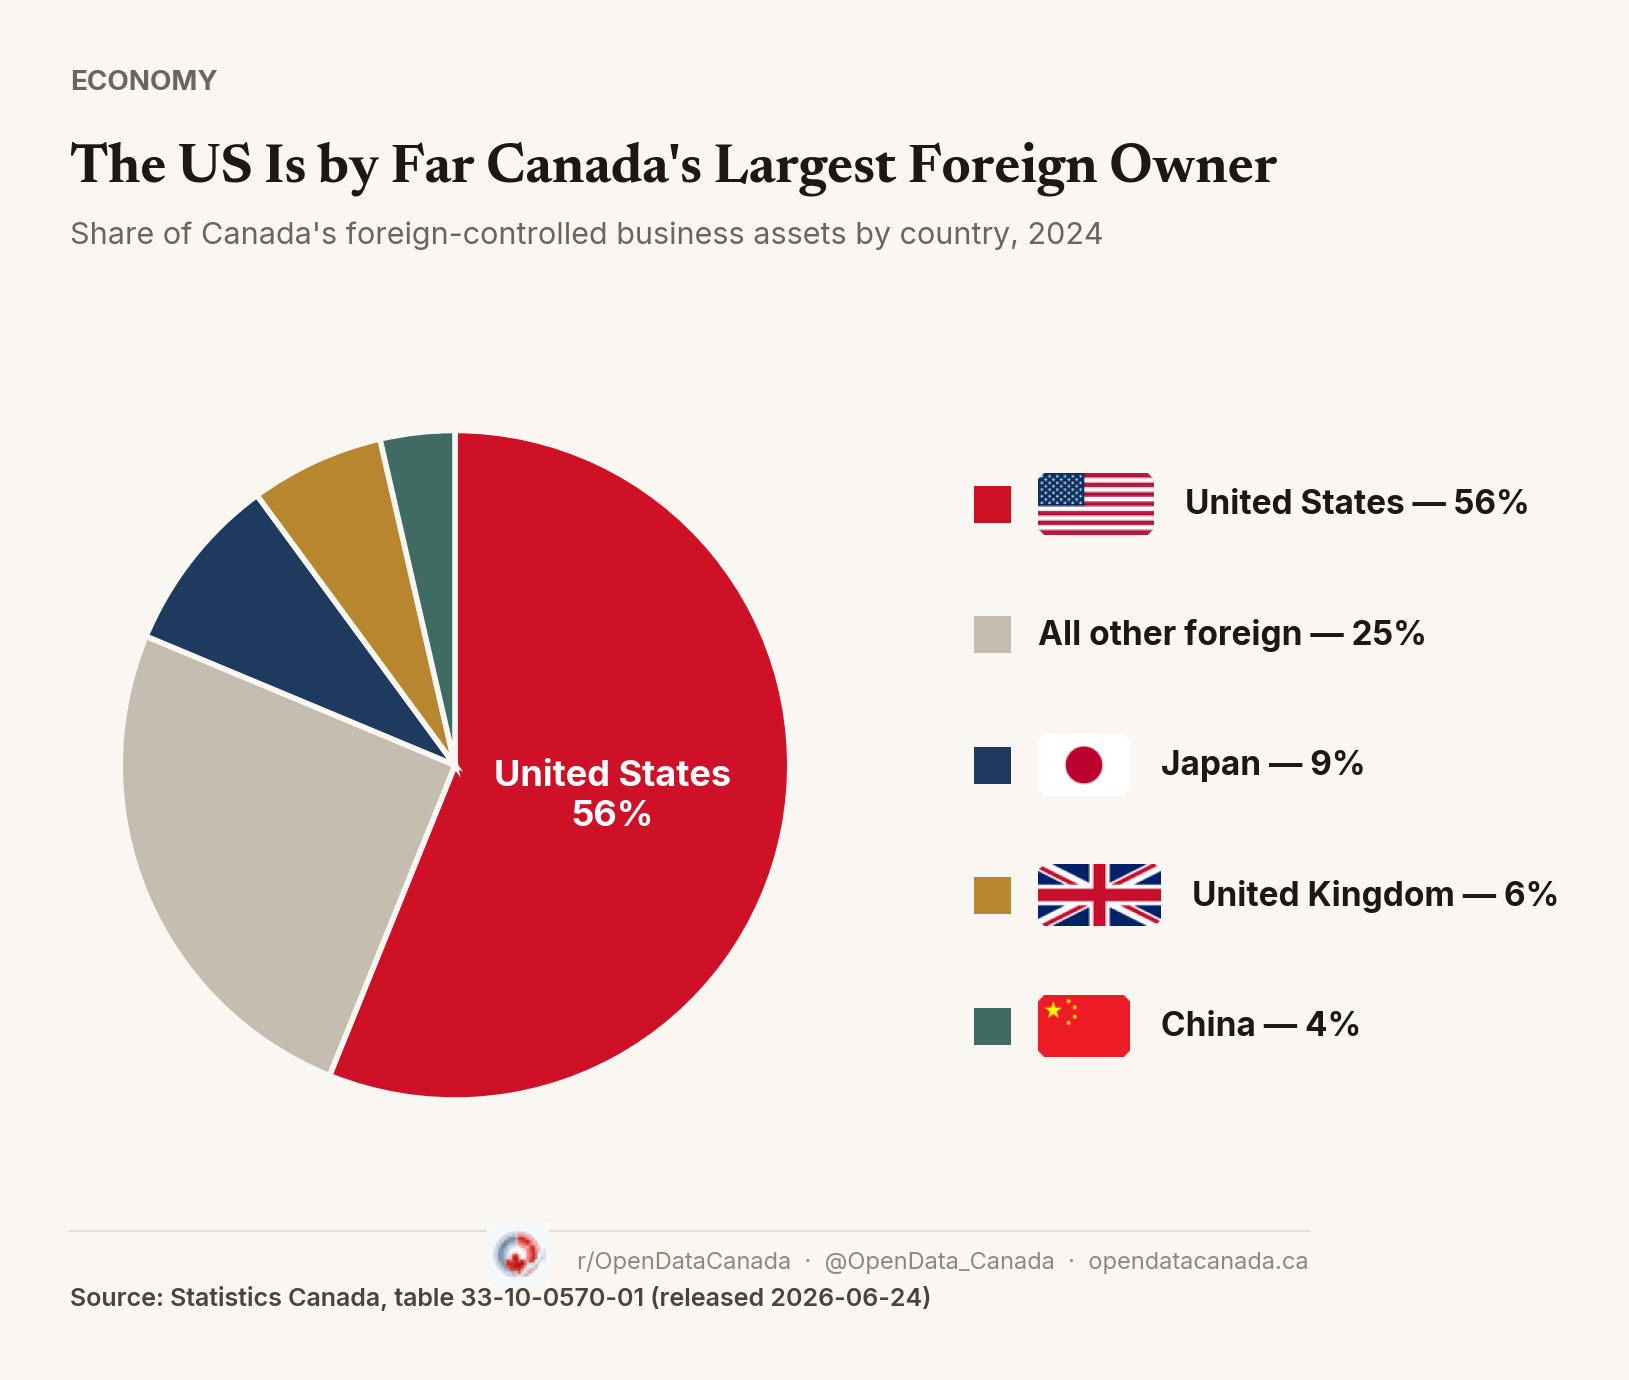
Foreign Control of Canada's Businesses Has Been Shrinking for 14 Straight Years — And More Than Half of What's Left Is American
In 2024, foreign investors legally controlled 13.9% of the assets held by businesses operating in Canada, the lowest figure Statistics Canada has recorded since the series began in 2010. Of that shrinking foreign share, the United States alone accounts for more than half.
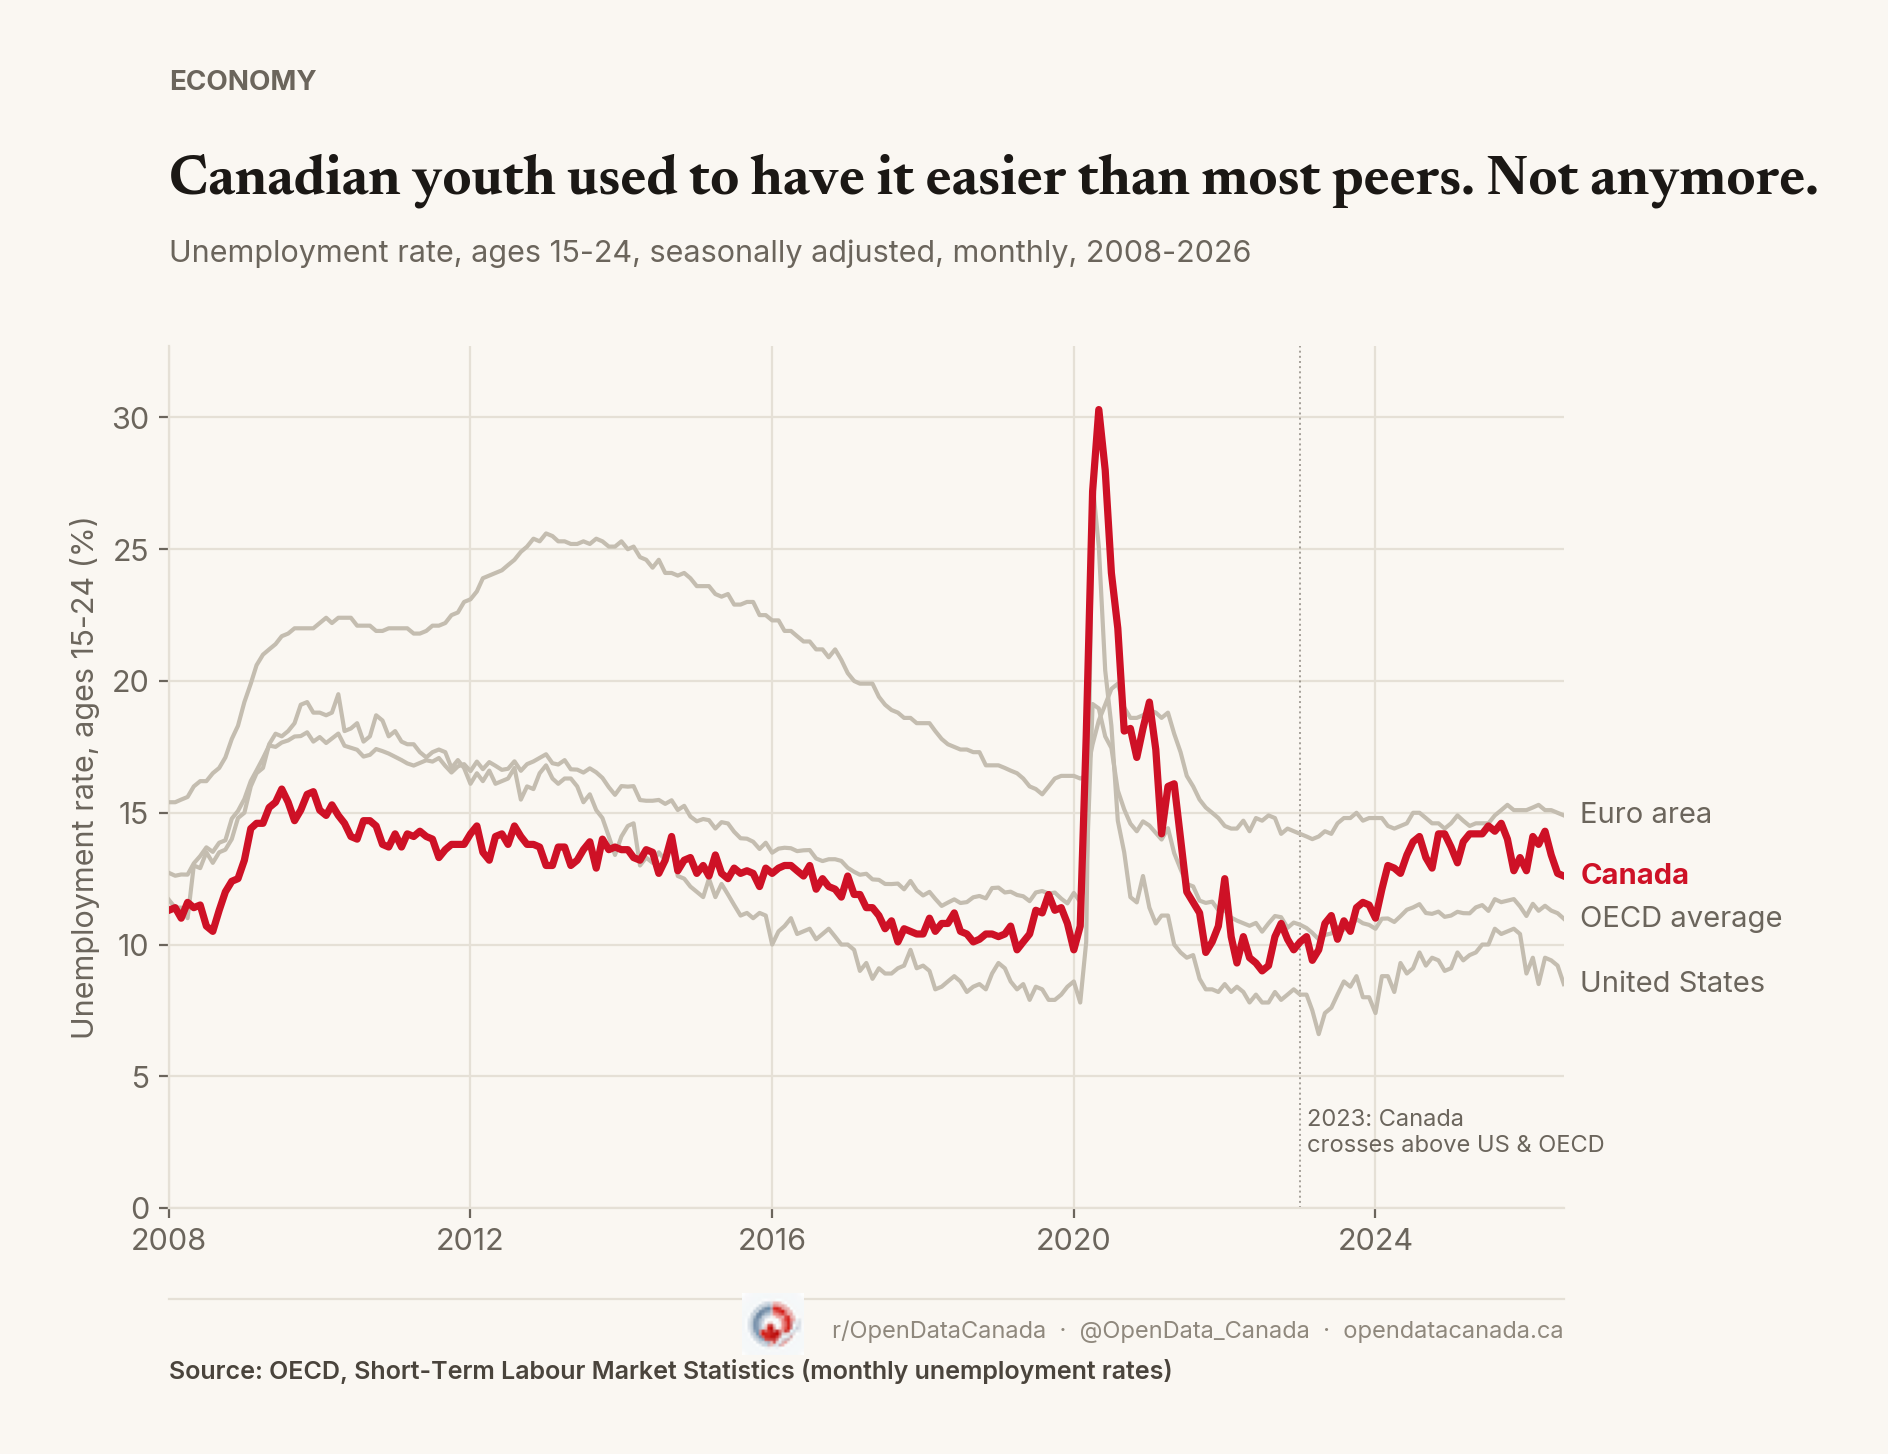
Canada's Youth Unemployment Rate Is Now Above the US and OECD Average
For most of the past two decades, Canada's youth unemployment rate sat below the OECD average. Since late 2023 that has flipped. Canadian youth are now more likely to be unemployed than their peers in the United States or across the OECD as a whole, and Statistics Canada's own numbers confirm it.

Nearly Half of Businesses Selling Soon Say They Could Shrink or Close Without a Buyer
A brand-new Statistics Canada table shows 20.3 percent of private-sector businesses in Canada plan to sell or transfer ownership within 10 years, rising to 26.6 percent among businesses more than 20 years old. Among the smaller group planning to sell within 2 years, StatCan asked for the first time what happens if a buyer can't be found: 46.8 percent called closing or scaling down likely, and 46.5 percent called selling at a reduced price, or to a less-preferred buyer, likely too.
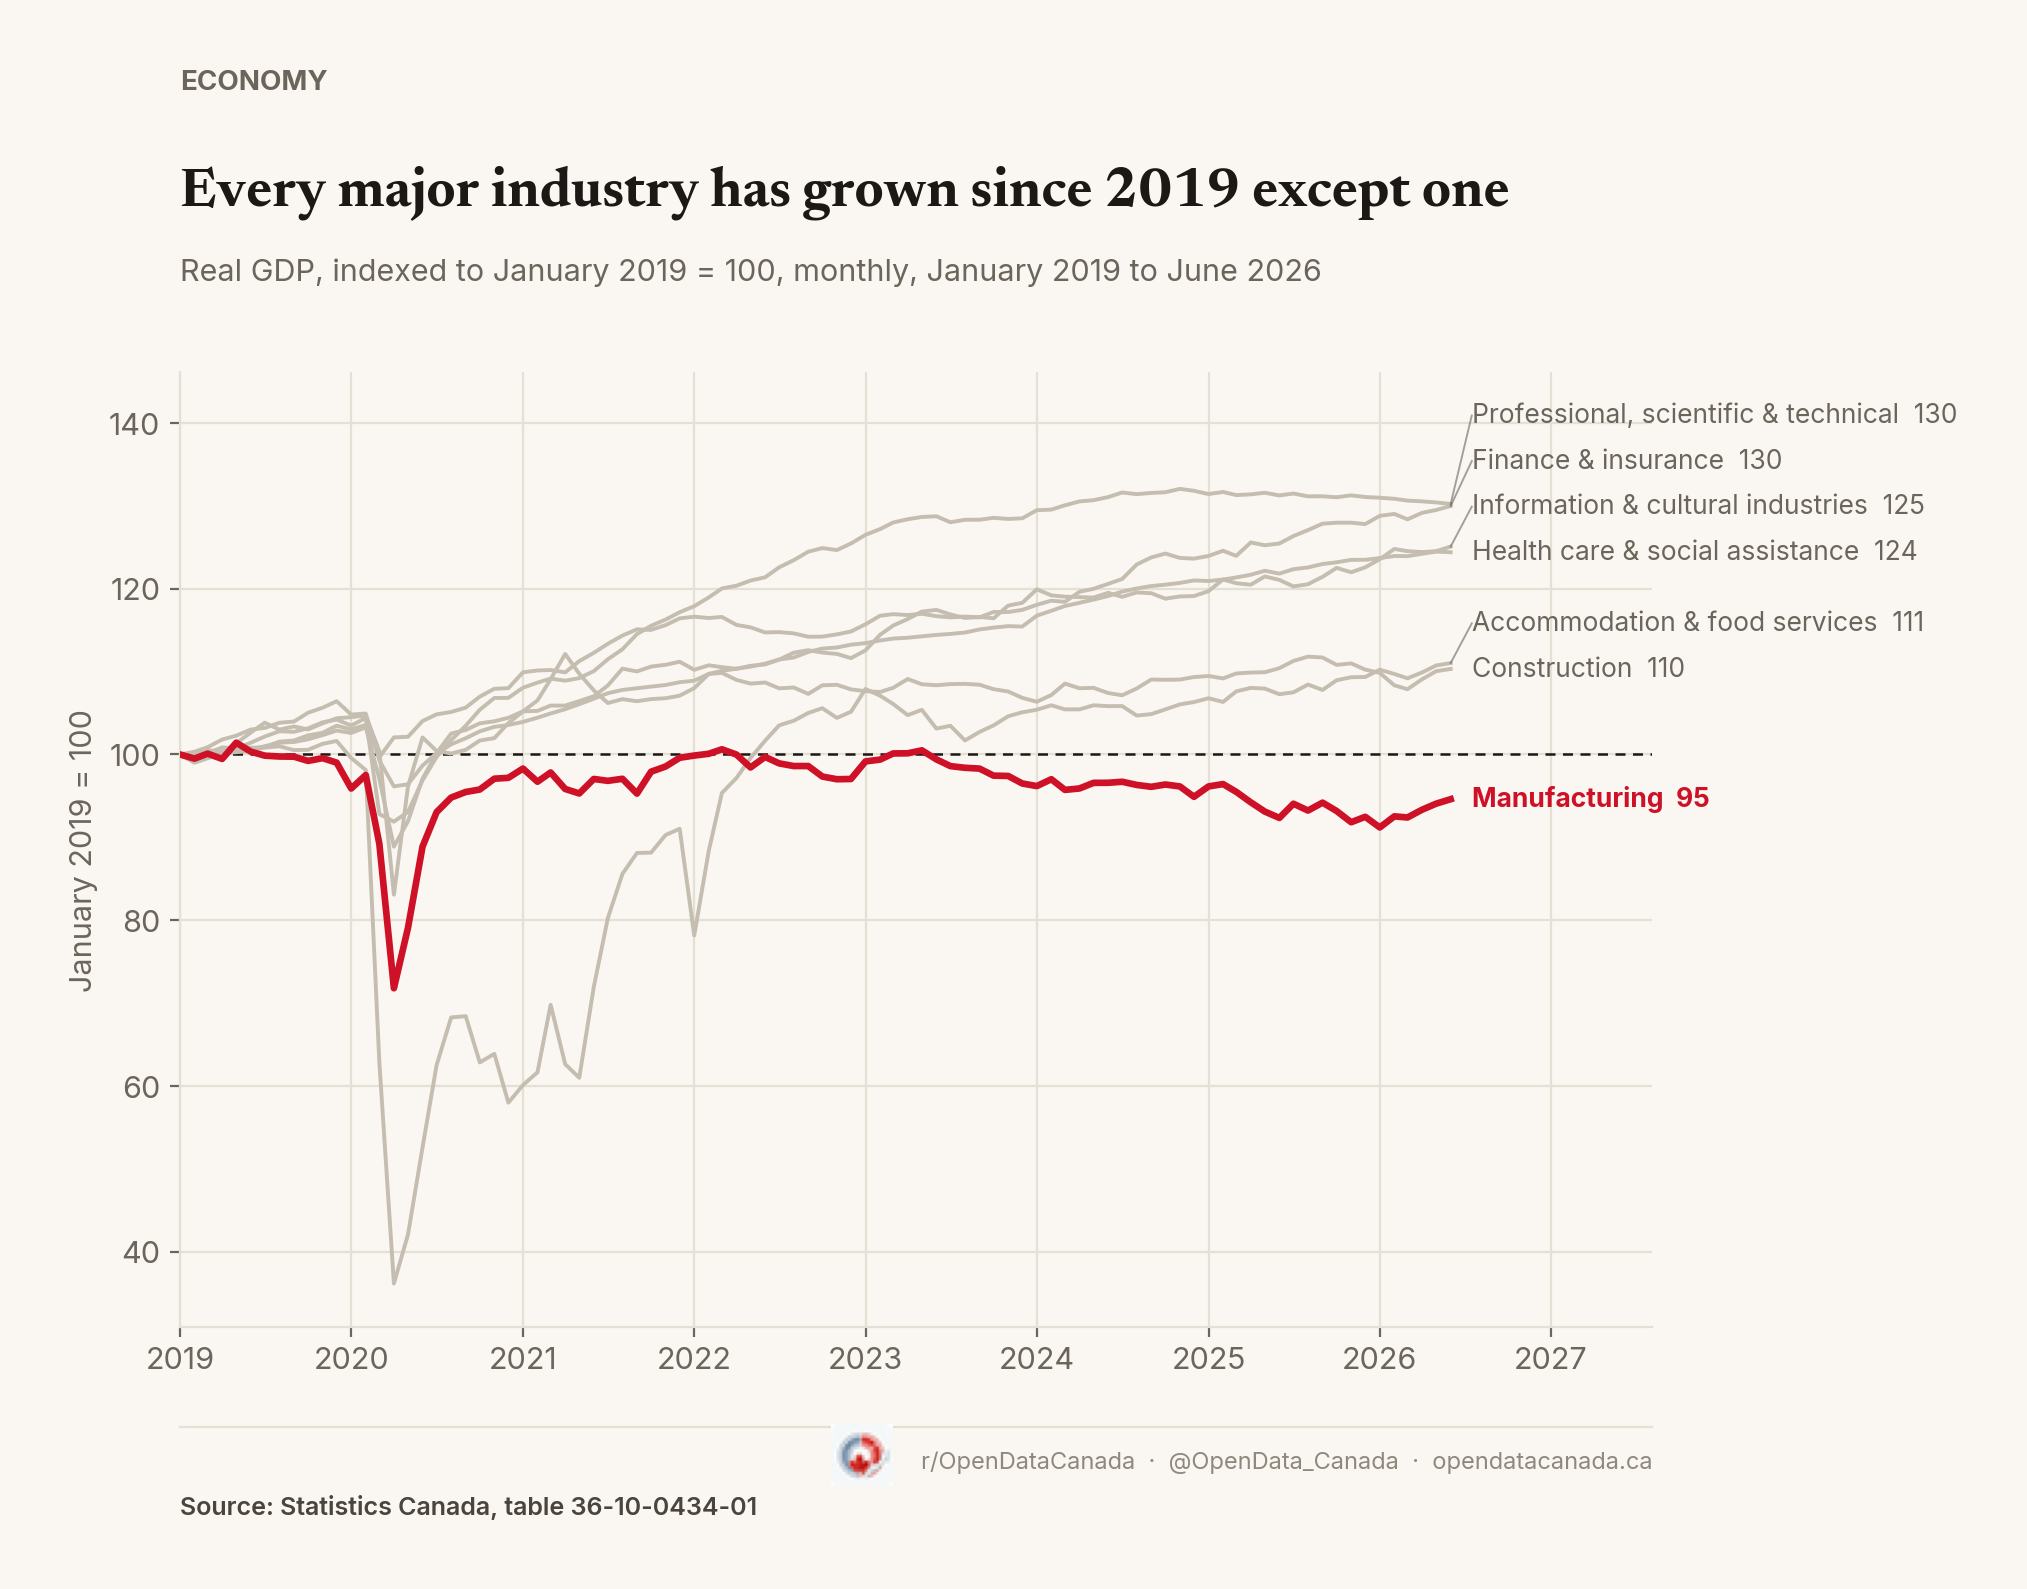
Manufacturing Is the Only Major Industry Smaller Than It Was in January 2019
Real GDP is up 14.6% since January 2019, but the industries behind that number aren't the ones you'd guess. Finance and professional services have each grown by nearly a third; health care by about a quarter. Manufacturing is the one broad industry that still hasn't gotten back to where it started.

Canada's mobile prices remain among the priciest in the G7 — and they're rising again.
Ottawa spent two years tracking wireless prices down and declared victory in January 2022. A federal price-comparison study shows Canada has stayed among the three most expensive places for a basic mobile plan among G7 countries plus Australia, at every plan size tracked, and by late 2025 the prices that did fall were climbing again.
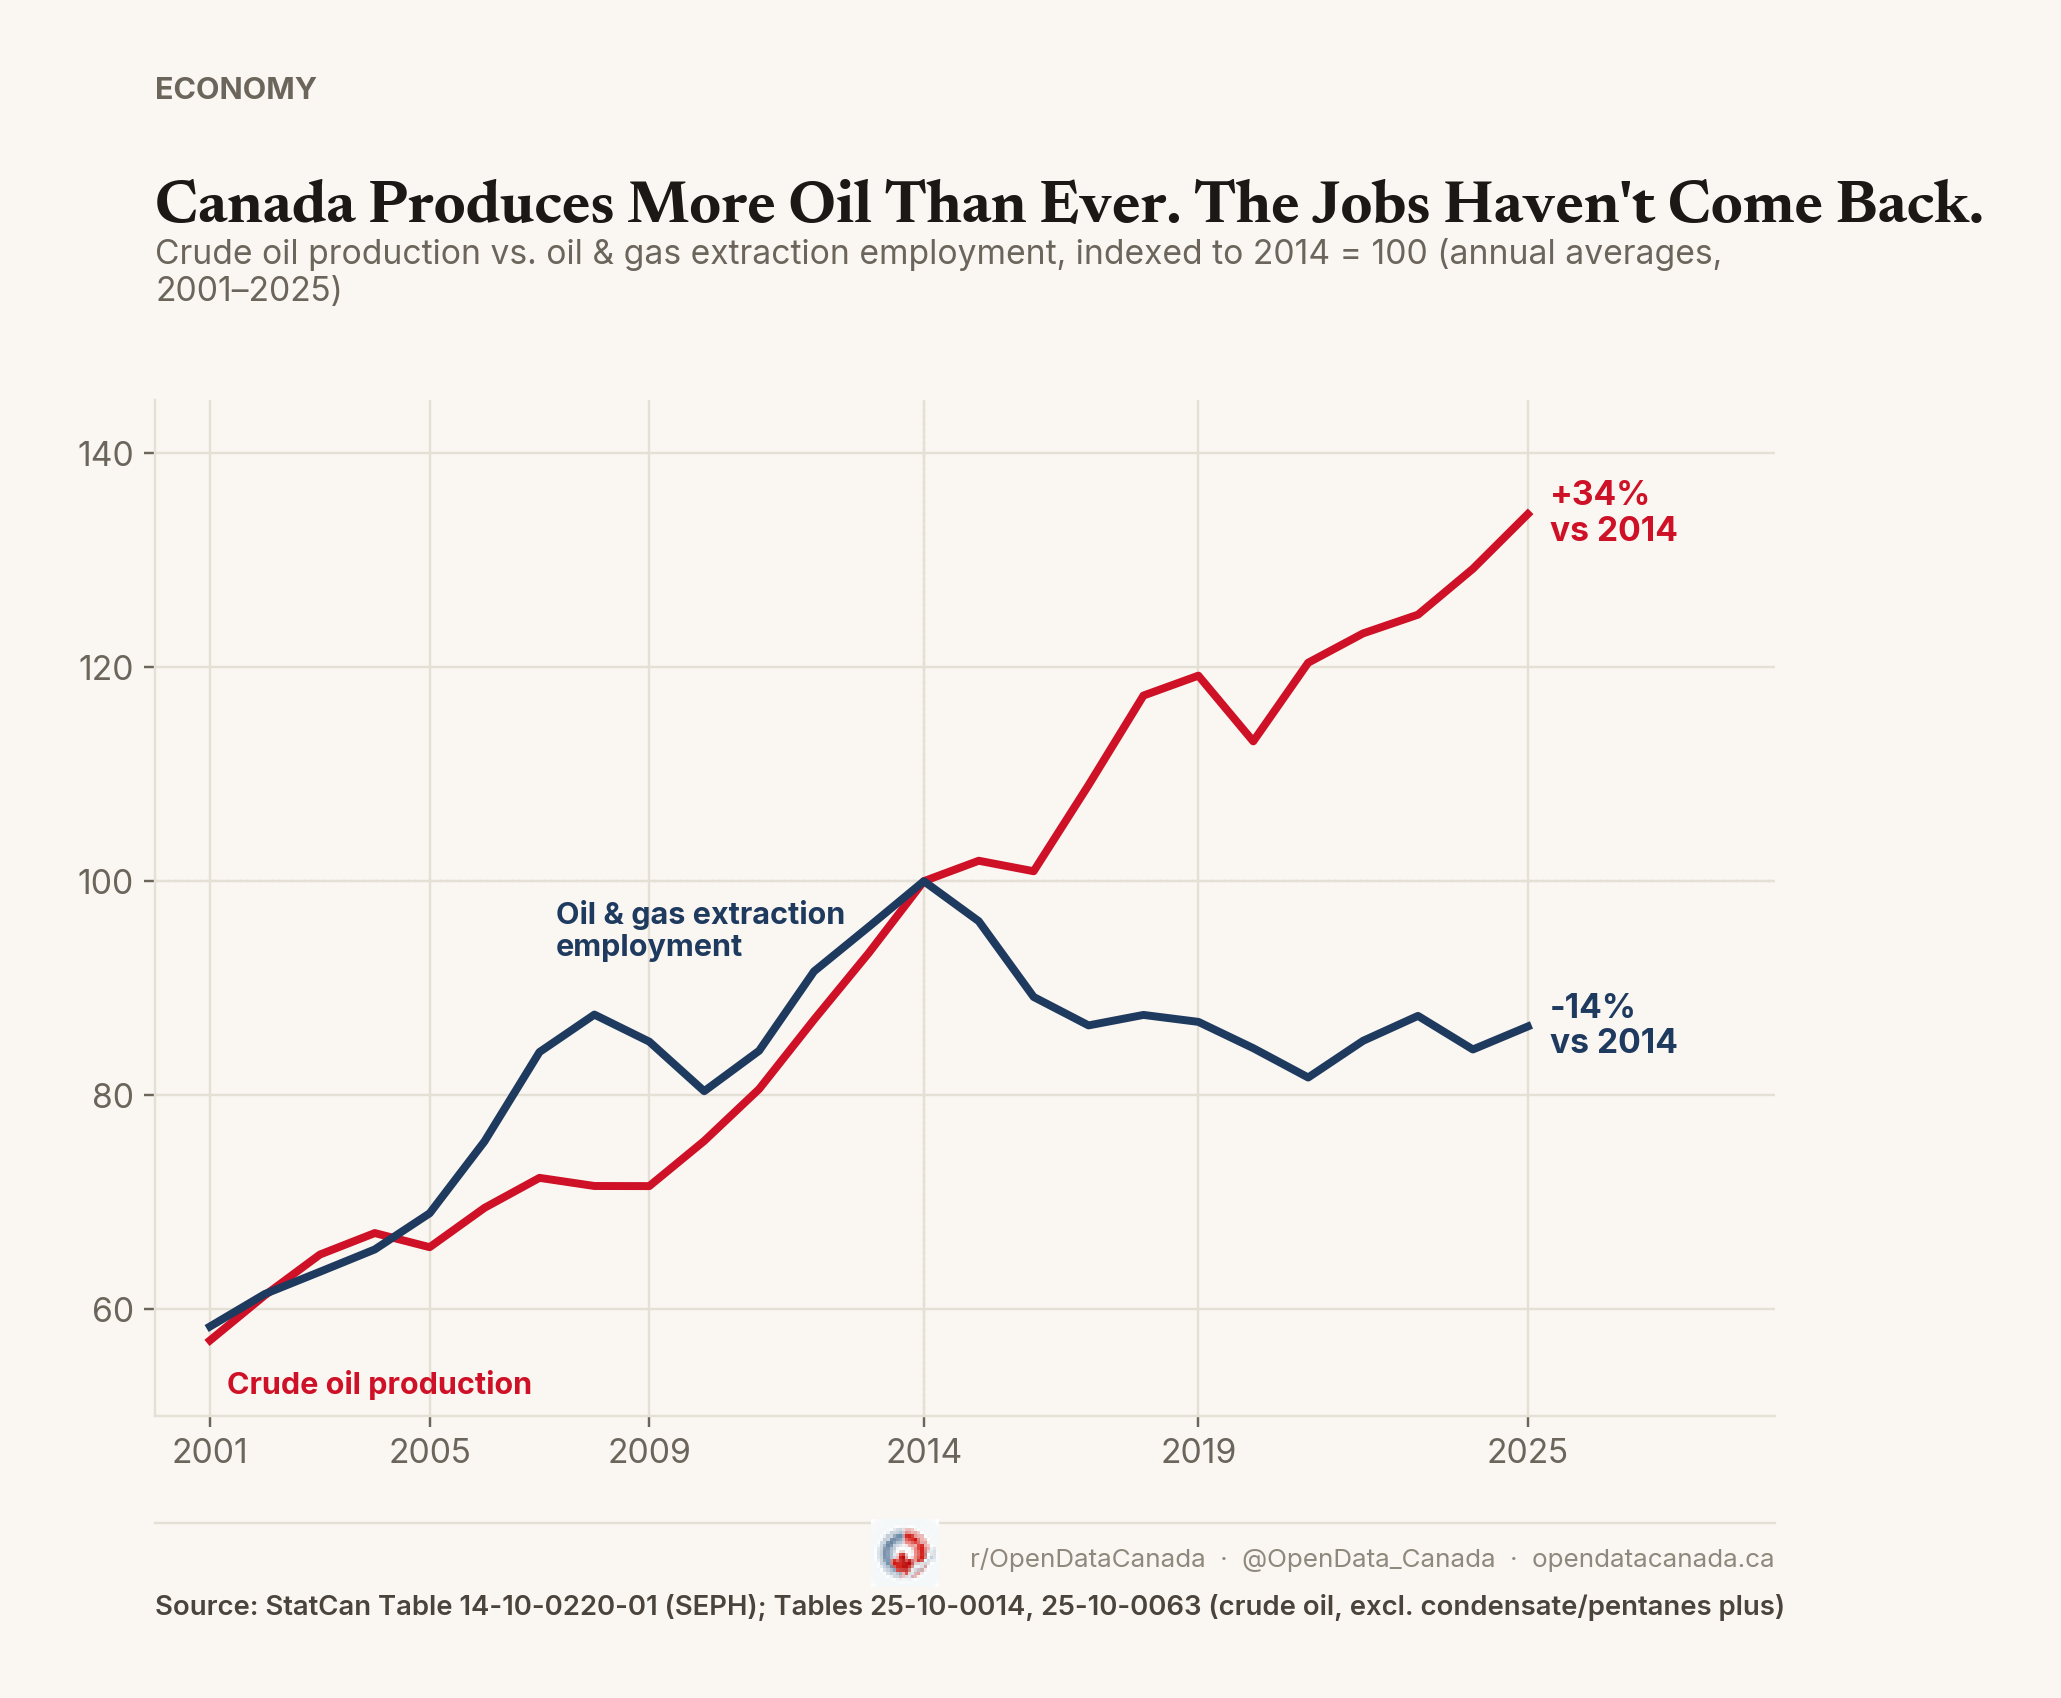
Canada Produces More Oil Than Ever. The Jobs Haven't Come Back.
Crude oil production is up 34% since 2014 and sits at a record high. Oil and gas extraction employment is down 13.6% over the same span and has never recovered its 2014 peak. Pembina Institute flagged a version of this gap in 2025; this piece extends the comparison through 2025 with Statistics Canada and Alberta Energy Regulator data, plus a separate look at oil sands capital spending.
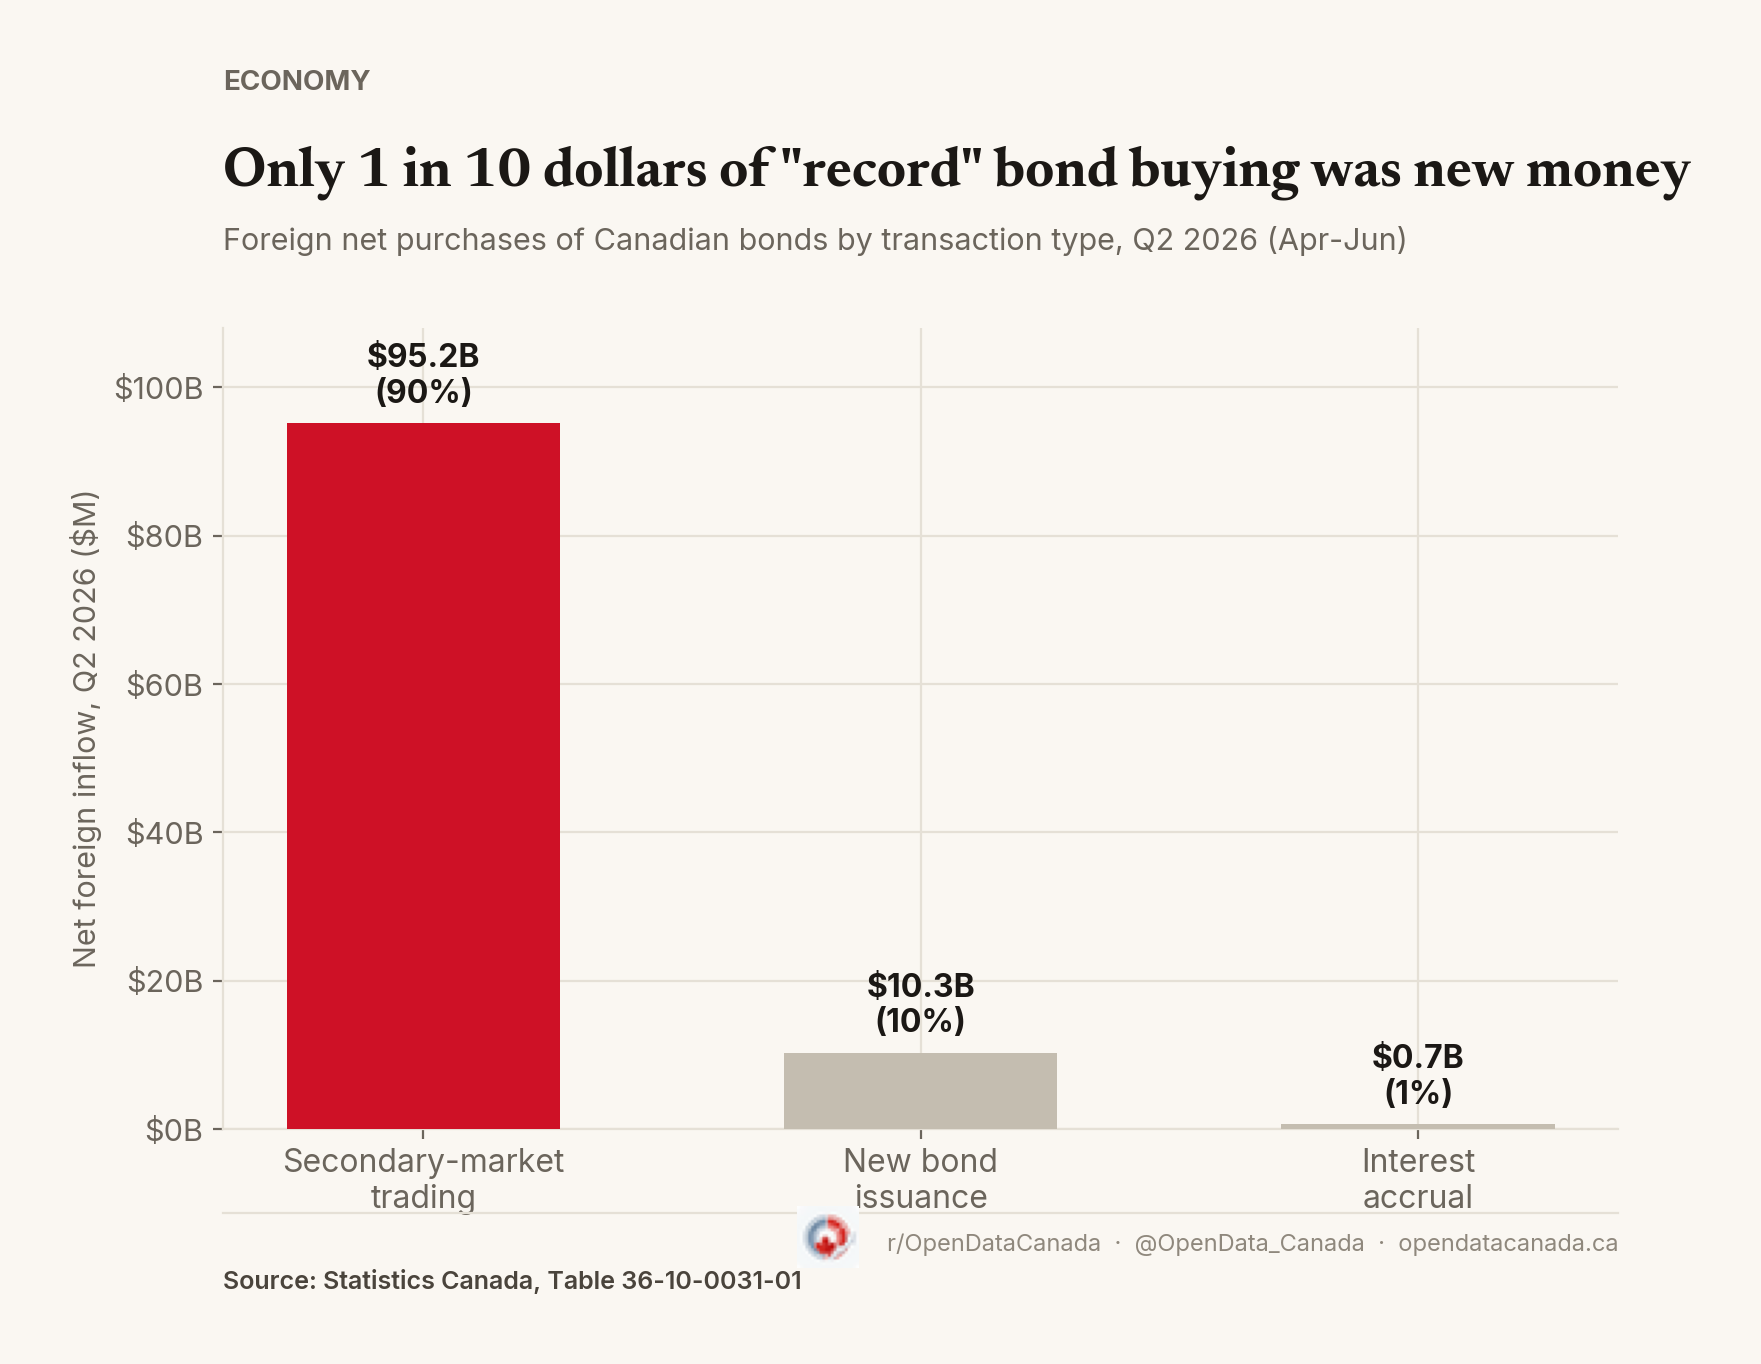
Foreigners bought 106B in Canadian bonds. Most wasn't new money.
Statistics Canada reported foreign investors bought a record 106 billion dollars of Canadian bonds in the second quarter of 2026, coverage that led with the headline number. Break the total down by transaction type and about 95 billion dollars was secondary-market trading of bonds that had already been issued — not new financing for Canadian borrowers.

Union Coverage Lowest in Alberta and Ontario, Highest Gains in P.E.I.
Alberta and Ontario have the lowest union coverage rates of any Canadian province in 2025, and both have bounced back from a low point since — Alberta's bounce three times as large as Ontario's. But being lowest today isn't the same as falling fastest: Prince Edward Island actually posted the largest gain of any province since 1997, while British Columbia, not Alberta or Ontario, saw the steepest decline of the full period.

Young Canadians Are More Likely to Think AI Data Centres Will Hurt the Economy
A Nanos poll finds a real generational split on whether AI data centres will hurt the economy, 38% of Canadians 18-34 versus 28% of those 55+. Opposition to government subsidies for building them is a separate story, high at every age, with no meaningful age gap at all.
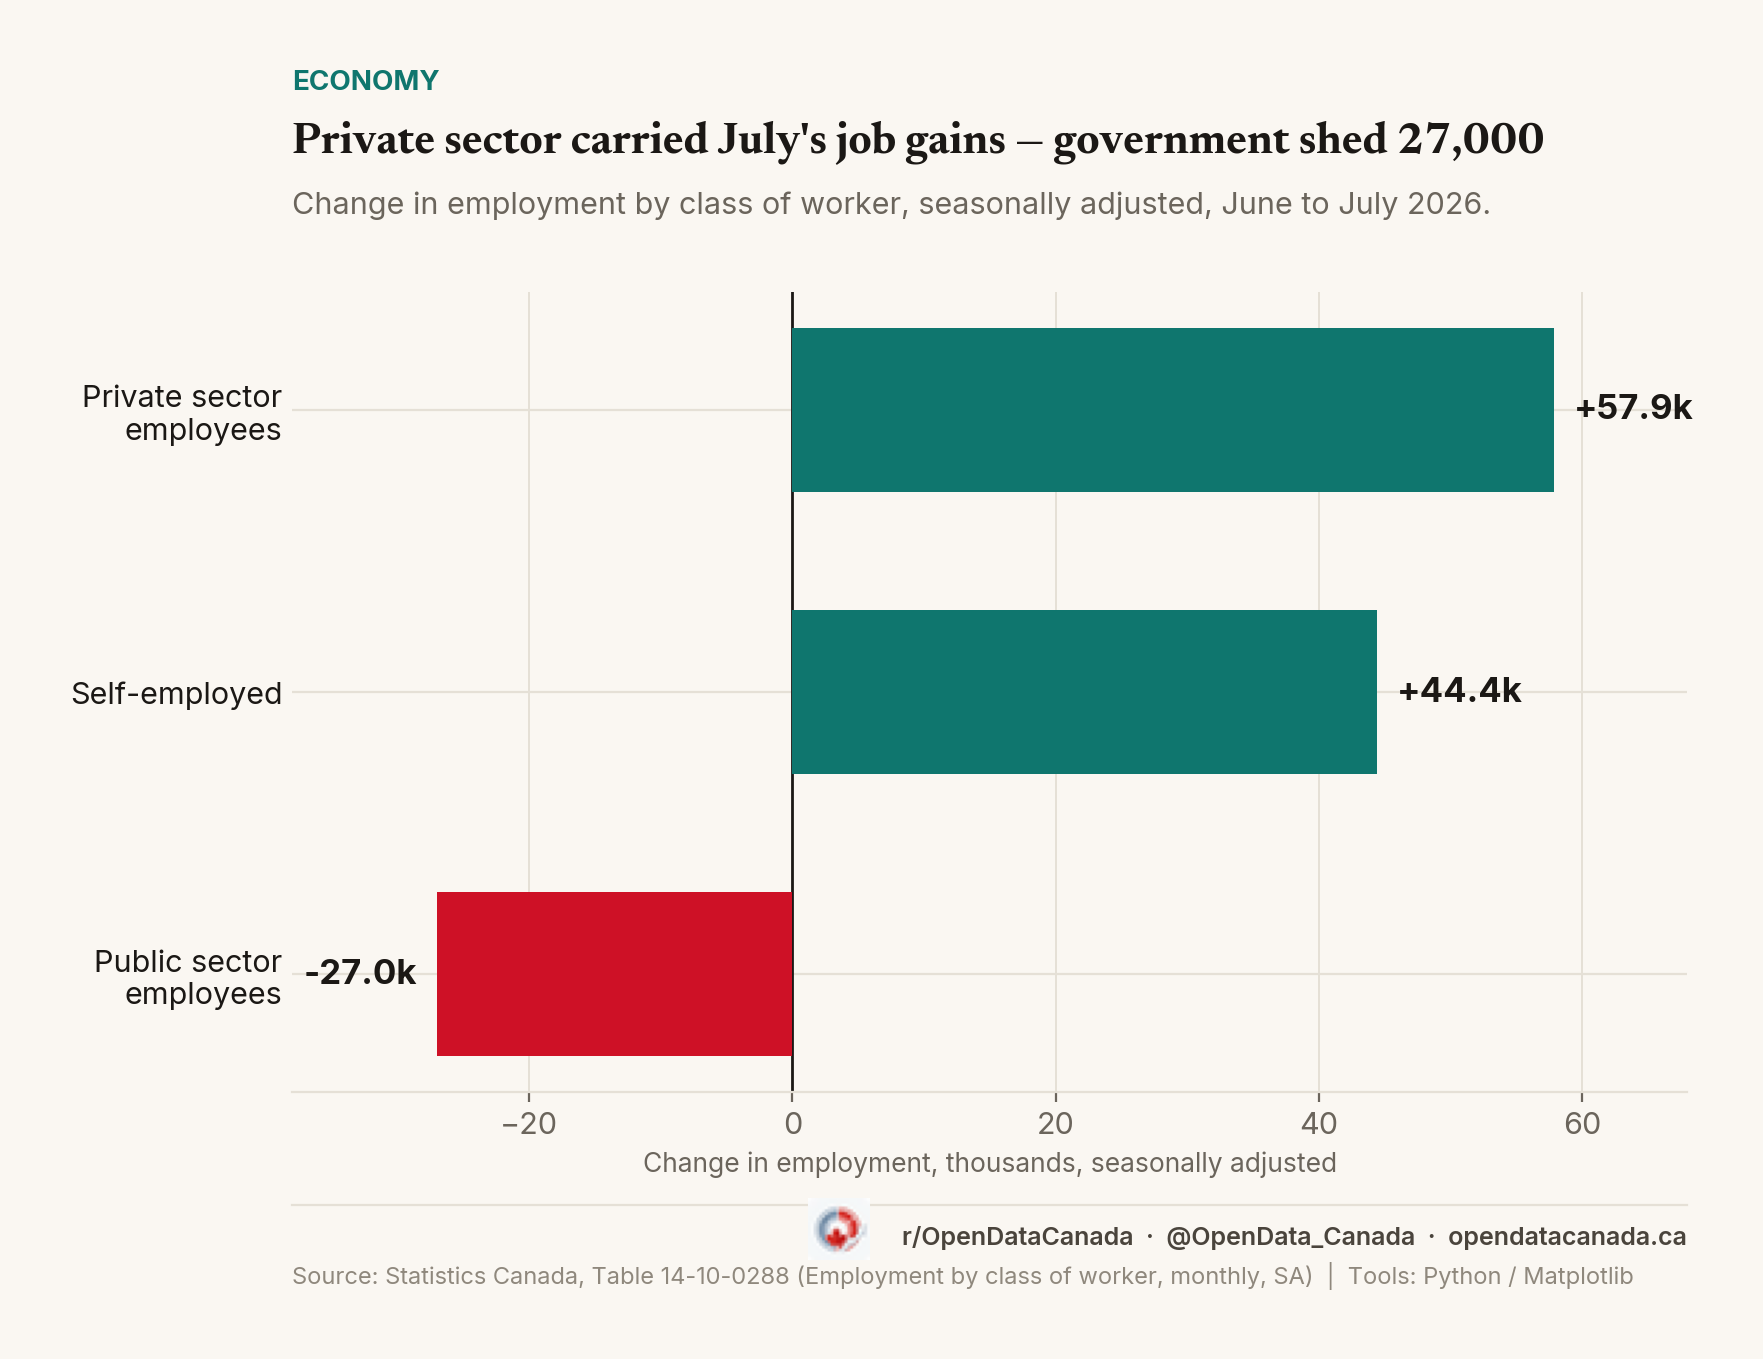
Canada added 75,000 jobs in July. Government cut 27,000 of its own.
The headline jobs number is genuinely good: full-time and part-time gains were balanced, and unemployment matched a two-year low. But almost 60 percent of July's employment growth came from people going self-employed, private employers added 57,900 jobs, and the public sector cut 27,000 — the piece no outlet covering the release reported.
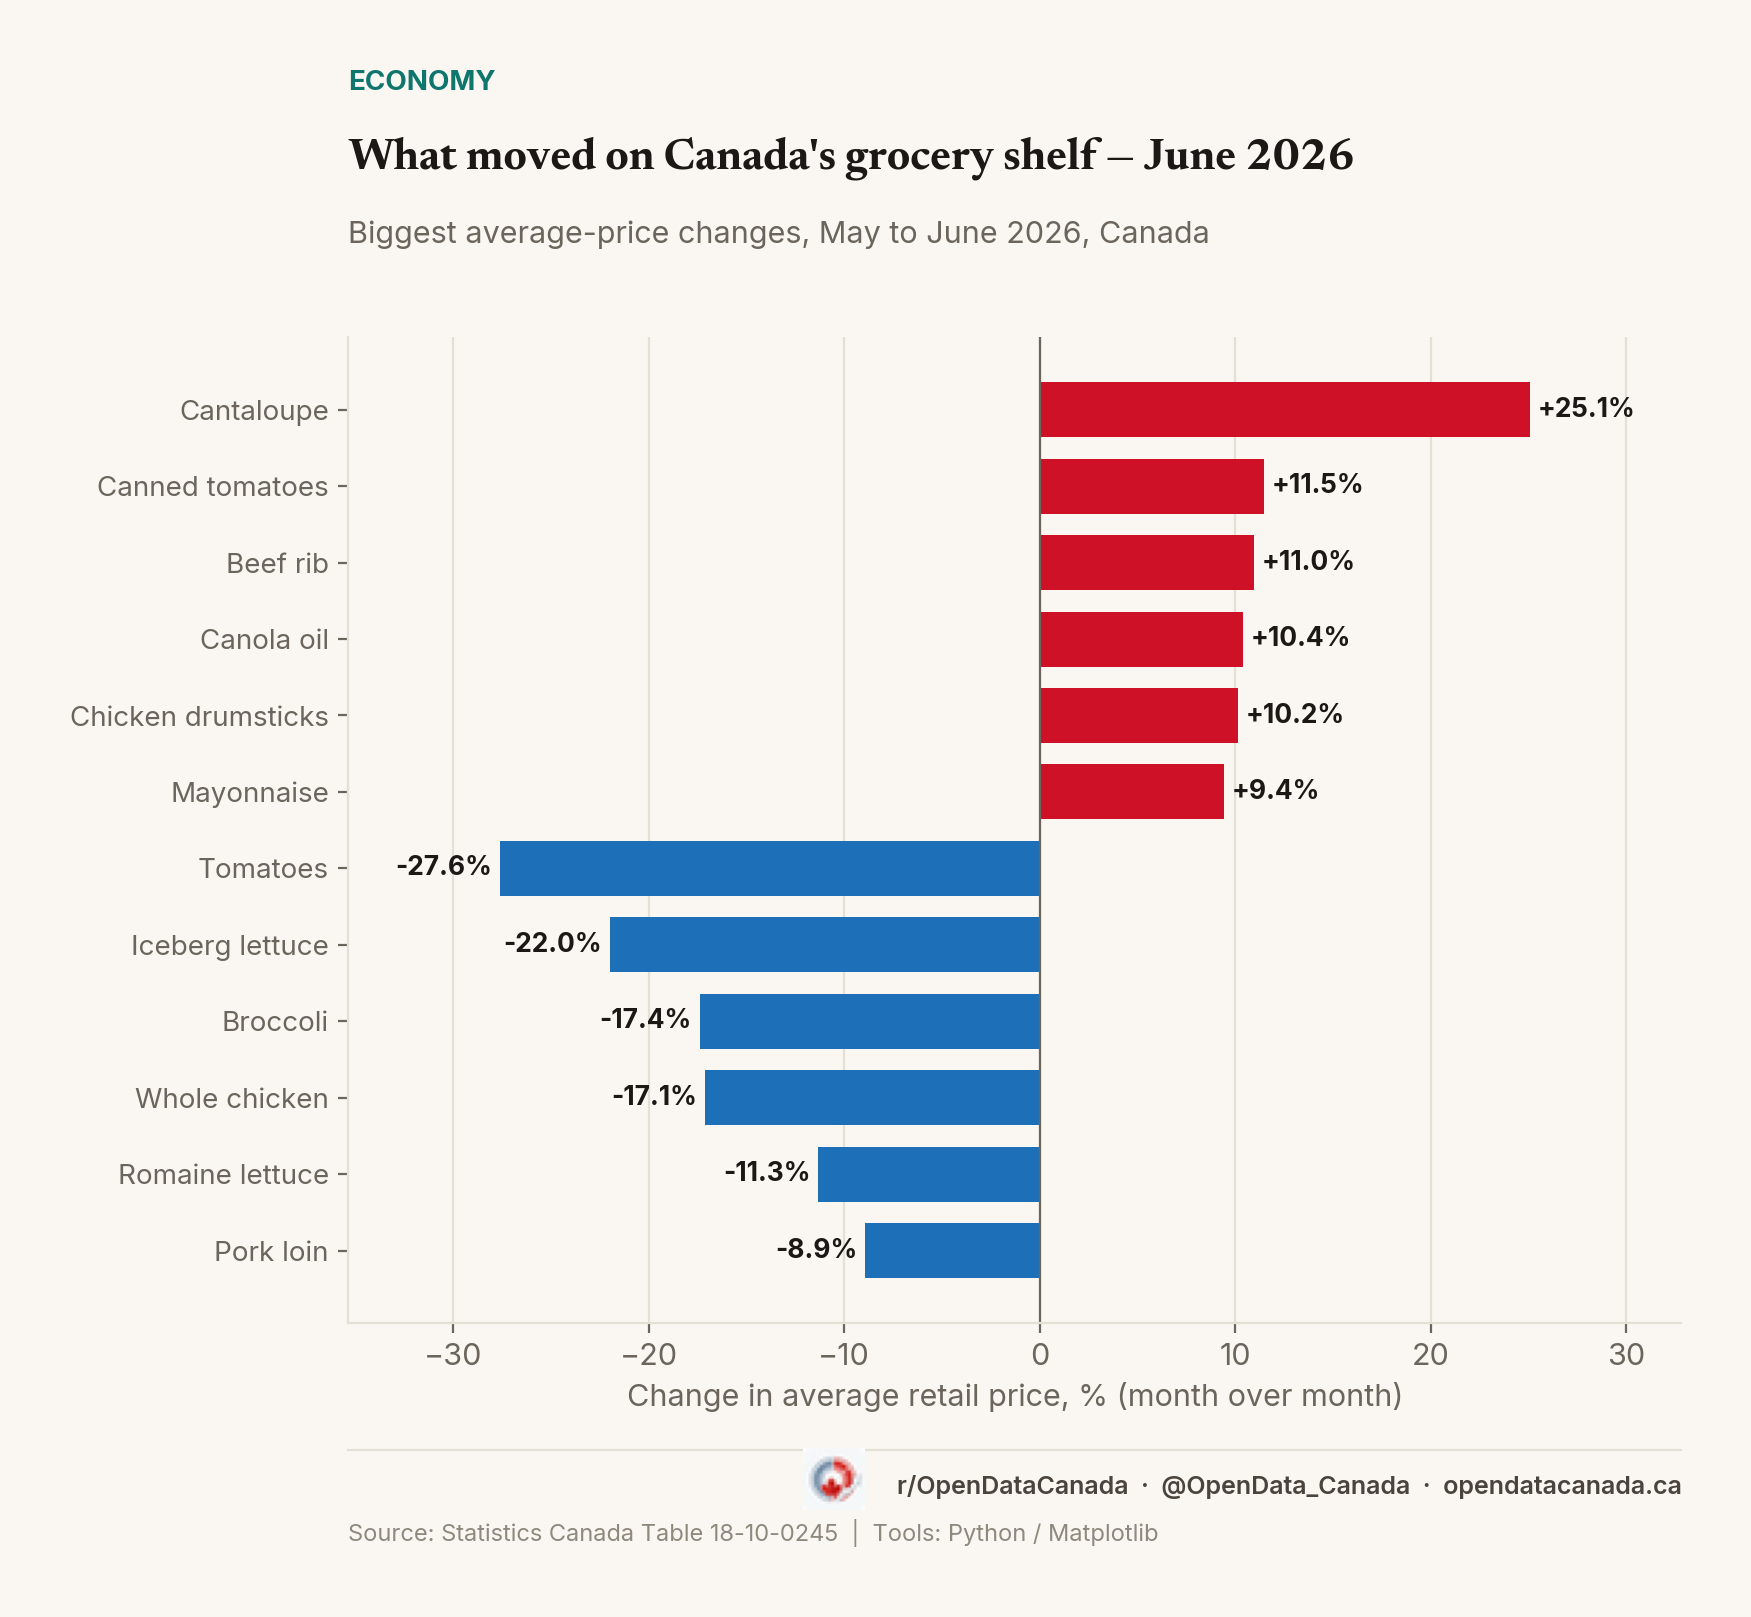
Vegetable oil is up 138% since 2020 — Canada grocery movers, June 2026
Vegetable oil has climbed 138% since January 2020, the steepest sustained increase among items StatCan tracks. Beef striploin is up 89.5% over that same stretch and 46% in the past year alone. Month to month, cantaloupe jumped 25.1% in June even as broccoli and tomatoes both got cheaper. The swings show how uneven grocery inflation remains from one item to the next.
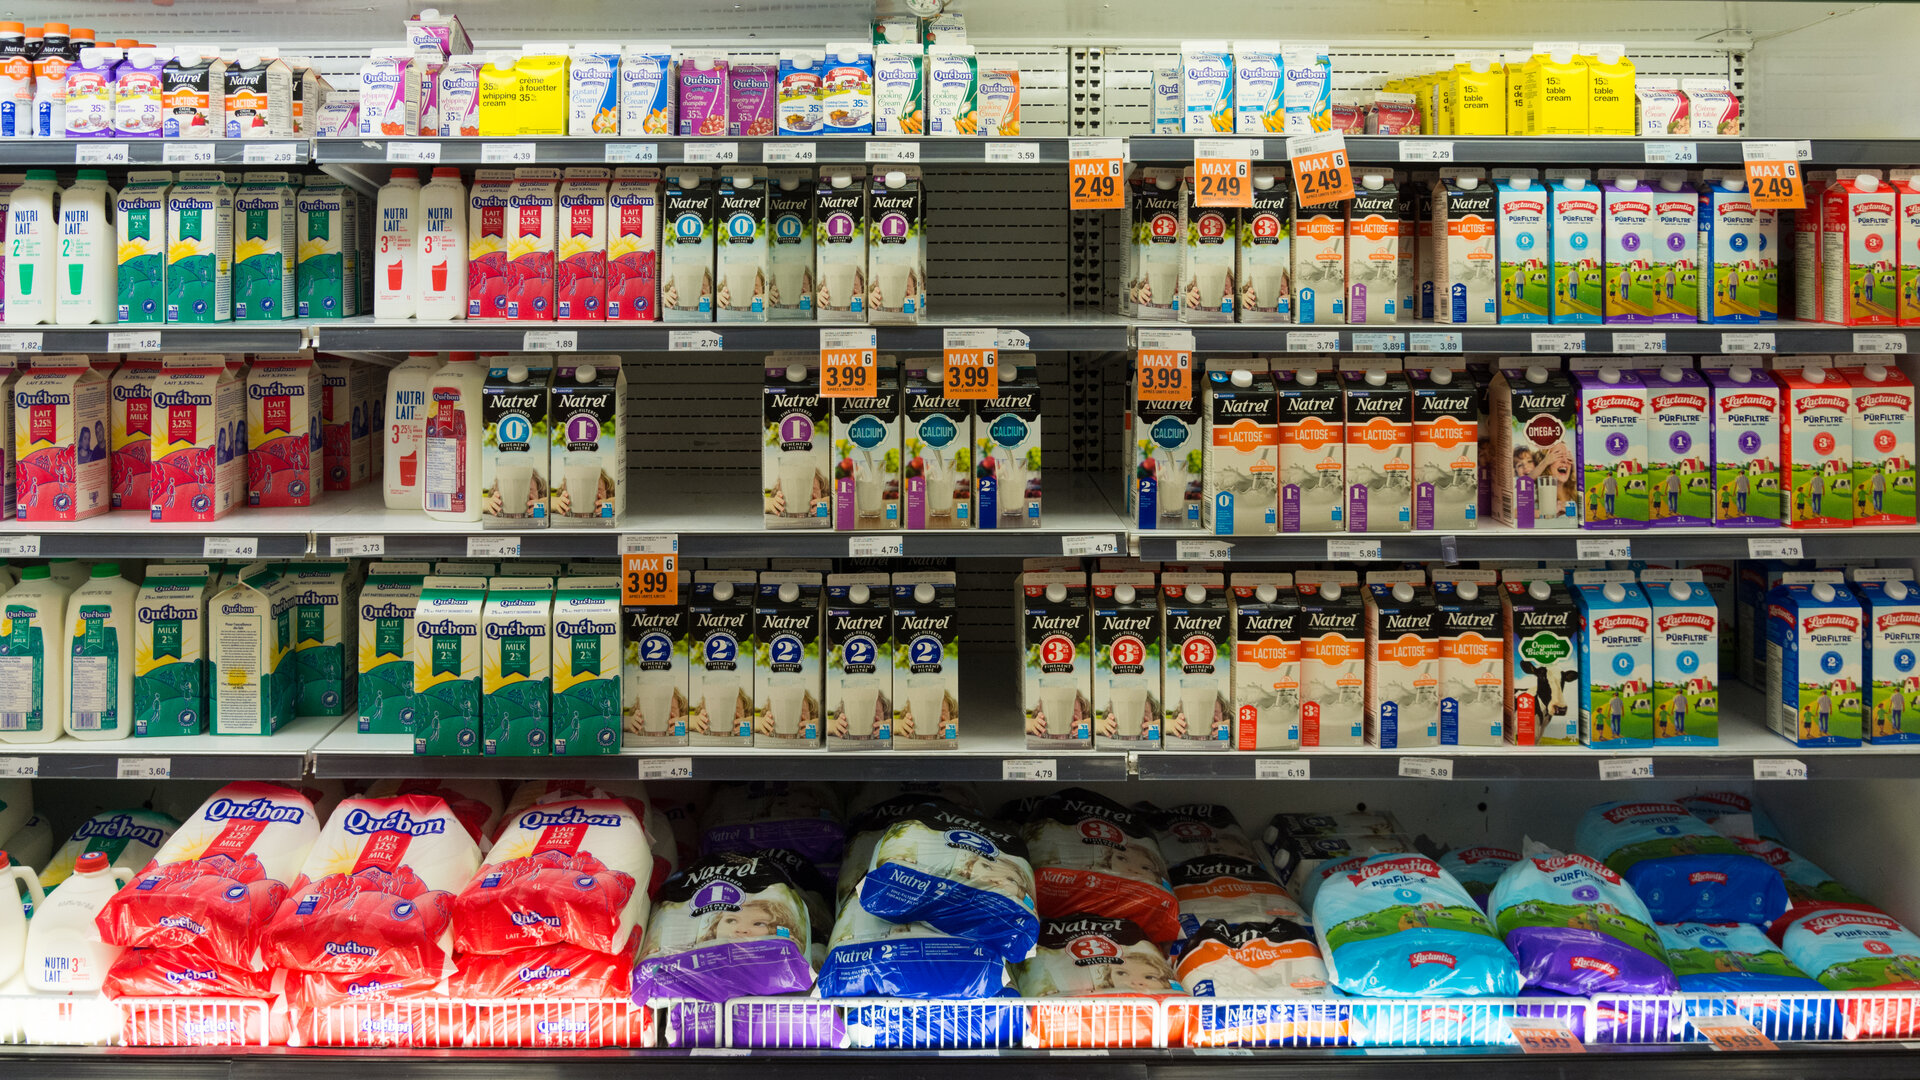
43 of 44 Canadian Social Assistance Scenarios Fell Below the Poverty Line in 2025
Across every province, Maytree modelled 44 household scenarios against Canada's official poverty line in 2025. Forty-three came in below what the basics cost. The one exception, in Quebec, reaches just 3 percent of the province's social assistance caseload.
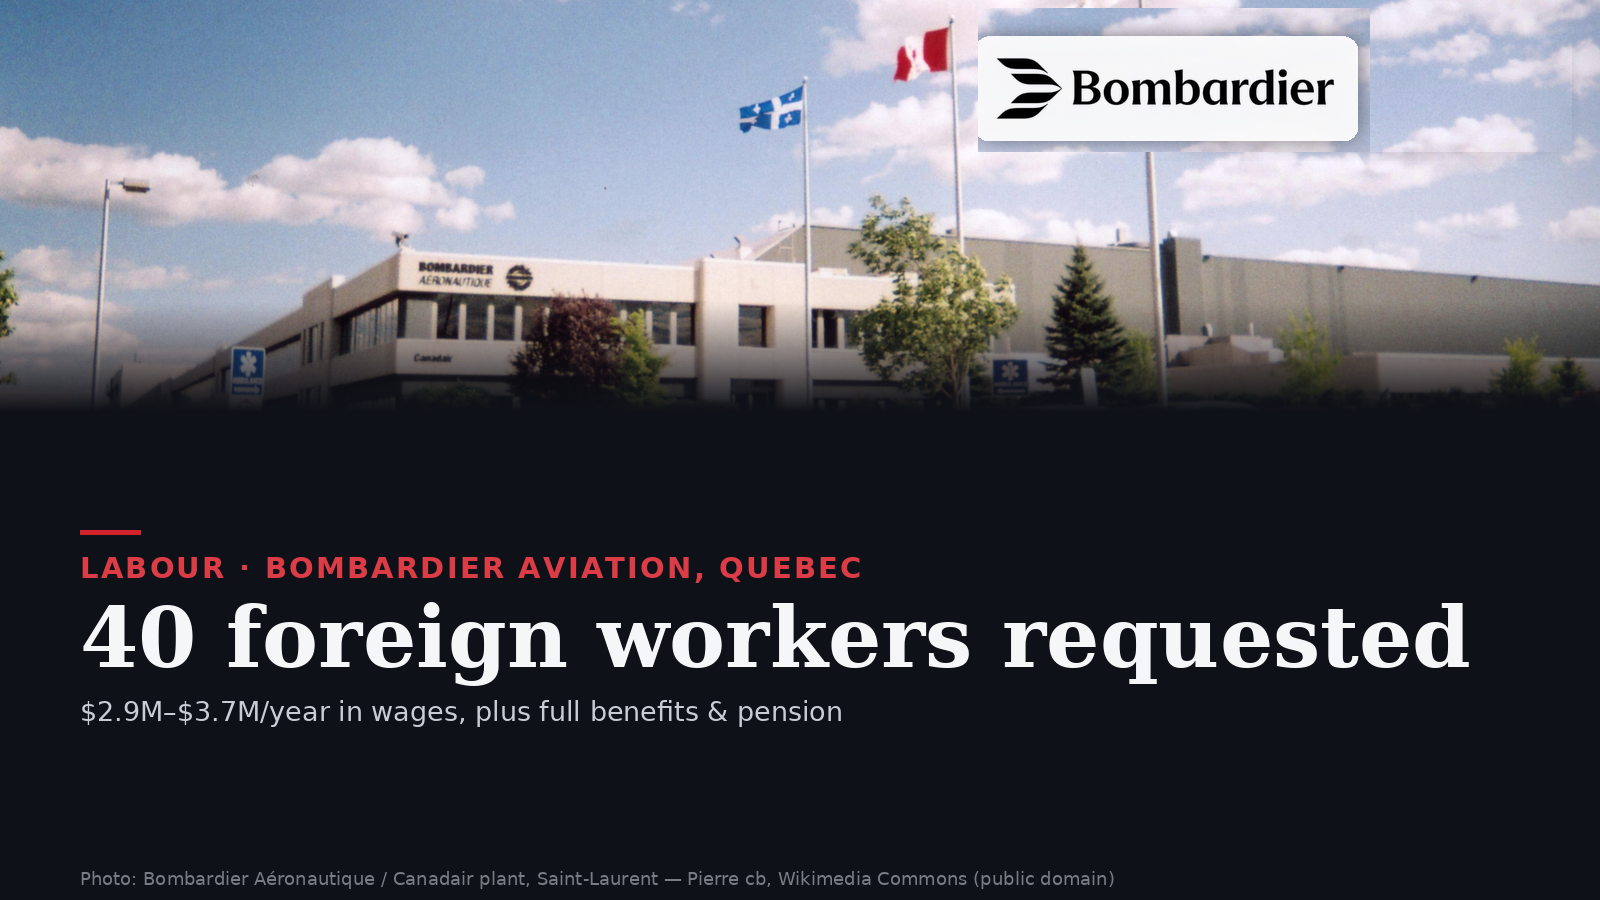
After 306 Million Dollars in Federal Funding, Bombardier Asks to Hire Record 40 Foreign Workers
The request coincides with 306.5 million dollars in federal funding for Bombardier's aerospace business, and lands during a technical recession, with manufacturing unemployment rising.
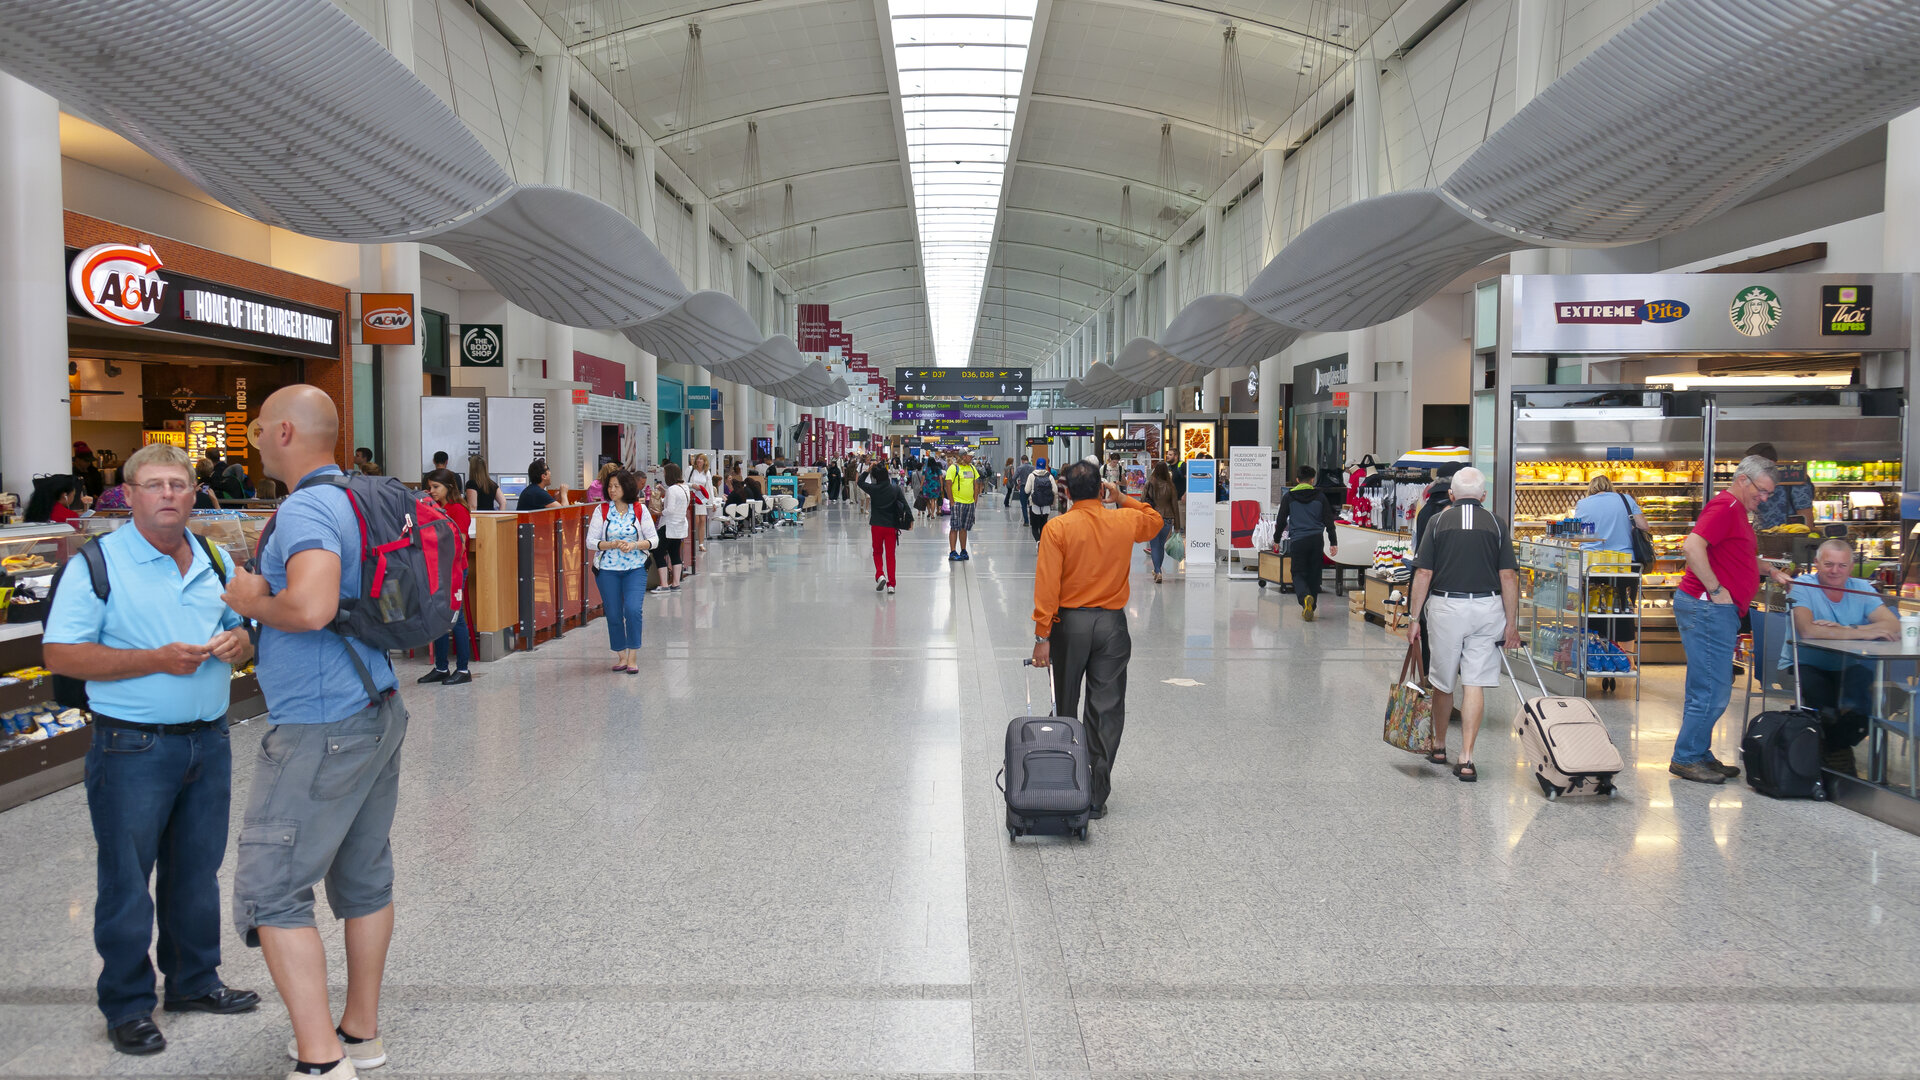
Every major Canadian airport lost US flights in 2026
The 52.8 percent cross-border collapse was mostly car trips. In the air the US pullback is milder, about 10 percent nationally, but it lands unevenly. Toronto and Vancouver carry the most US exposure. Edmonton and Winnipeg fell the hardest.

Ontario EI rolls surged 24 percent since 2024 — factories are not the reason
In the two years since January 2024, Employment Insurance beneficiaries in Ontario grew by nearly 36,000 to 185,010 — a 24 percent jump at nearly double the national rate. Manufacturing and utilities occupations, the ones cited most in tariff coverage, account for none of it.
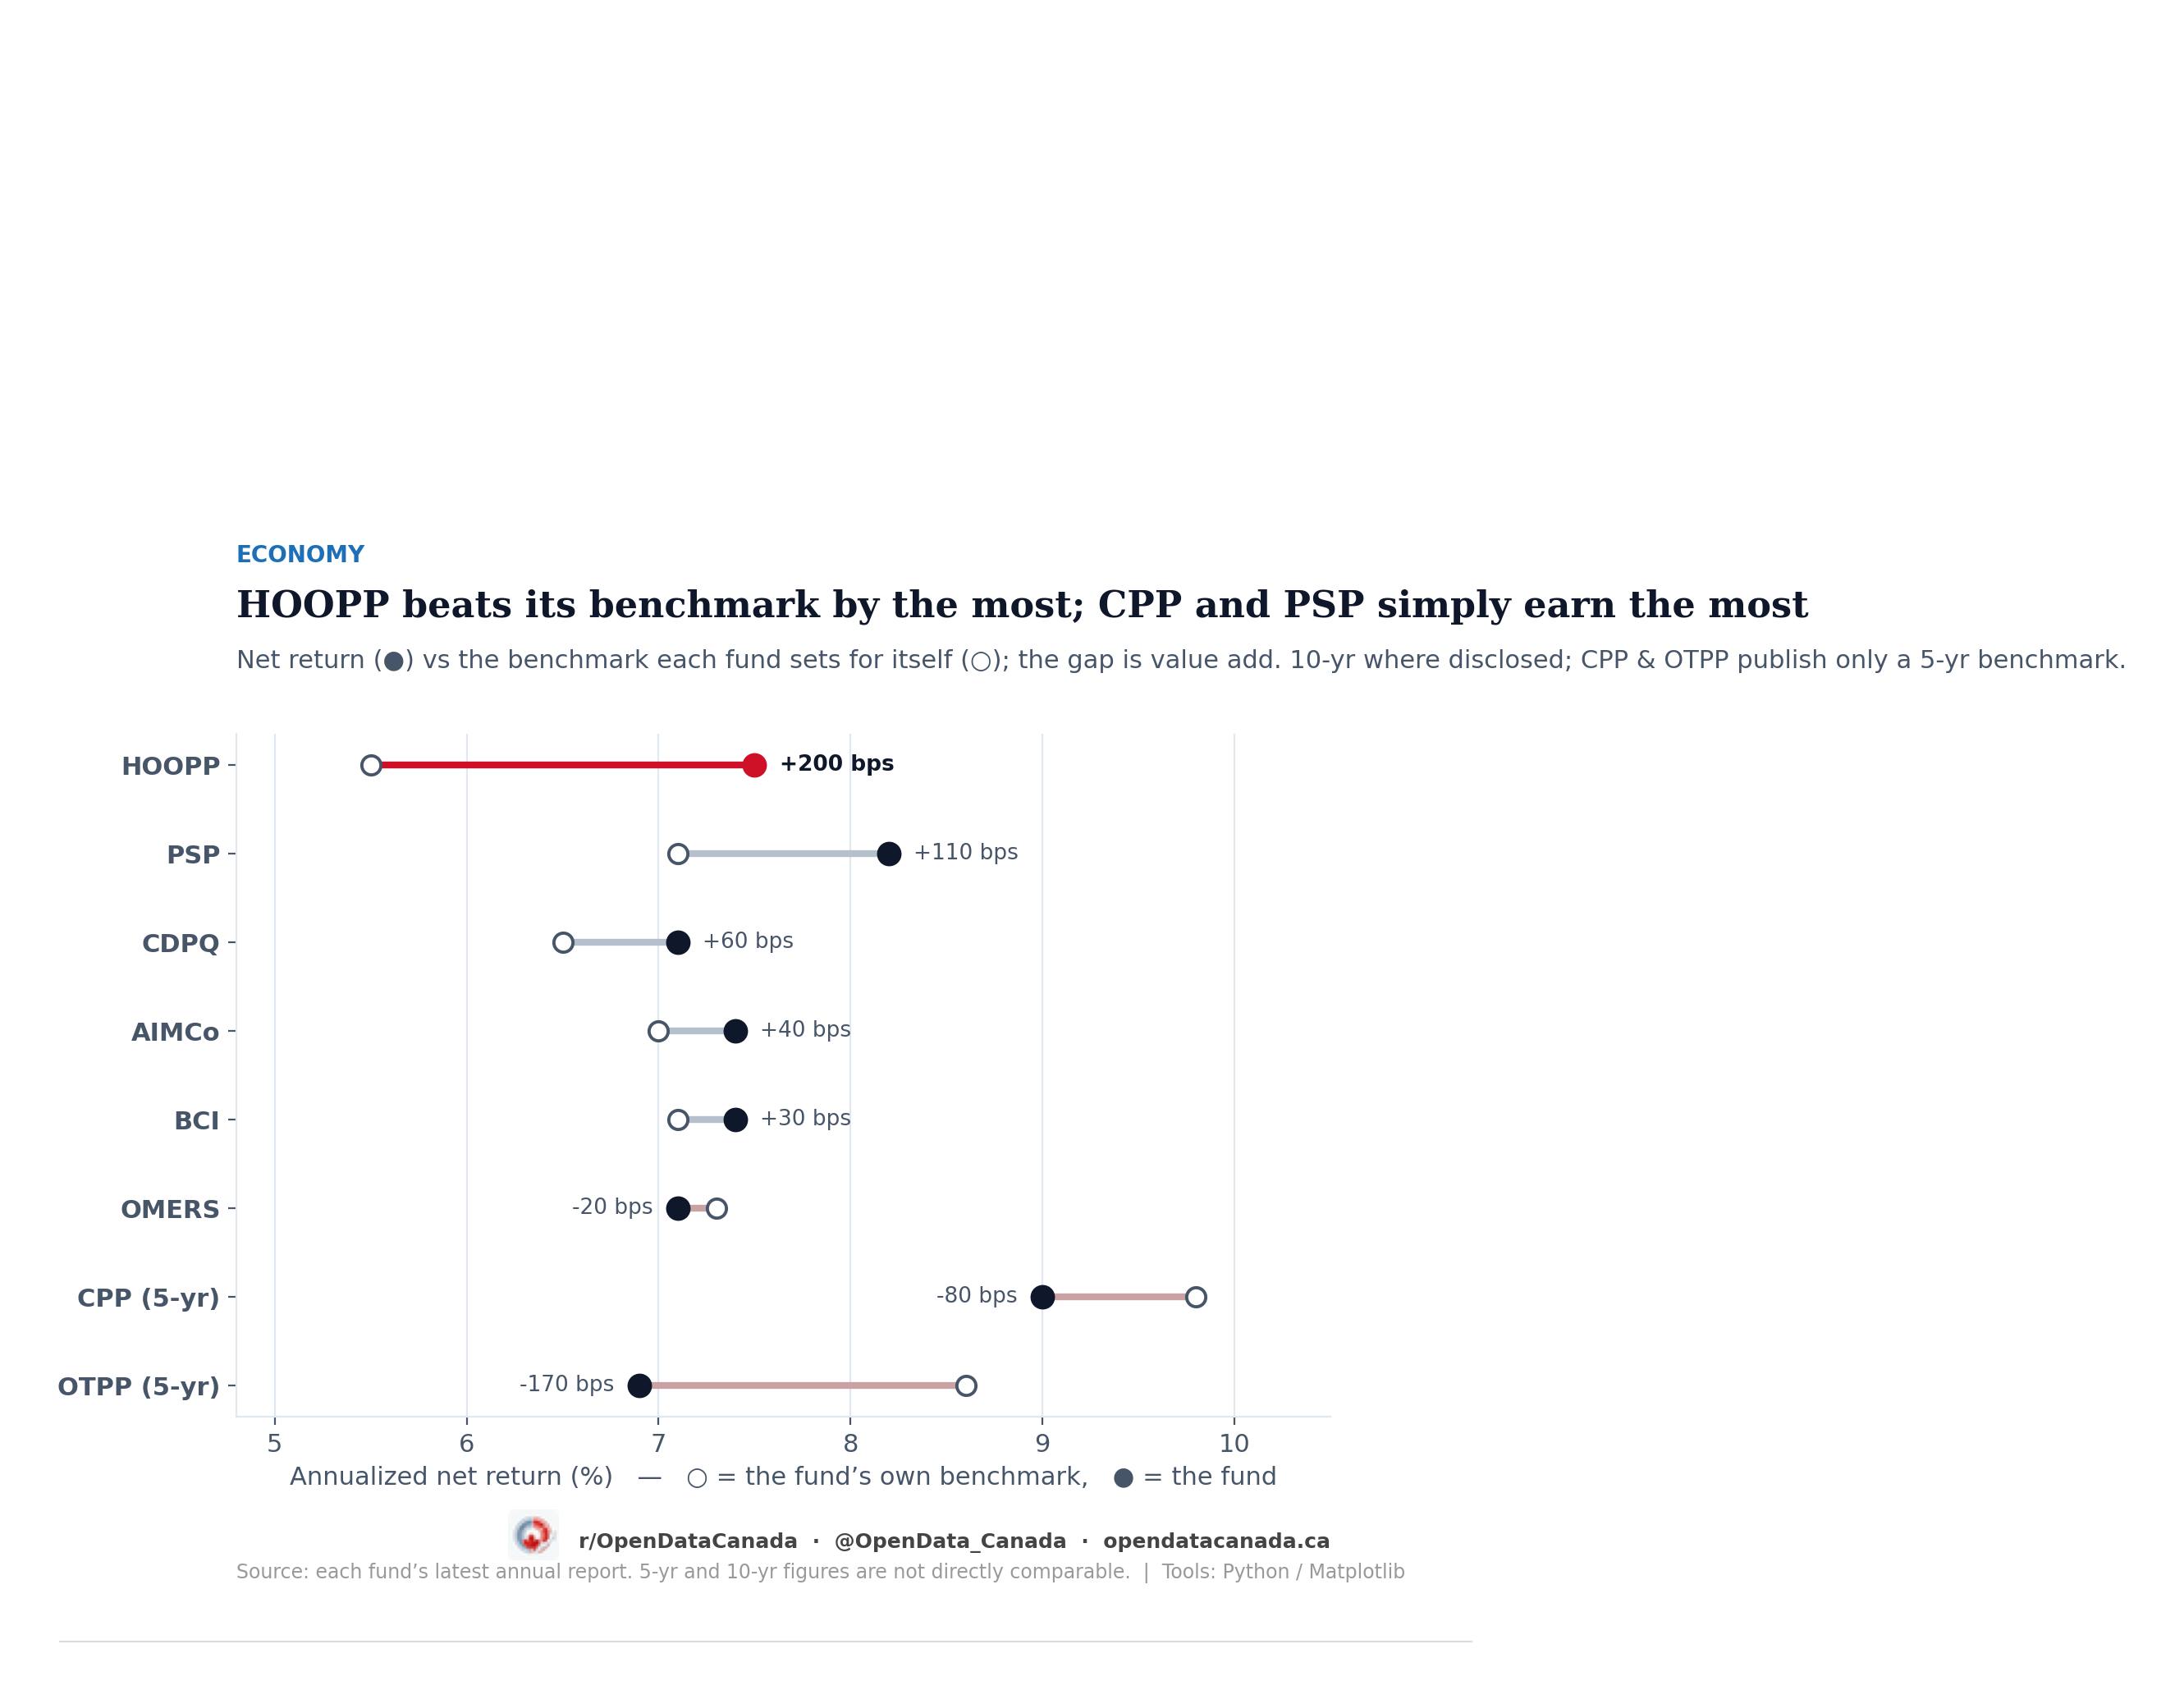
Canada's best pension fund? We ranked all 8 — the benchmark winner isn't the famous one
After Ontario Teachers trailed its benchmark, we pulled the latest annual report of all eight of Canada's pension giants and built one standardized scorecard. Over a decade, only HOOPP clearly beats the benchmark it sets for itself — by 2 full percentage points a year. CPP and PSP earn the highest raw returns. And on the question that started this — private companies — almost no fund reliably beats its own private-equity benchmark once you stop looking at a single year.
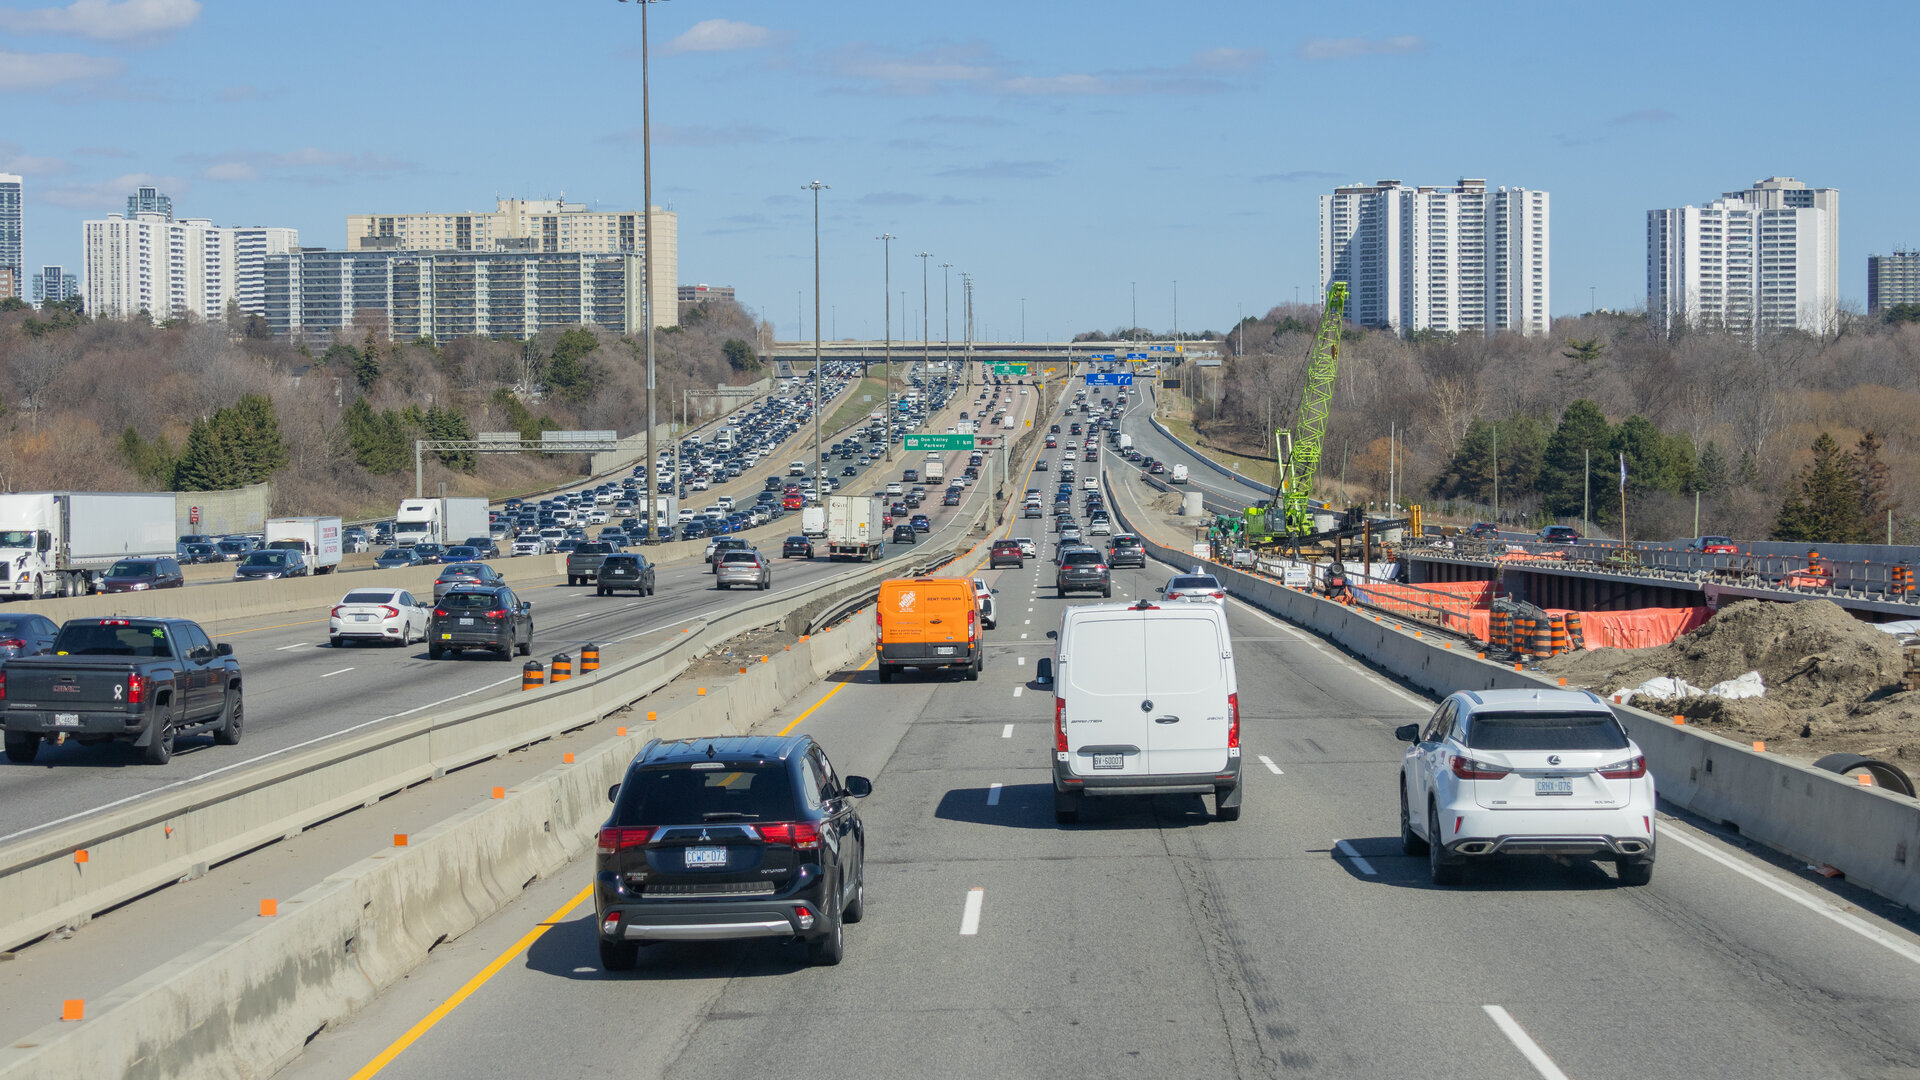
Canada's road and water networks are aging back to 2005 levels
Canada's headline measure of infrastructure health has climbed for two decades. The data underneath tells a different story: the country's roads are back where they stood in 2005, and waterworks have fallen every year since 2014. The national average hides the decline of two networks people use daily.

Canadians are scared of AI. Their employers keep using more of it.
Two-thirds of Canadians want Ottawa to rein in artificial intelligence, even if it slows the technology down. Over the same stretch the share of businesses actually using AI has tripled, to about one in five. The fear and the reality have drifted apart, and the StatCan numbers on who is adopting, and why everyone else is not, tell a stranger story than the panic does.

CPP sold Nvidia all the way up — and it became its biggest stock anyway
Before the AI boom, the Canada Pension Plan held 120 million Nvidia shares. It spent five years selling three-quarters of them — through the launch of ChatGPT, through the greatest stock run of the decade — then bought back in near the top. The shares it sold would be worth more than fifteen billion dollars today.
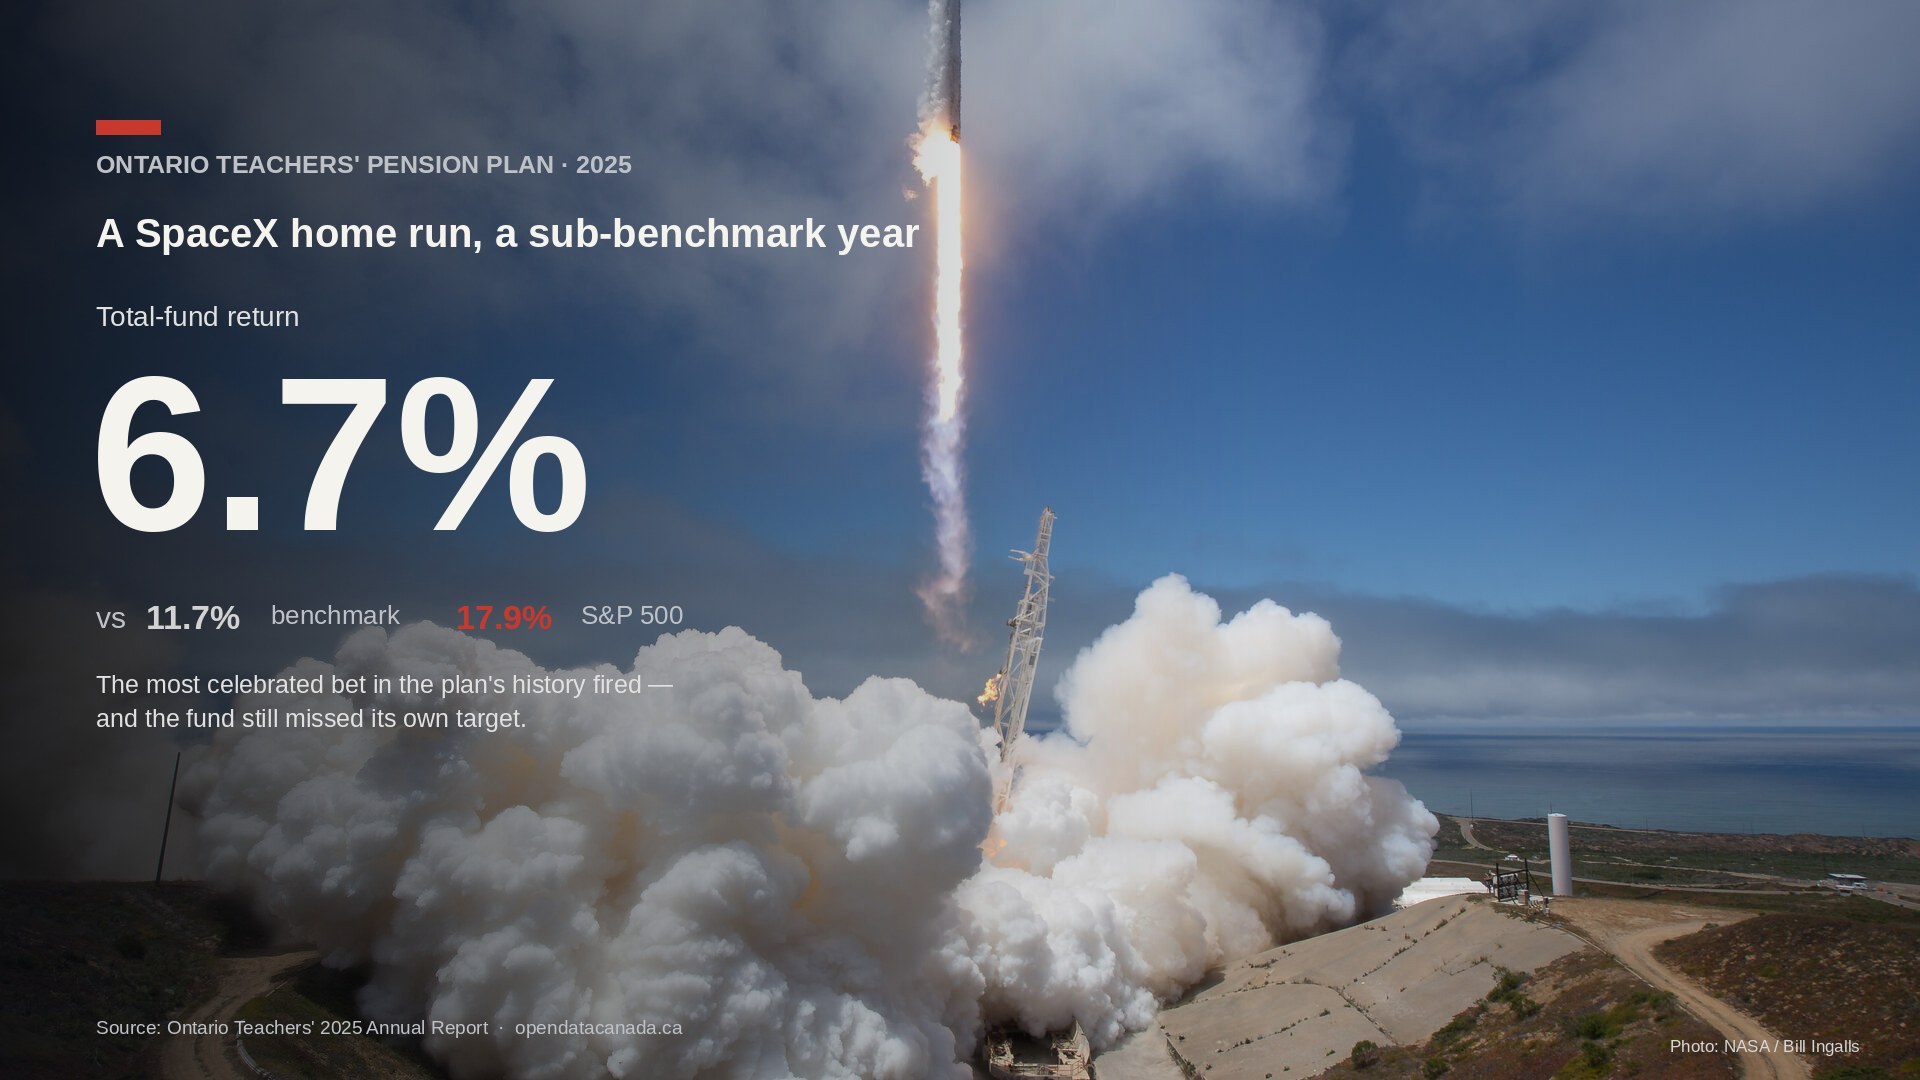
Ontario Teachers got into SpaceX early. A plain index fund still beat them in 2025.
Ontario Teachers' Pension Plan bought into SpaceX in 2019, and the stake could be worth as much as 11.6 billion U.S. dollars if the company lists at its targeted valuation. Yet in 2025 the fund returned 6.7 percent — below its own 11.7 percent benchmark and less than half the S&P 500's 17.9 percent. Its private equity lost money for the first time in 16 years. A look at what the windfall hides, and how Canada's pension giants are quietly changing what they invest in.

Canada has an "entrepreneurial drought," small-business group tells MPs
Appearing before the House Finance Committee on the spring economic update, the Canadian Federation of Independent Business said more businesses are closing than opening across several sectors, for as long as 12 straight quarters. It warned that 55 percent of current owners would not recommend starting a business today, and pressed for a lower tax rate and a deduction threshold that has not moved since 2009.

As Dunkin' prepares for its Canadian relaunch via Foodtastic, public LMIA data shows the master franchisee hires foreign workers at nearly the same rate as Tim Hortons
Foodtastic, the Montreal company that just signed an exclusive deal to bring Dunkin' back to Canada with "hundreds of locations," has approved 109 Temporary Foreign Worker positions across its existing portfolio over the past two years. Normalized by workforce, that works out to roughly 5.7 per 1,000 employees — about 85 per cent of Tim Hortons' rate. Tim Hortons got every front page for promising to cut its TFW use. Foodtastic, with a similar per-worker rate, is opening hundreds of new stores under a "Dunkin' is back" headline.
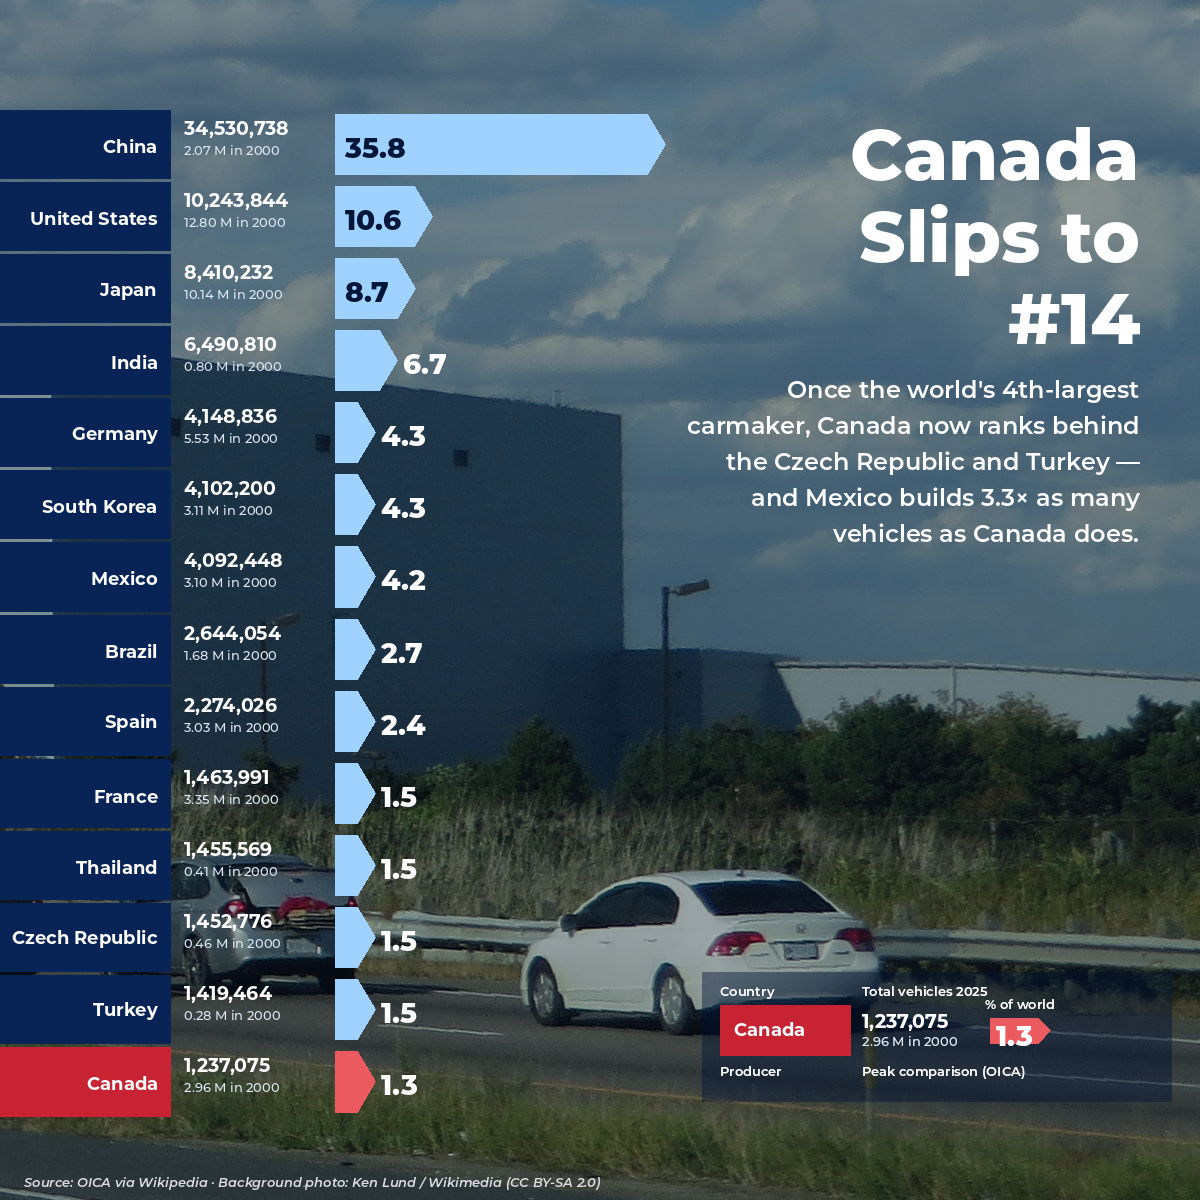
Canada was the world's 4th-largest carmaker in 2000. It now ranks 14th.
In 2000 Canada built 2.96 million vehicles and sat fourth in the world. In 2025 it built 1.24 million and slipped to 14th, behind the Czech Republic and Turkey. Mexico now builds 3.3 times as many vehicles as Canada does.
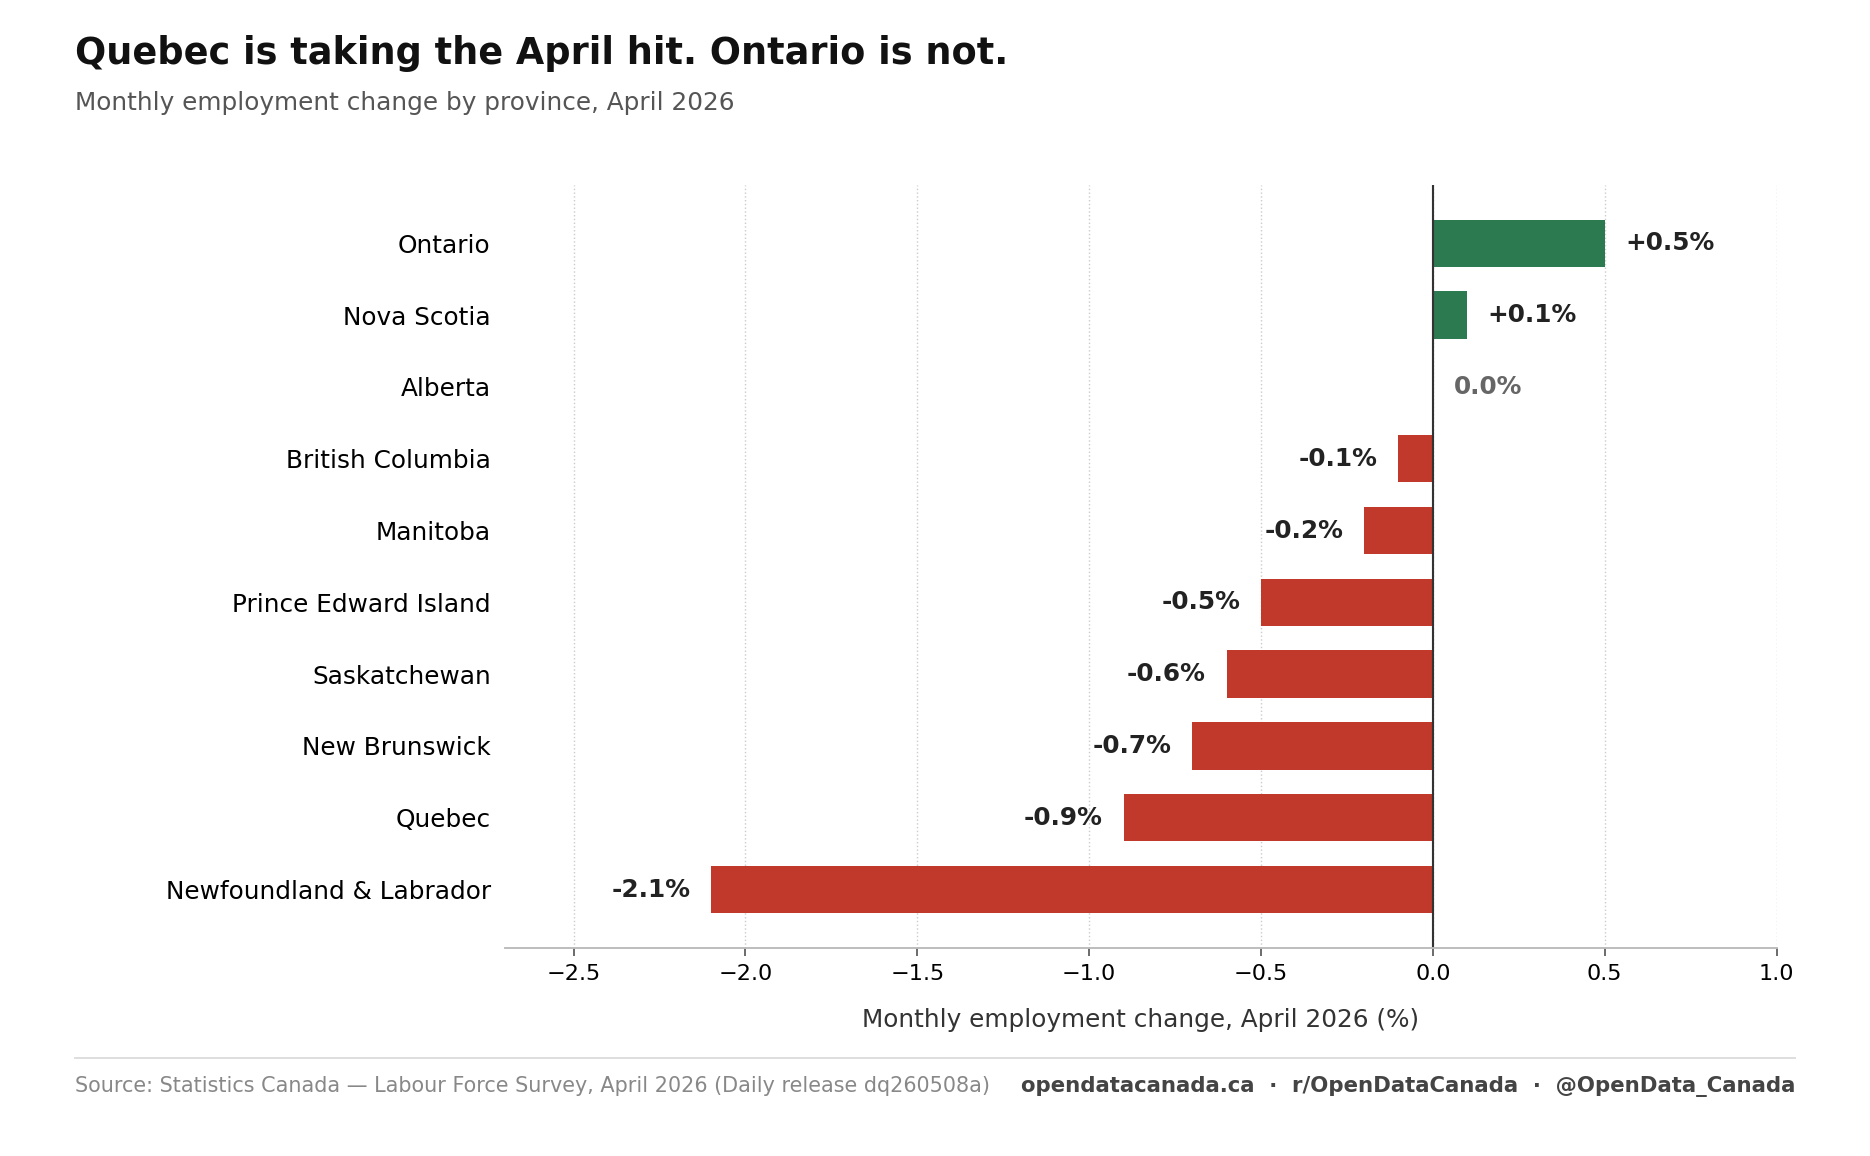
Canada has lost 111,000 full-time jobs since January. Quebec is taking the worst of it.
April was the fourth straight monthly decline in full-time employment. Unemployment hit a six-month high. Wages still grew 4.5 percent year-over-year. The headline number of minus 18,000 hides what is happening underneath it.
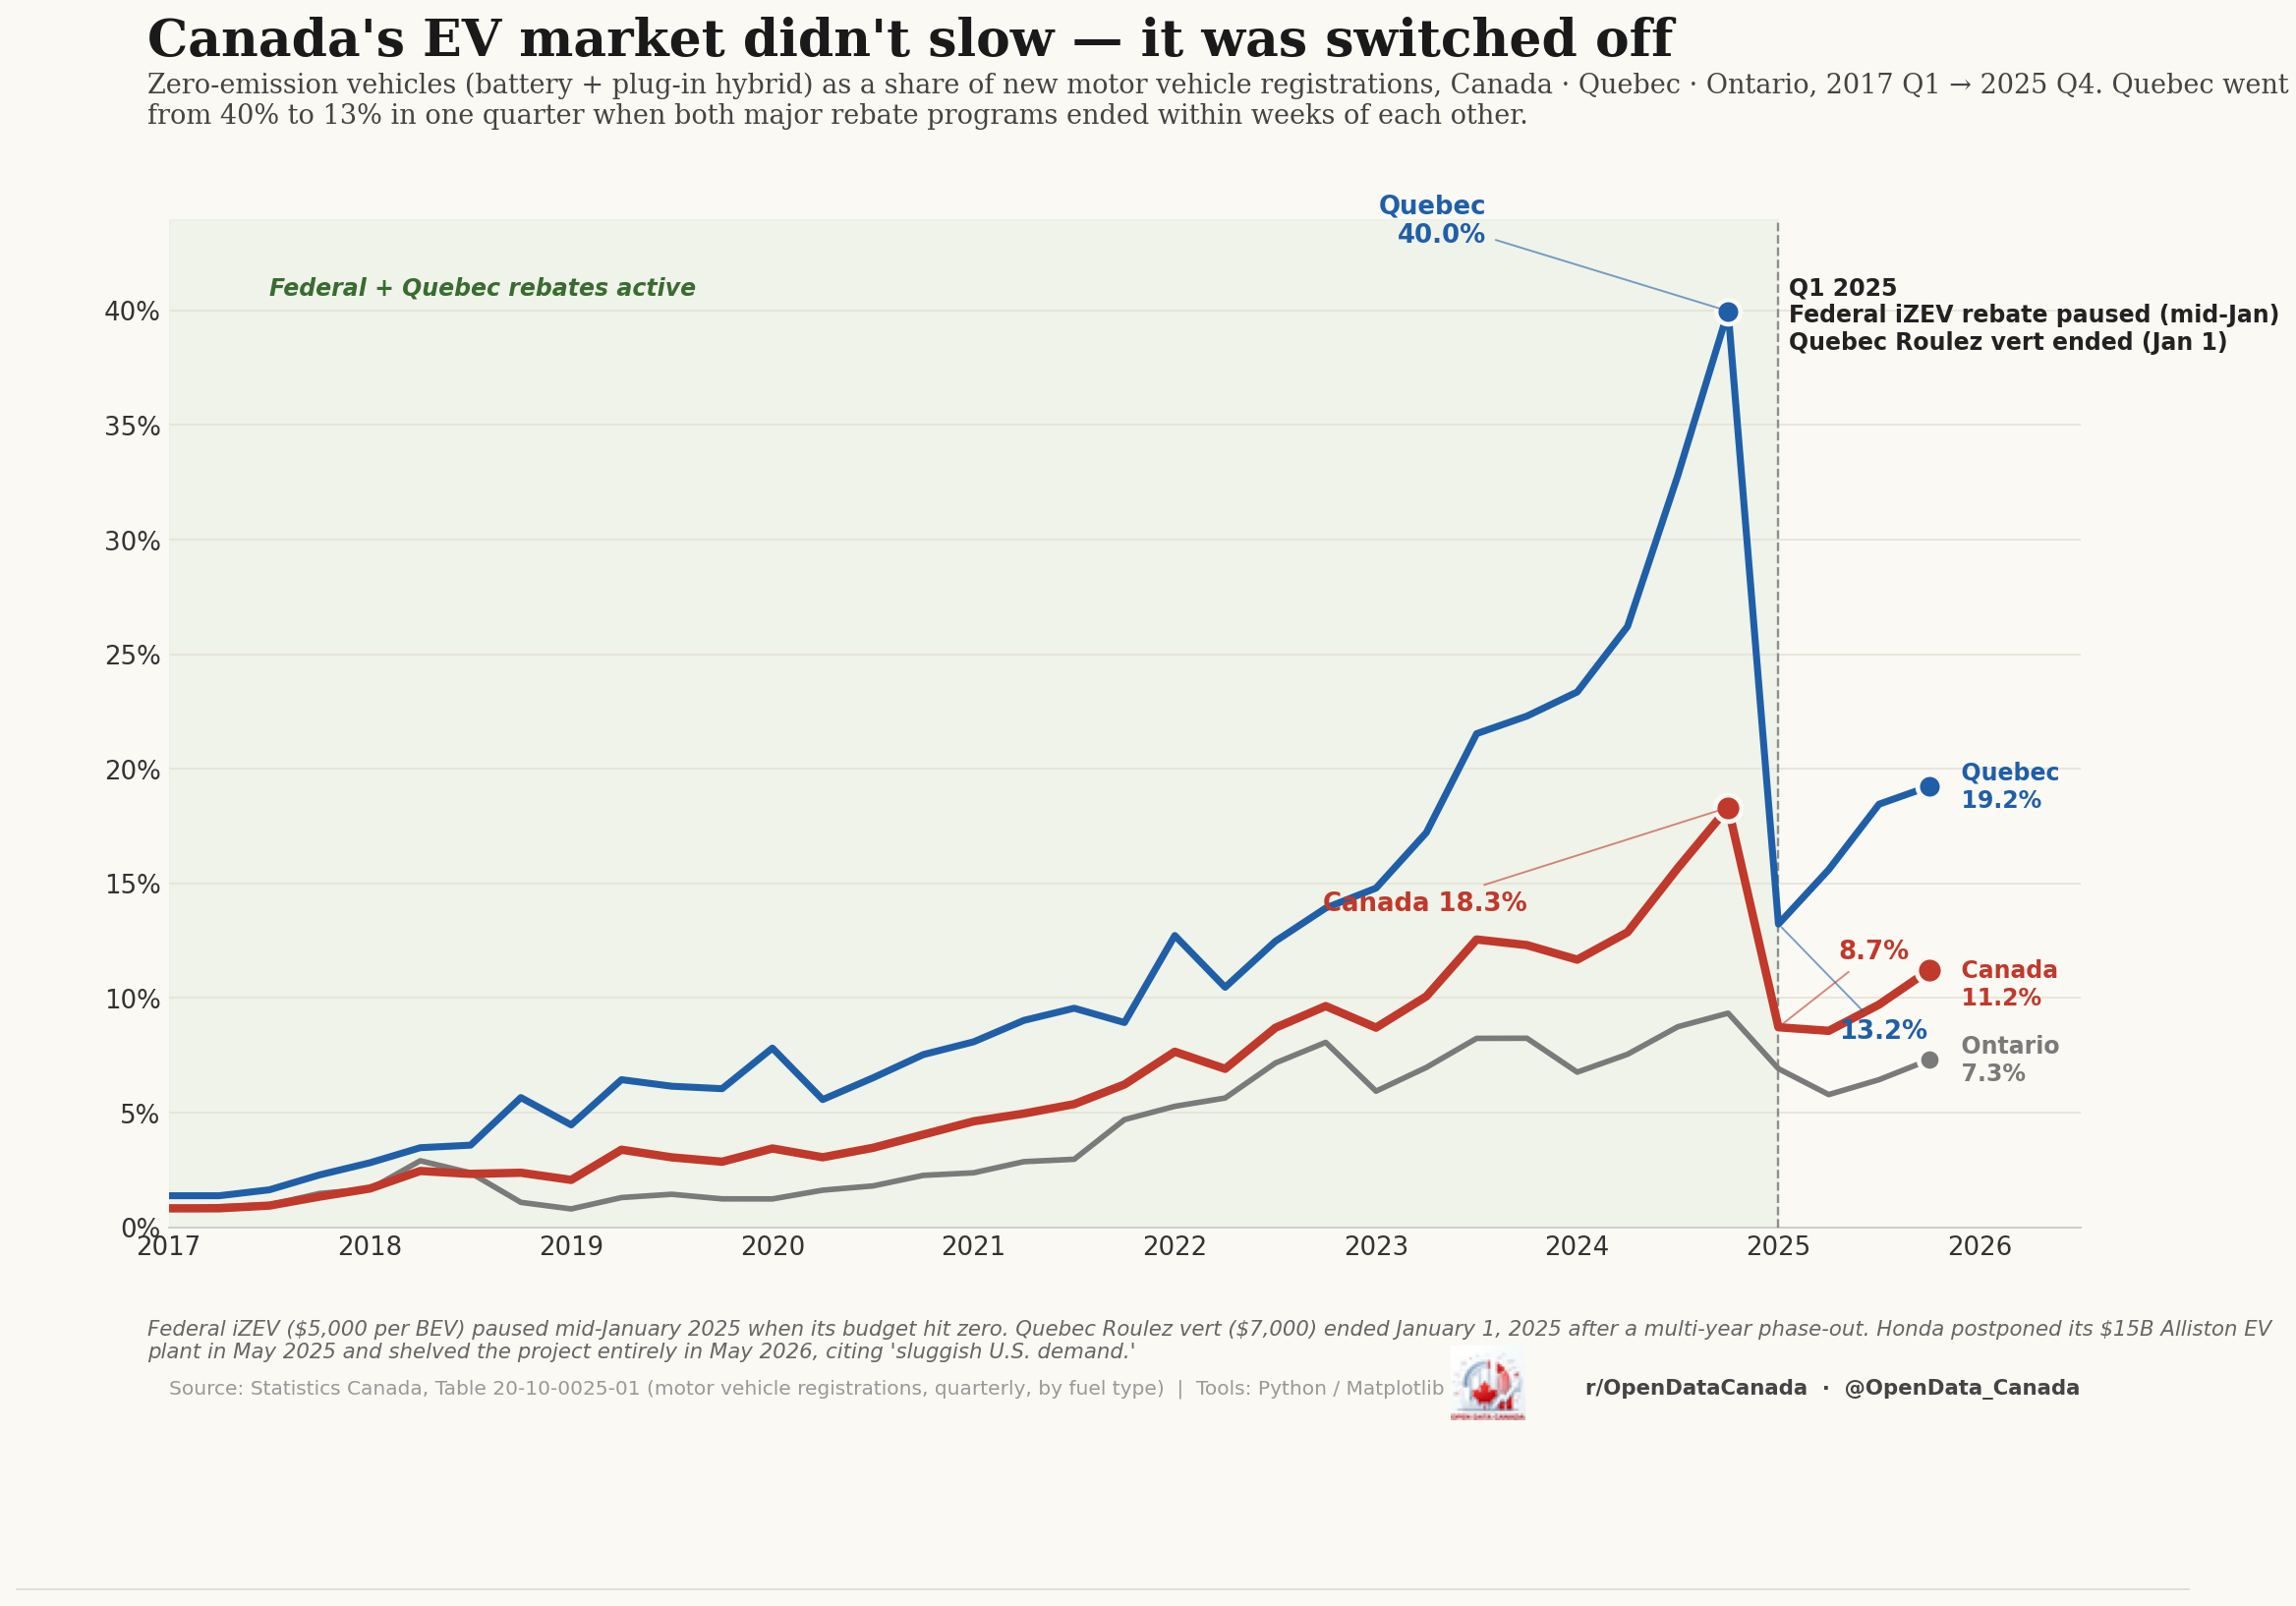
Canada's EV market didn't slow — it was switched off
Honda is shelving its largest-ever North American EV investment, citing 'sluggish U.S. demand.' The Canadian story is sharper — ZEV market share fell from 18% to 9% in one quarter when both major rebates ended within weeks of each other.
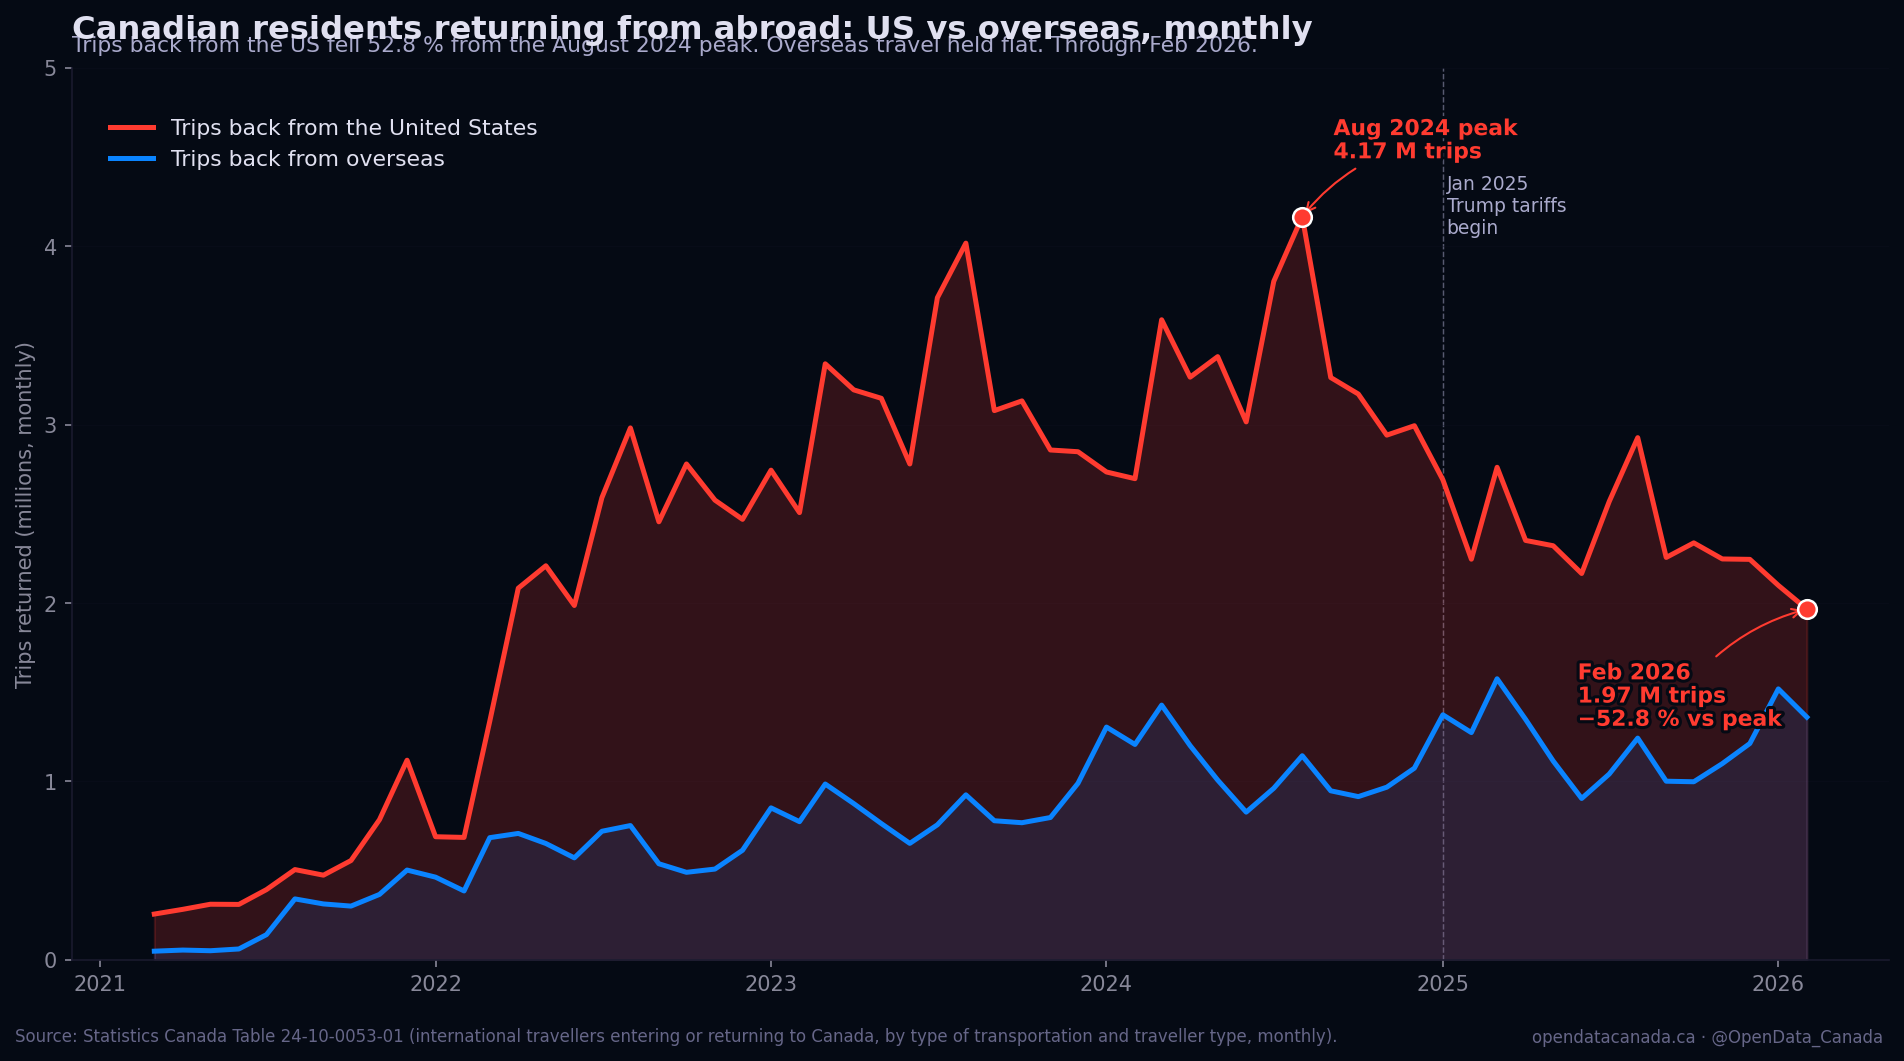
52.8 % — Canadian trips to the US have collapsed since August 2024
4.17 M monthly trips at the peak → 1.97 M by Feb 2026. Fourteenth consecutive month of YoY decline. Overseas travel didn't move. The mechanism: January 2025 tariffs.