Article · Trade · 9 min read
52.8 % — Canadian return trips from the US have collapsed since the August 2024 peak
Overseas travel didn't move. The drop is specific to the US, fourteen straight months of year-over-year decline, and tied to one calendar event.
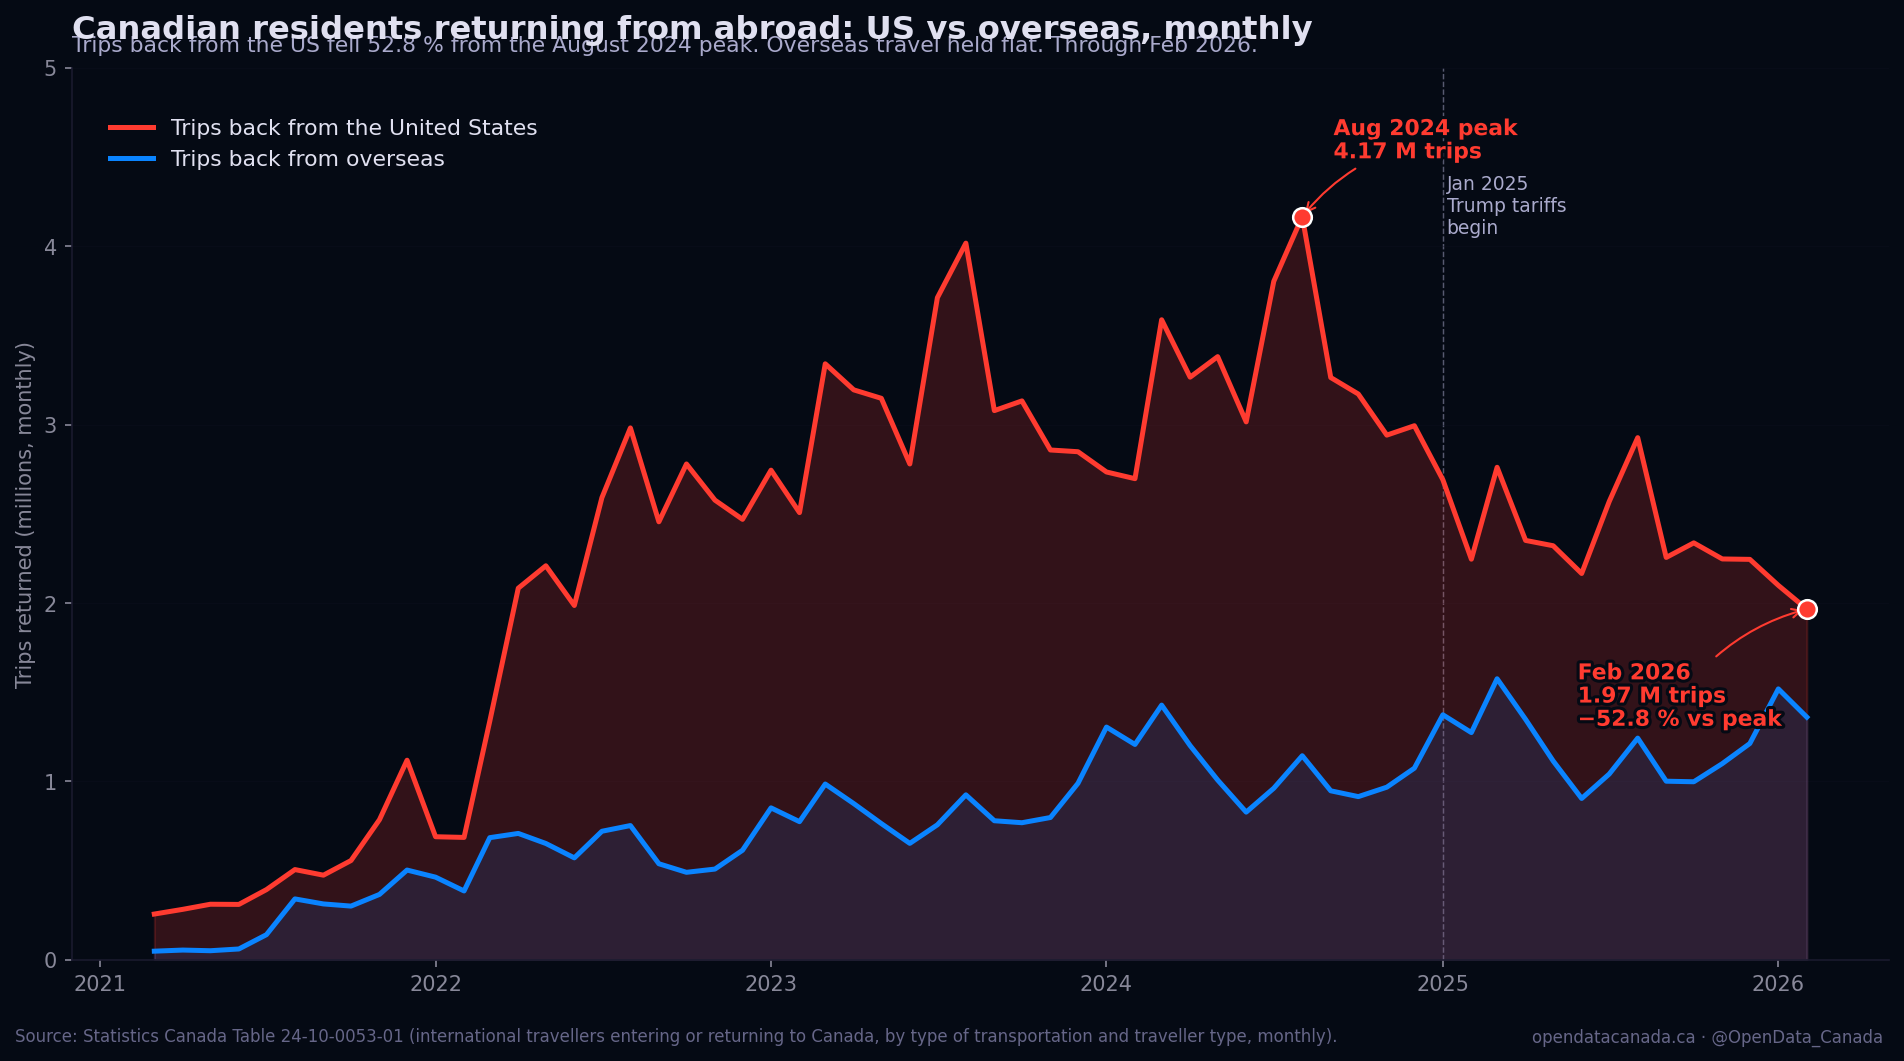
The chart above plots Statistics Canada Table 24-10-0053-01 — Canadian residents returning to Canada from abroad, broken into two lines: returning from the United States (red) and returning from countries other than the US (blue). The y-axis is millions of trips per month; the x-axis covers January 2021 through February 2026. The red line is the entire story.
What the data actually says
The verified series, pulled from StatCan's API on the day this article was written:
| Month | US returns (millions) | YoY change | Overseas returns (millions) |
|---|---|---|---|
| Aug 2024 | 4.17 | — | 1.43 |
| Nov 2024 | 2.94 | flat | 1.45 |
| Jan 2025 | 2.69 | first YoY drop | 1.41 |
| Feb 2025 | 2.25 | −16.7 % | 1.36 |
| May 2025 | 2.32 | −31.4 % | 1.40 |
| Aug 2025 | 2.93 | −29.7 % | 1.45 |
| Nov 2025 | 2.25 | −23.6 % | 1.42 |
| Feb 2026 | 1.97 | −12.5 % | 1.45 |
The May 2025 YoY drop of 31 % is the steepest in the series. The headline number — 52.8 % from the August 2024 peak — is the cumulative effect from peak to most-recent month. The most recent monthly YoY change (12.5 %, February 2026) is smaller, but it is the fourteenth consecutive month of year-over-year decline. There is no precedent in the StatCan series outside the COVID-19 pandemic period.
A few facts worth pulling out before the explanation:
- The drop is not a Canadian travel problem. The overseas line moved less than 5 % across the same window. If Canadians had simply stopped travelling, both lines would have fallen together. They didn't.
- The drop accelerates by mode. February 2026 air arrivals from the US were down 12.0 % year-over-year; automobile arrivals were down 12.3 %. Same-day automobile crossings (the kind of trip a Buffalo-bound resident might take to fill up at Costco or attend a sports game) account for 70.8 % of all auto crossings. They are falling at roughly the same rate as overnight stays, which suggests the change is across the full distribution of trip types.
- The directional flip is symmetric, but smaller, on the US side. US-resident arrivals to Canada were up 5.9 % year-over-year in February 2026 — the second consecutive monthly gain. Trips by automobile from US residents rose 6.8 %; trips by air rose 4.8 %. Canadians are travelling to the US much less; Americans are travelling to Canada slightly more.
What changed in January 2025
The chart's inflection is sharp and dated: Canadian return trips from the US dropped year-over-year in January 2025 for the first time since the COVID re-opening, and have dropped every month since. The single most important calendar event in that window is the introduction of US tariffs on Canadian goods.
The tariff timeline, briefly:
- 20 January 2025: Trump administration takes office. Initial tariff threats announced against Canada (25 % on most goods, 10 % on energy).
- 4 March 2025: Tariffs come into effect after a 30-day delay; Canada retaliates with C$ 30 billion in counter-tariffs.
- April–November 2025: Multiple rounds of tariff escalation, partial pauses, and bilateral negotiations. The "Buy Canadian" movement consolidates as an organised consumer response.
- January 2026: Tariffs partially relaxed under a renegotiated framework agreement; Canadian retaliatory tariffs partially lifted.
The chart's slope is consistent with all four phases. The early-2025 drop is steepest — that's the initial tariff shock. The drops moderate through late 2025 — that's the period when Canadians had absorbed the shock and were holding their reduced level of US travel. The February 2026 reading still shows a 12.5 % YoY drop, but that's against a January-2025 base that was already low; the YoY math will reset in March 2026.
The "Buy Canadian" framing matters here because it is what makes the response behavioural rather than economic. Canadians have not stopped going to the US because flying or driving has become more expensive — those costs barely changed. They have stopped going because going to the US has become a political signal. That is a different mechanism than a price-elasticity response, and it has different durability properties.
What this is doing inside Canada
The tourism numbers are downstream of the travel numbers, and the change is large enough to matter at province- and city-level economic accounting:
- Border-region retail. Pre-tariff, roughly 13 % of all Canadian-side cross-border vehicle traffic was same-day commercial trips (Niagara, Detroit-Windsor corridor, Lower Mainland to Bellingham). Statistics Canada's retail trade data shows that border-region retail in southern Ontario, southwestern BC, and southwestern Quebec rose roughly 4–6 % year-over-year through 2025 — a positive economic effect of the same shift.
- Domestic Canadian tourism. Provincial tourism boards (Tourism BC, Destination Ontario, Tourisme Québec) reported double-digit gains in domestic-tourism spending across summer 2025. The natural inference — that Canadians who would have gone to Florida instead went to Tofino, Mont-Tremblant, or PEI — is plausible but not yet rigorously isolated from other factors.
- Air-route capacity. Air Canada and WestJet trimmed several US routes during 2025 in response to demand, with the largest cuts on lower-utilisation routes (the related r/OpenDataCanada post listing Air Canada's 10 emptiest US routes had several routes flying at 54 % load factor by early 2026).
The cumulative effect is a meaningful redistribution of where Canadian travel money is being spent. The total volume hasn't fallen — it has moved.
The methodology criticisms worth taking seriously
Objection one: this is a normal post-COVID rebalancing, not a tariff effect.
The 2020–22 COVID period had its own travel collapse and recovery. By 2024, Canadian-US travel had returned to pre-pandemic levels (the August 2024 peak of 4.17 million is roughly equal to pre-pandemic August averages). If the 2025 drop were a continuation of post-COVID normalisation, the overseas line would also be falling, since Canadians would simply be staying home. Overseas held flat. The drop is structural to the US specifically, not to Canadian outbound travel generally.
Objection two: the comparison-base is contaminated.
Statistics Canada's monthly figures are seasonally unadjusted. Year-over-year is the standard comparison precisely because it controls for seasonality. The seasonally adjusted series (Table 24-10-0054-01) tells the same story — Feb 2026 seasonally adjusted Canadian returns from US were down 1.6 % monthly and the trailing 12-month total was down well over 25 %. The base is fine.
Objection three: 14 consecutive monthly declines is a stat-shop trick — the underlying numbers may be small.
The underlying numbers are not small. The August 2024 peak was 4.17 million Canadian return trips in a single month, against a population of roughly 41 million. That is roughly 1 in 10 Canadians making a trip to the US in that single month. The Feb 2026 figure (1.97 million) is still meaningful. The 2.2 million-trip difference between August 2024 and February 2026 monthly readings, applied across 14 months, implies on the order of 15–20 million fewer cross-border trips than the previous trajectory would have produced.
Objection four: this is about consumers, not the broader Canadian economy.
Partially correct. The travel data is mostly leisure and family travel. Business travel is harder to isolate from the data and probably moved less. But the consumer-facing portion of cross-border travel is also where the bulk of US-side merchant revenue comes from — duty-free shops, border casinos, US sports venues, Buffalo-area shopping centres. Loss of that revenue is what shows up in US local labour and tax data, and several US states bordering Canada (New York, Michigan, Washington, Vermont) have publicly noted measurable revenue effects through 2025 budget cycles.
What's not in this chart but matters
Three things this single visualization doesn't show, which would sharpen the picture if they were available on the same footing:
- Per-province origin for the trip drops. Anecdotally, BC and Ontario residents have moderated their drops more than Quebec residents (where "Buy Canadian" framing was strongest). The StatCan series is national-level only.
- Spending per trip. The trip count is down 53 %; whether spending per remaining trip is up, flat, or down is not in this dataset. CIBC and TD's foreign-card data has reported declines on a per-trip basis as well, suggesting both trip volume and per-trip spend fell.
- Whether the recovery has begun. February 2026's −12.5 % YoY is the smallest YoY decline since January 2025. By March 2026 the comparison base flips — March 2025 was already low — and the YoY series will start rising mechanically. The next two quarters of data will tell whether Canadians are returning to US travel as the tariff regime moderates.
What this all adds up to
A 52.8 % drop in Canadian travel to one specific country, sustained for fourteen straight months, isolated from the broader Canadian travel pattern, and dated precisely to a single bilateral political event, is the kind of result that would normally produce a peer-reviewed paper. In this case it's a single Statistics Canada table with a 12-month rolling read.
The constructive question is what happens next. If the political environment continues to moderate, the trip count will recover toward — but probably not to — the August 2024 peak; some share of "Buy Canadian" framing will outlast the tariffs that produced it. If the political environment hardens again, this chart's slope will simply continue downward. Either way, the response was real, fast, and large enough to be visible in monthly national-statistical-agency data, which makes it among the most clearly-attributable consumer-behaviour changes Canada has produced in a generation.
Read next