
Category
Housing
Prices, rents, vacancy, supply. The data behind the dominant Canadian political story of the decade.
Housing, by the numbers
Live supply and price indicators from Statistics Canada and CMHC.
Only Newfoundland and Labrador starts fewer homes per person than Ontario
Homes started per 1,000 people, Oct 2025 to Sep 2026
All 10 provinces: 6.0
12-month average of CMHC's seasonally adjusted annual rates, divided by population on July 1, 2026. Sources: Statistics Canada, Table 34-10-0158 and Table 17-10-0009.
Data as of 13 November 2026, updated after each Statistics Canada or CMHC release. The source under each number links to its table.
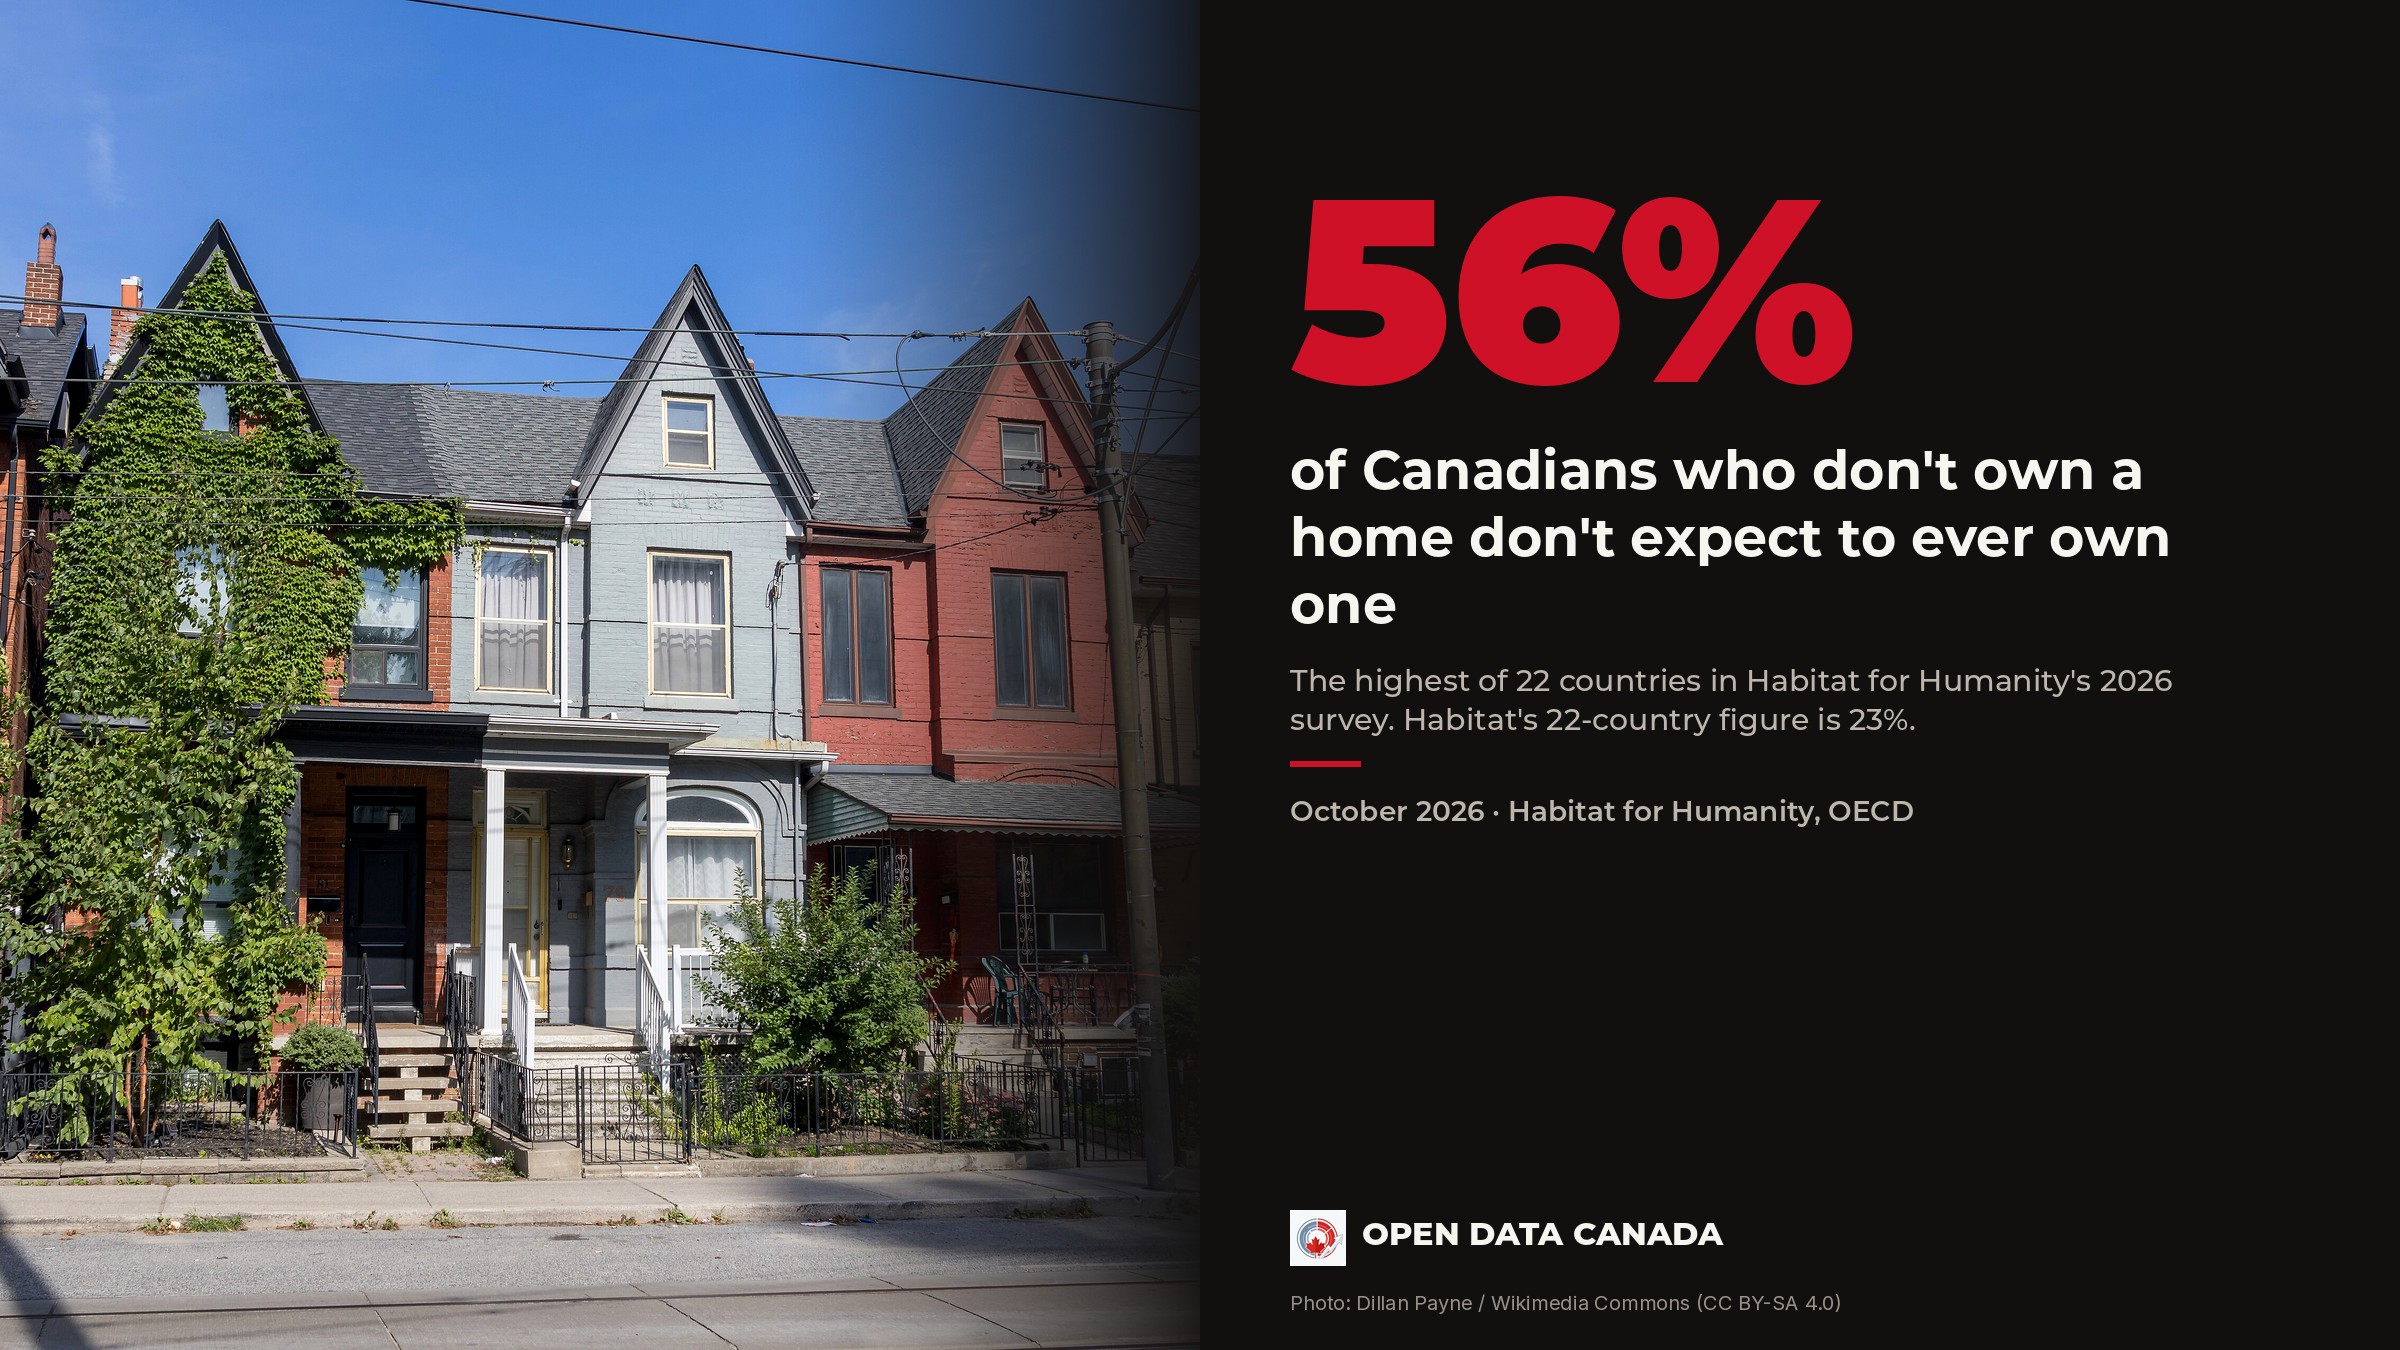
56% of Canadians Who Don't Own a Home Don't Expect to Ever Own One — More Than Double the Global Average
Canada has the highest share of the 22 countries in Habitat for Humanity's 2026 survey. Canadians aren't cutting back harder than people elsewhere, but house prices here have pulled further ahead of incomes than in most other OECD countries.
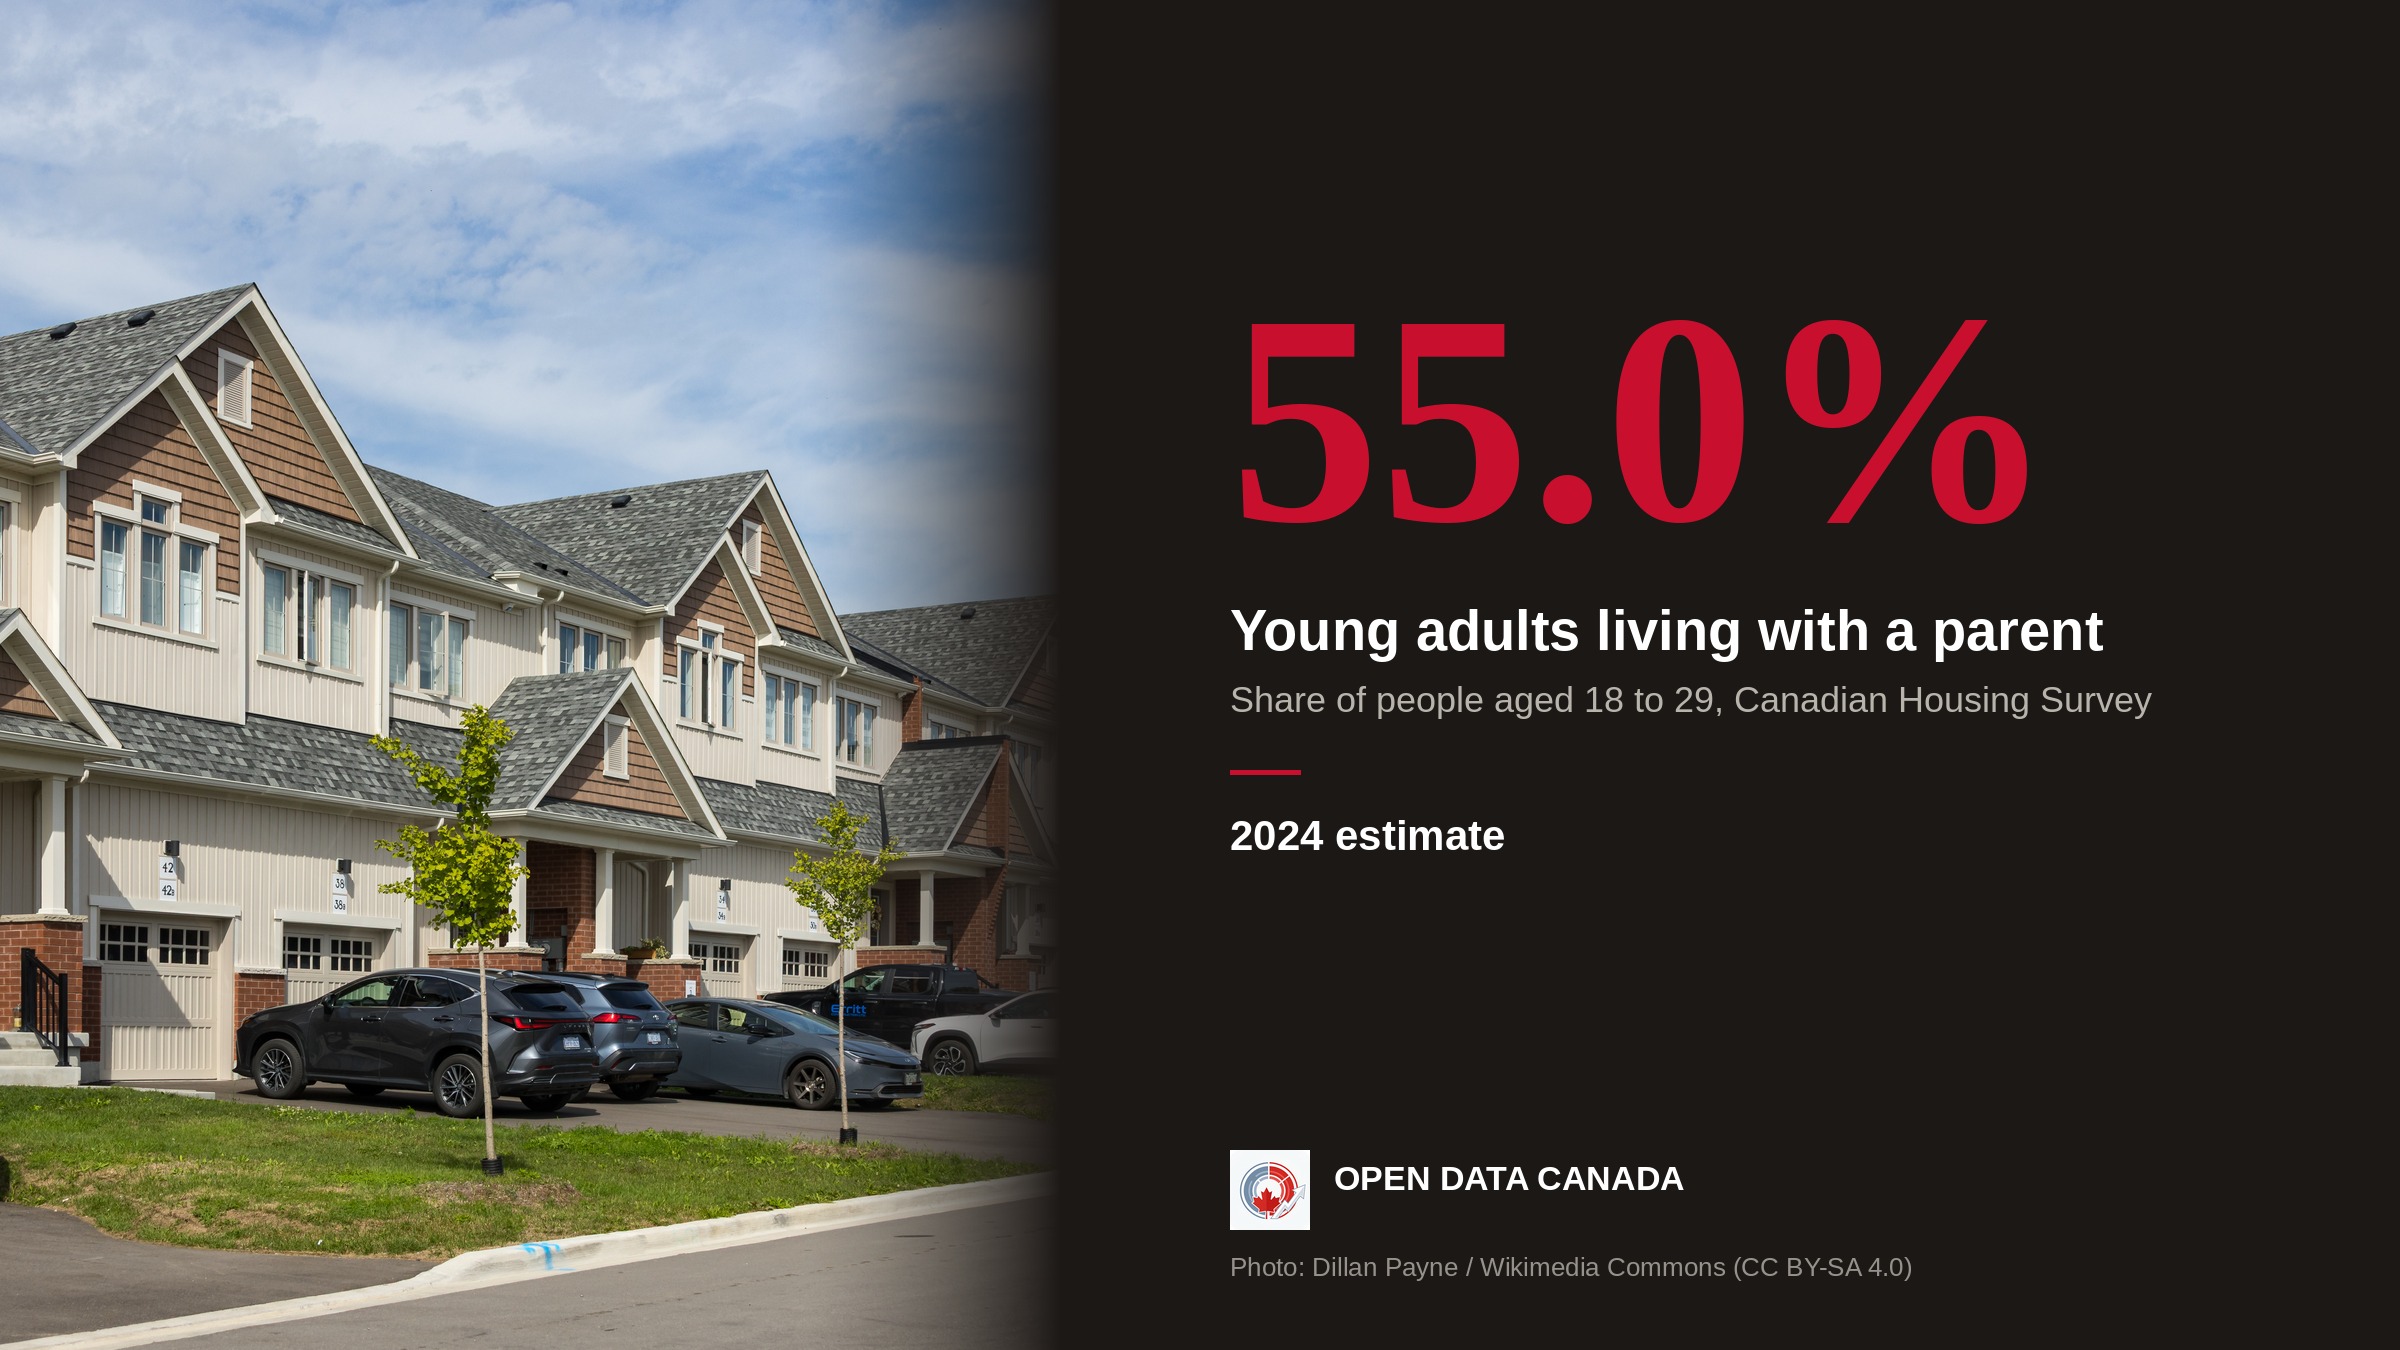
In 1981, 27% of young adults in Canada lived with their parents. The latest housing survey puts it at 55%.
Census data show the share climbing to 42% by 2011. Statistics Canada's 2024 housing survey puts it at 55%, up from 51% in 2022, about 3.5 million people.
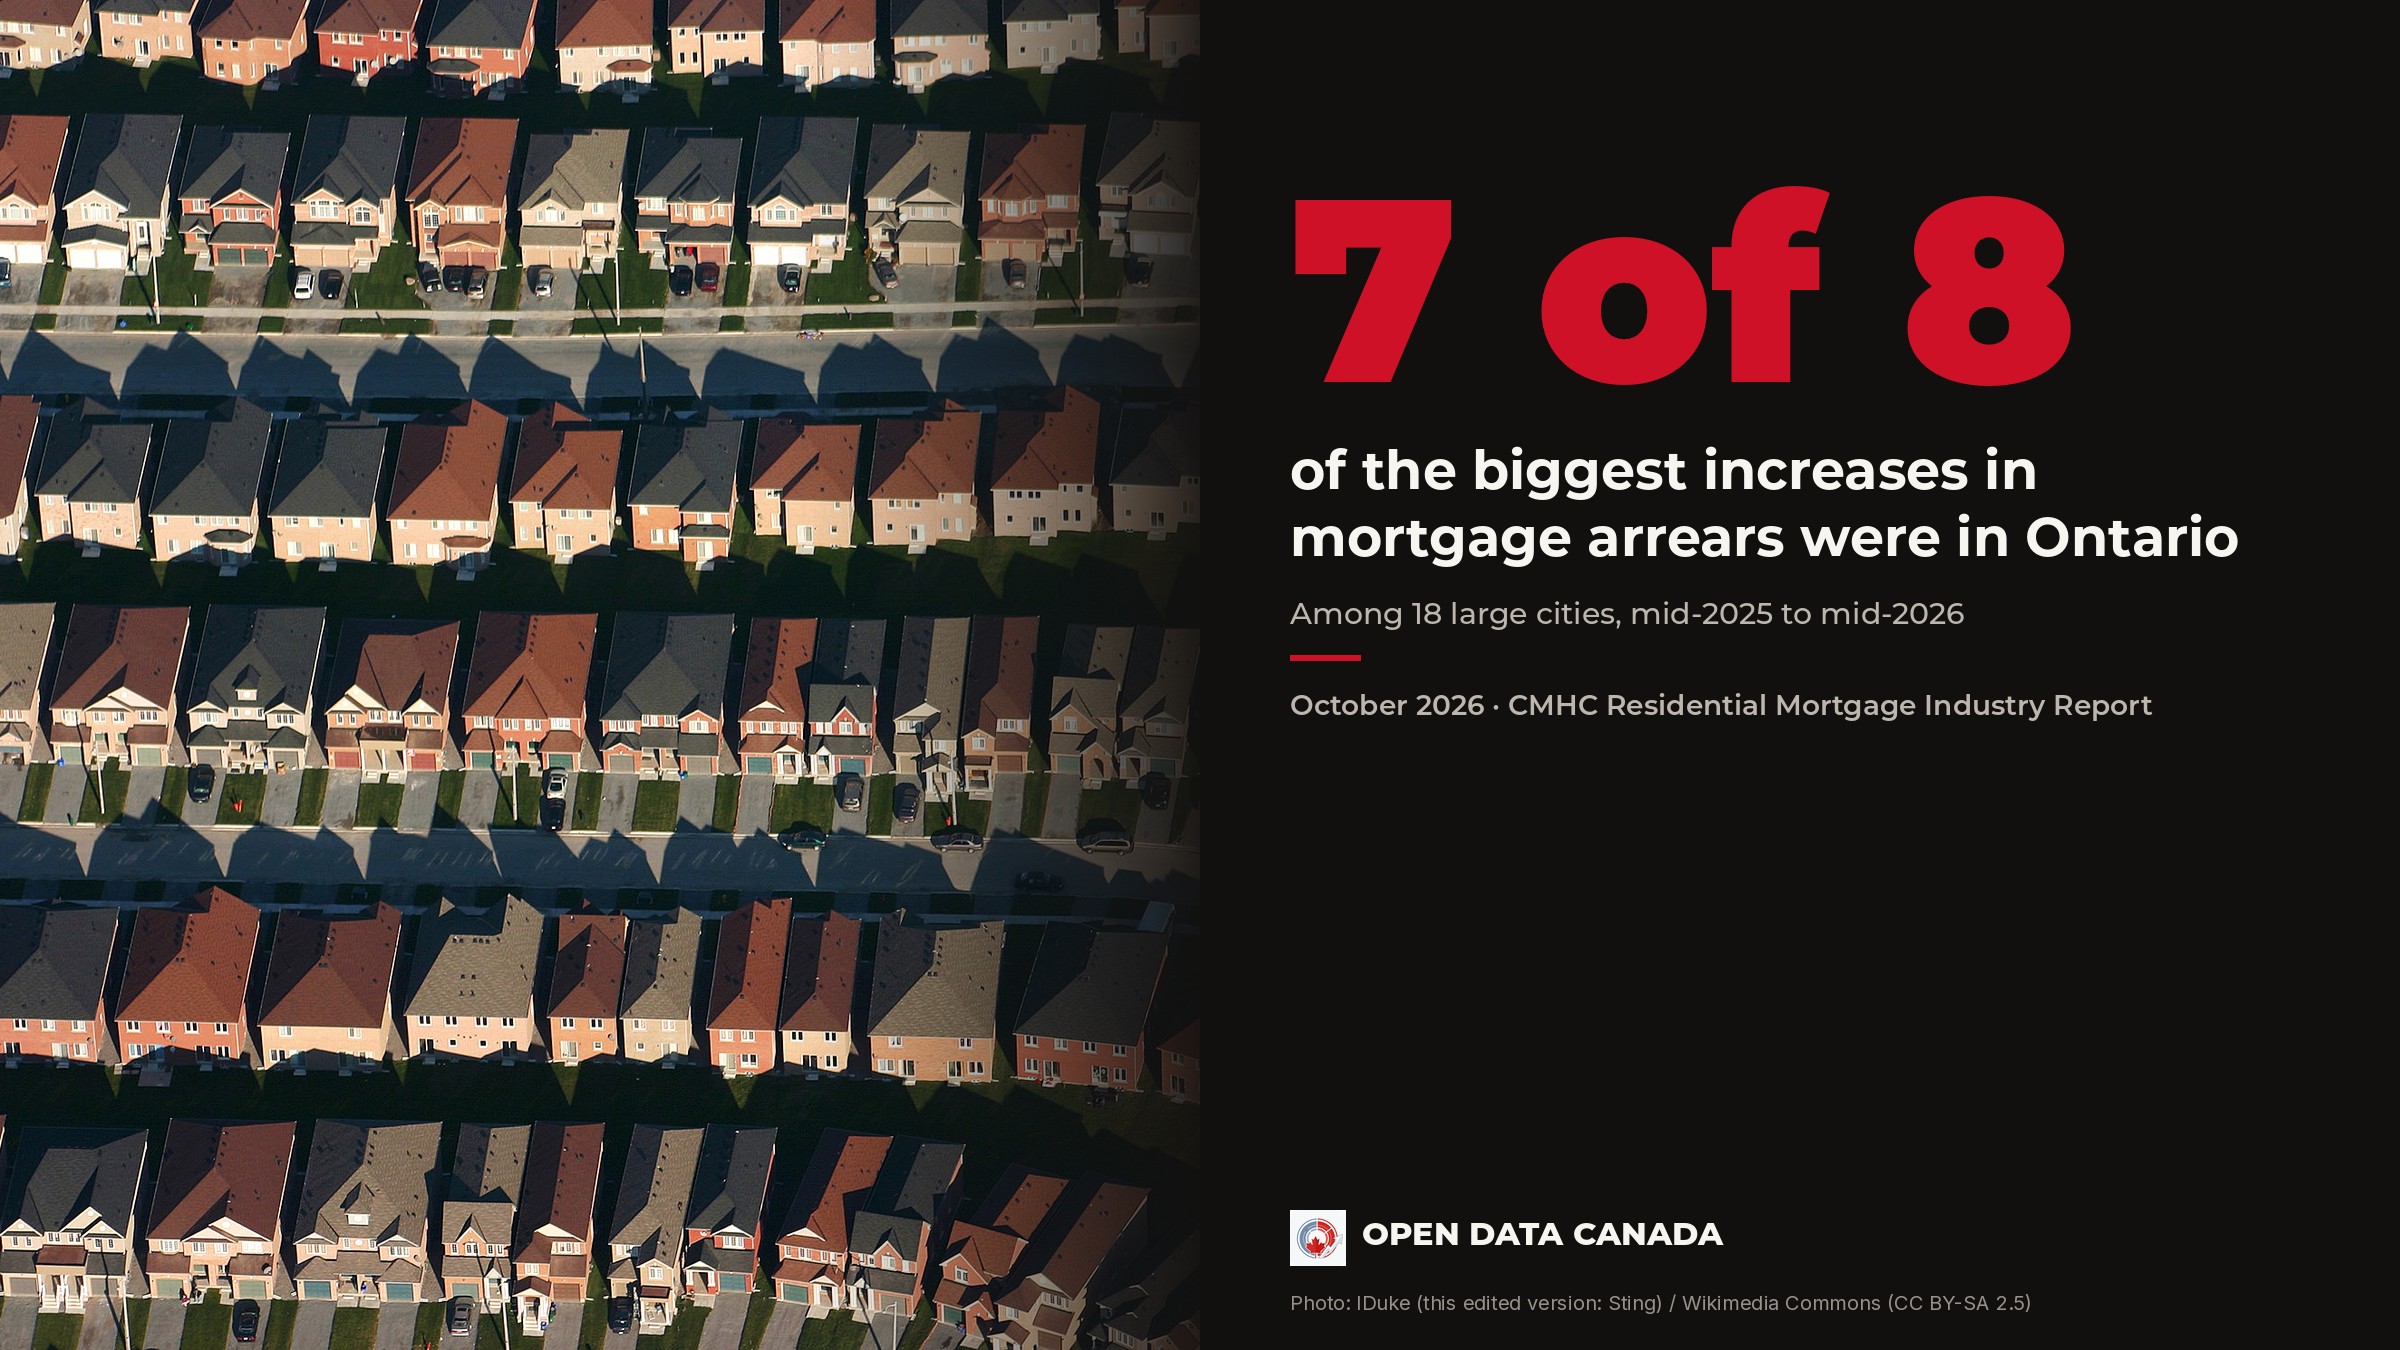
Missed mortgage payments are rising fastest in Ontario cities
Toronto, London and Windsor had the biggest yearly increases in mortgages 90 or more days behind. Seven of the eight largest increases were in Ontario, while late payments fell in several Prairie cities.
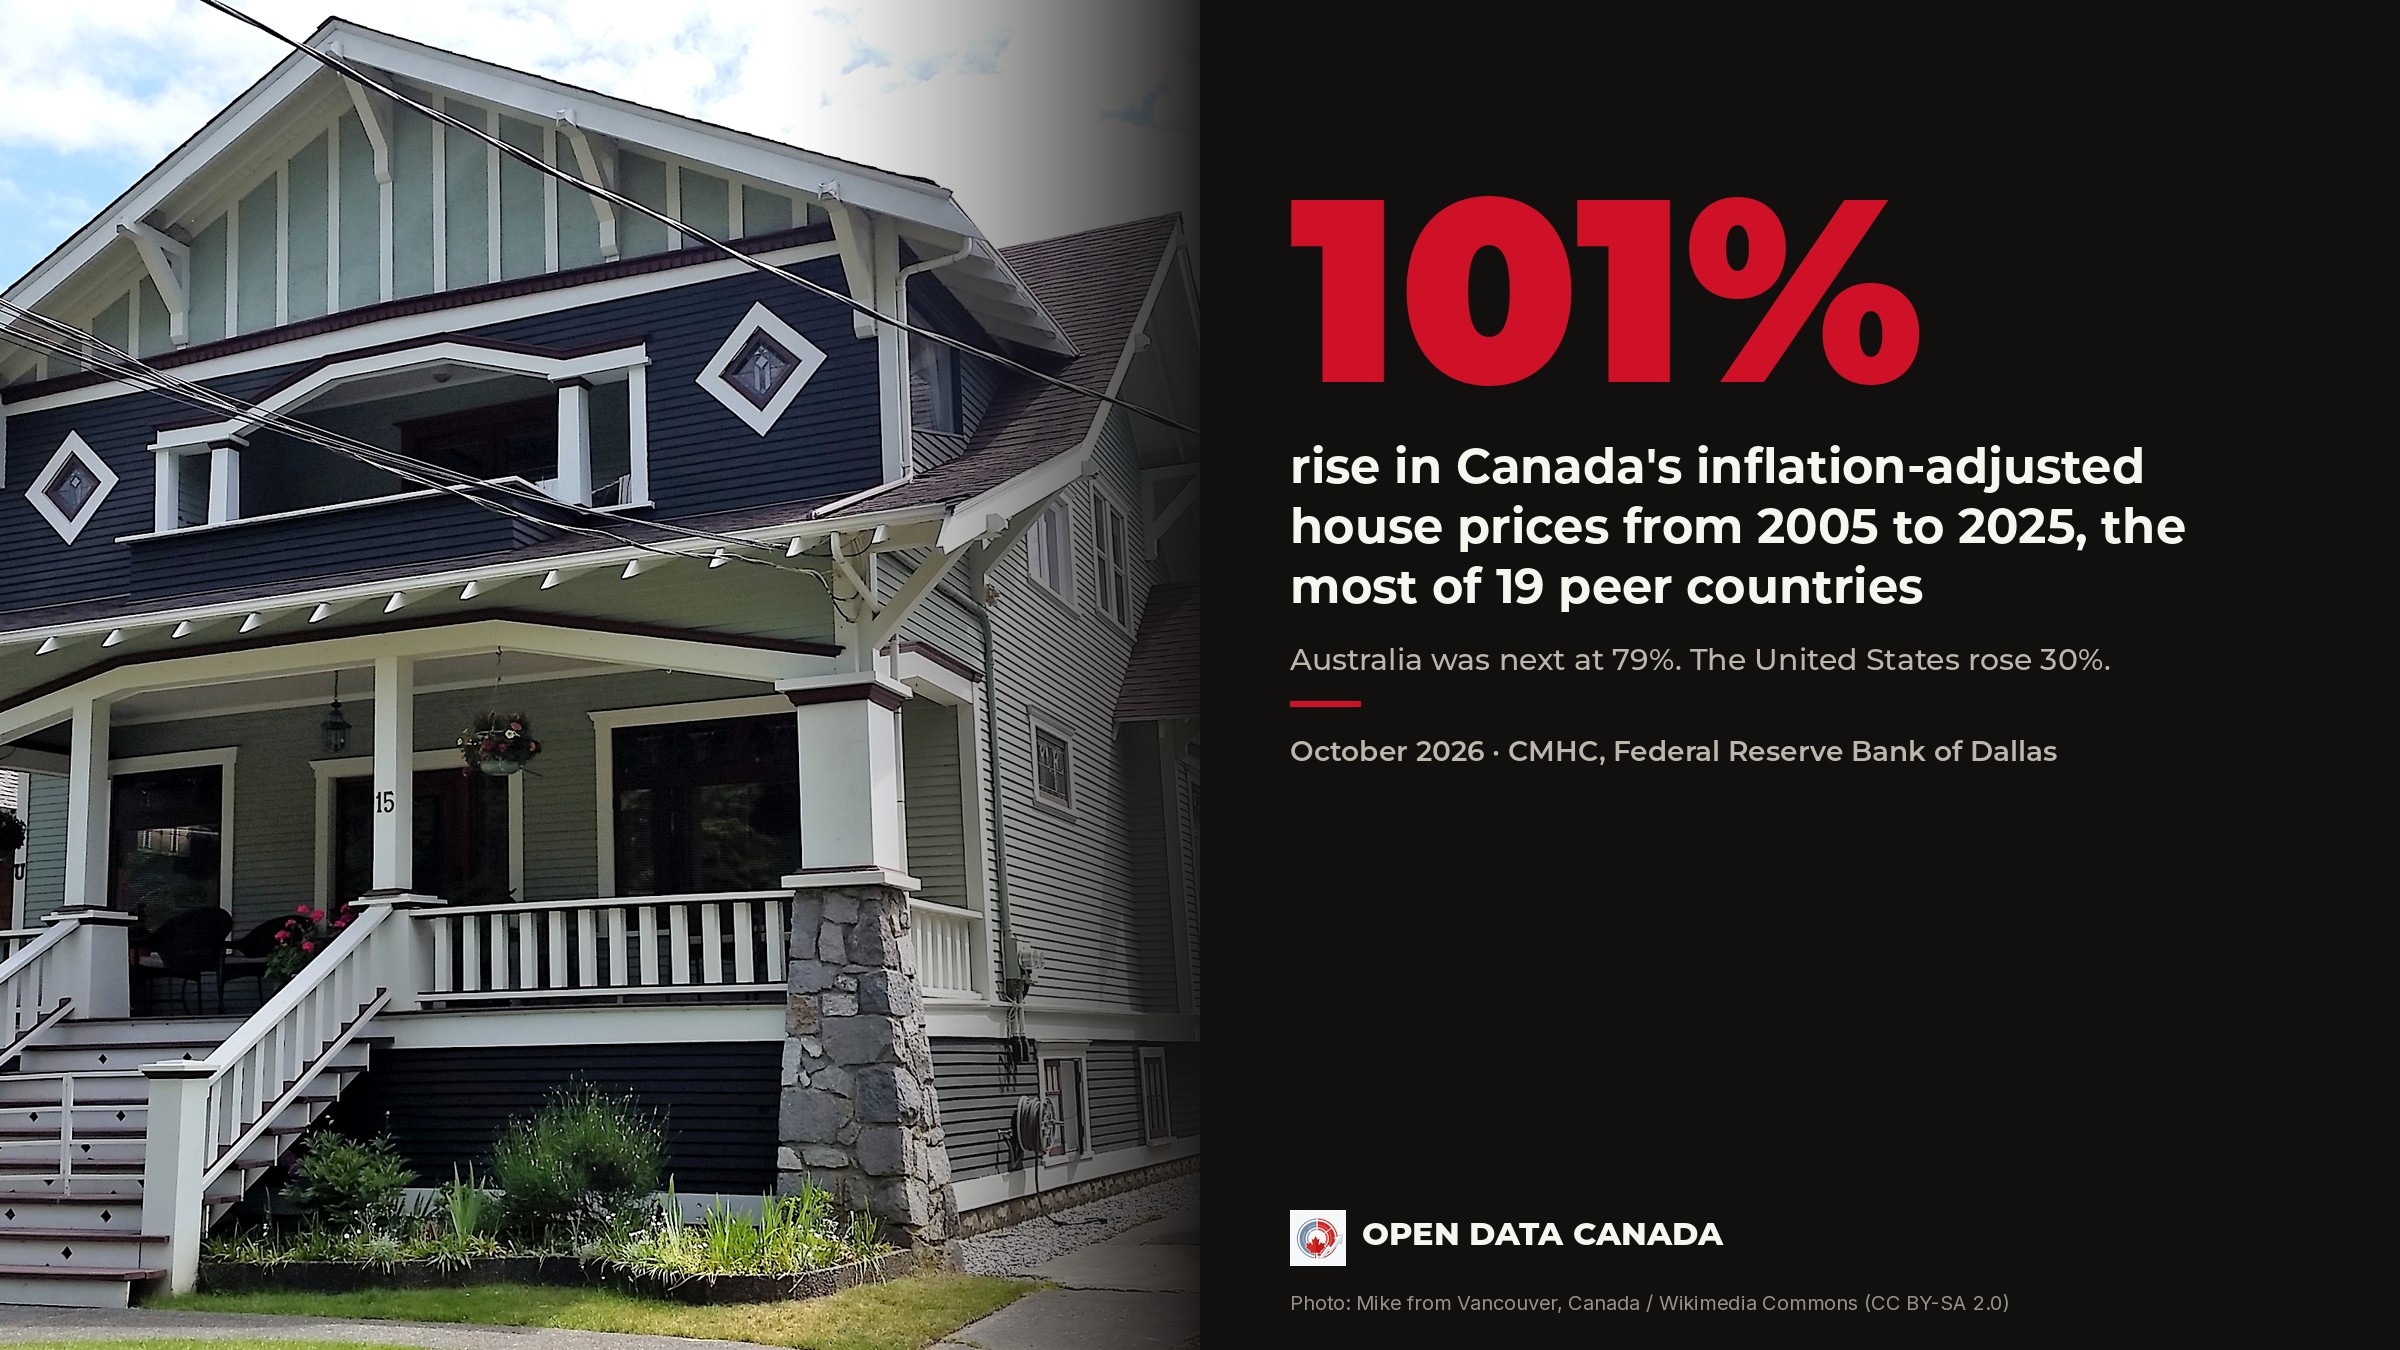
Canada's House Prices Doubled After Inflation, the Most of 19 Peer Countries
Inflation-adjusted house prices in Canada rose 101% from 2005 to 2025, the most of 19 peer countries in a new CMHC comparison. Australia was next at 79%. Prices have fallen since early 2022, by 19% in dollars and 29% after inflation.
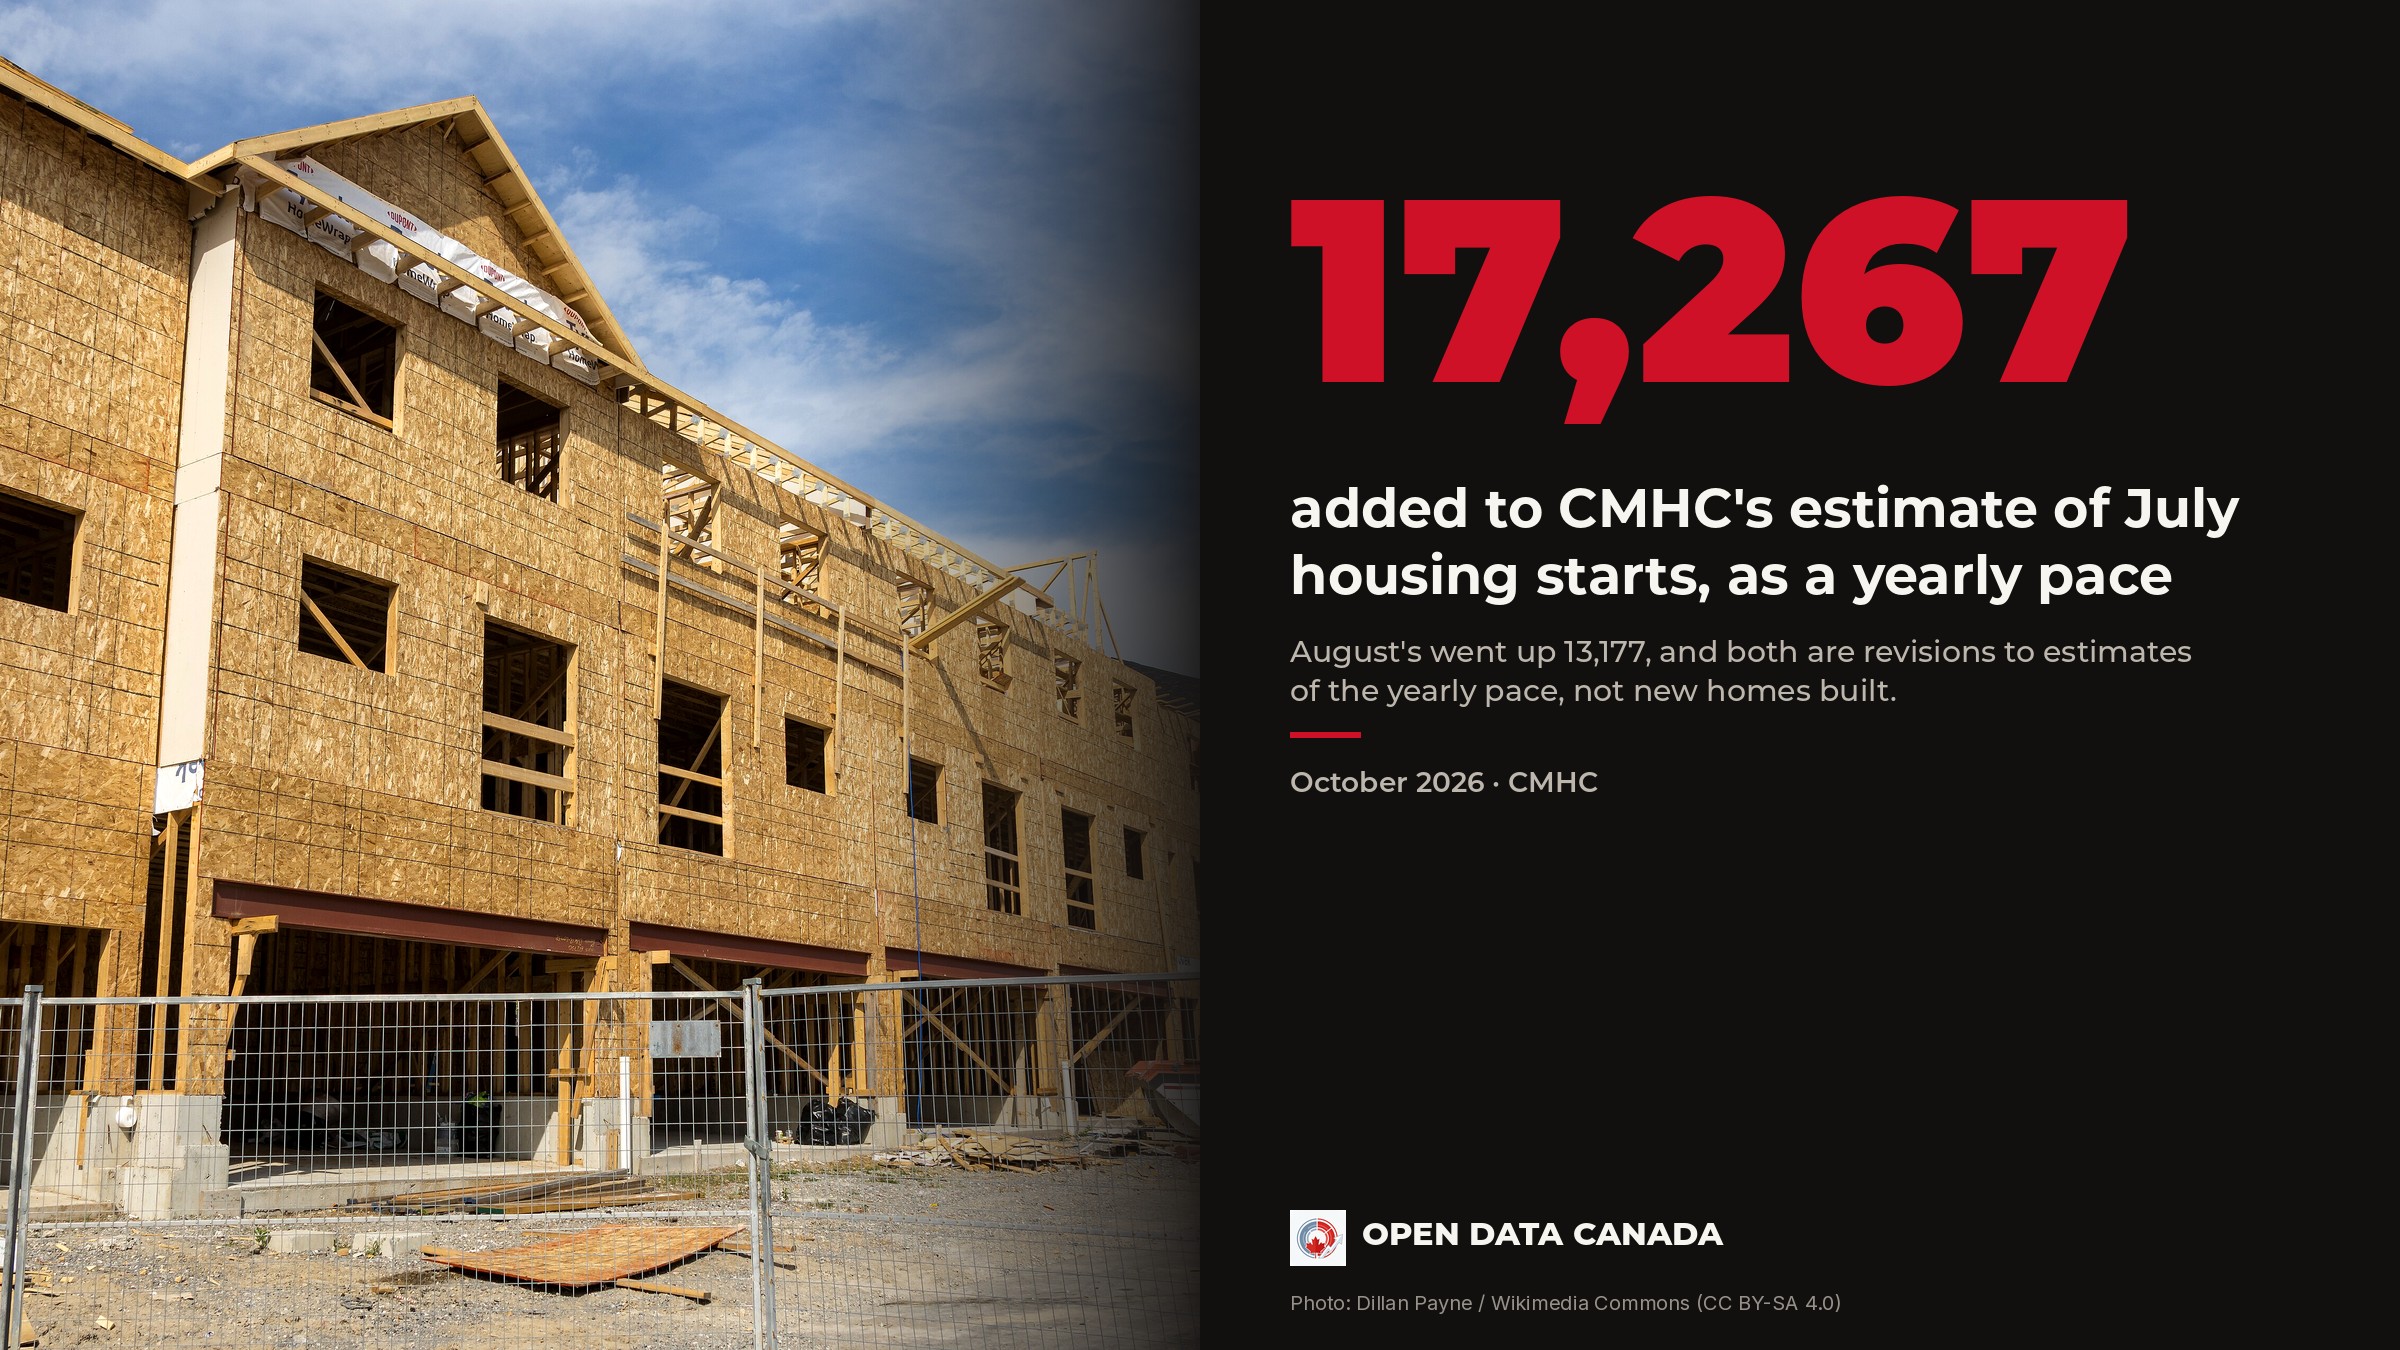
CMHC revised Canada's housing starts sharply higher for July and August
CMHC's September release raised its estimate of July's annual pace of housing starts by 17,267 and August's by 13,177. Those are revisions to annual-rate estimates, not a count of extra homes. September came in at a 248,896 annual pace.
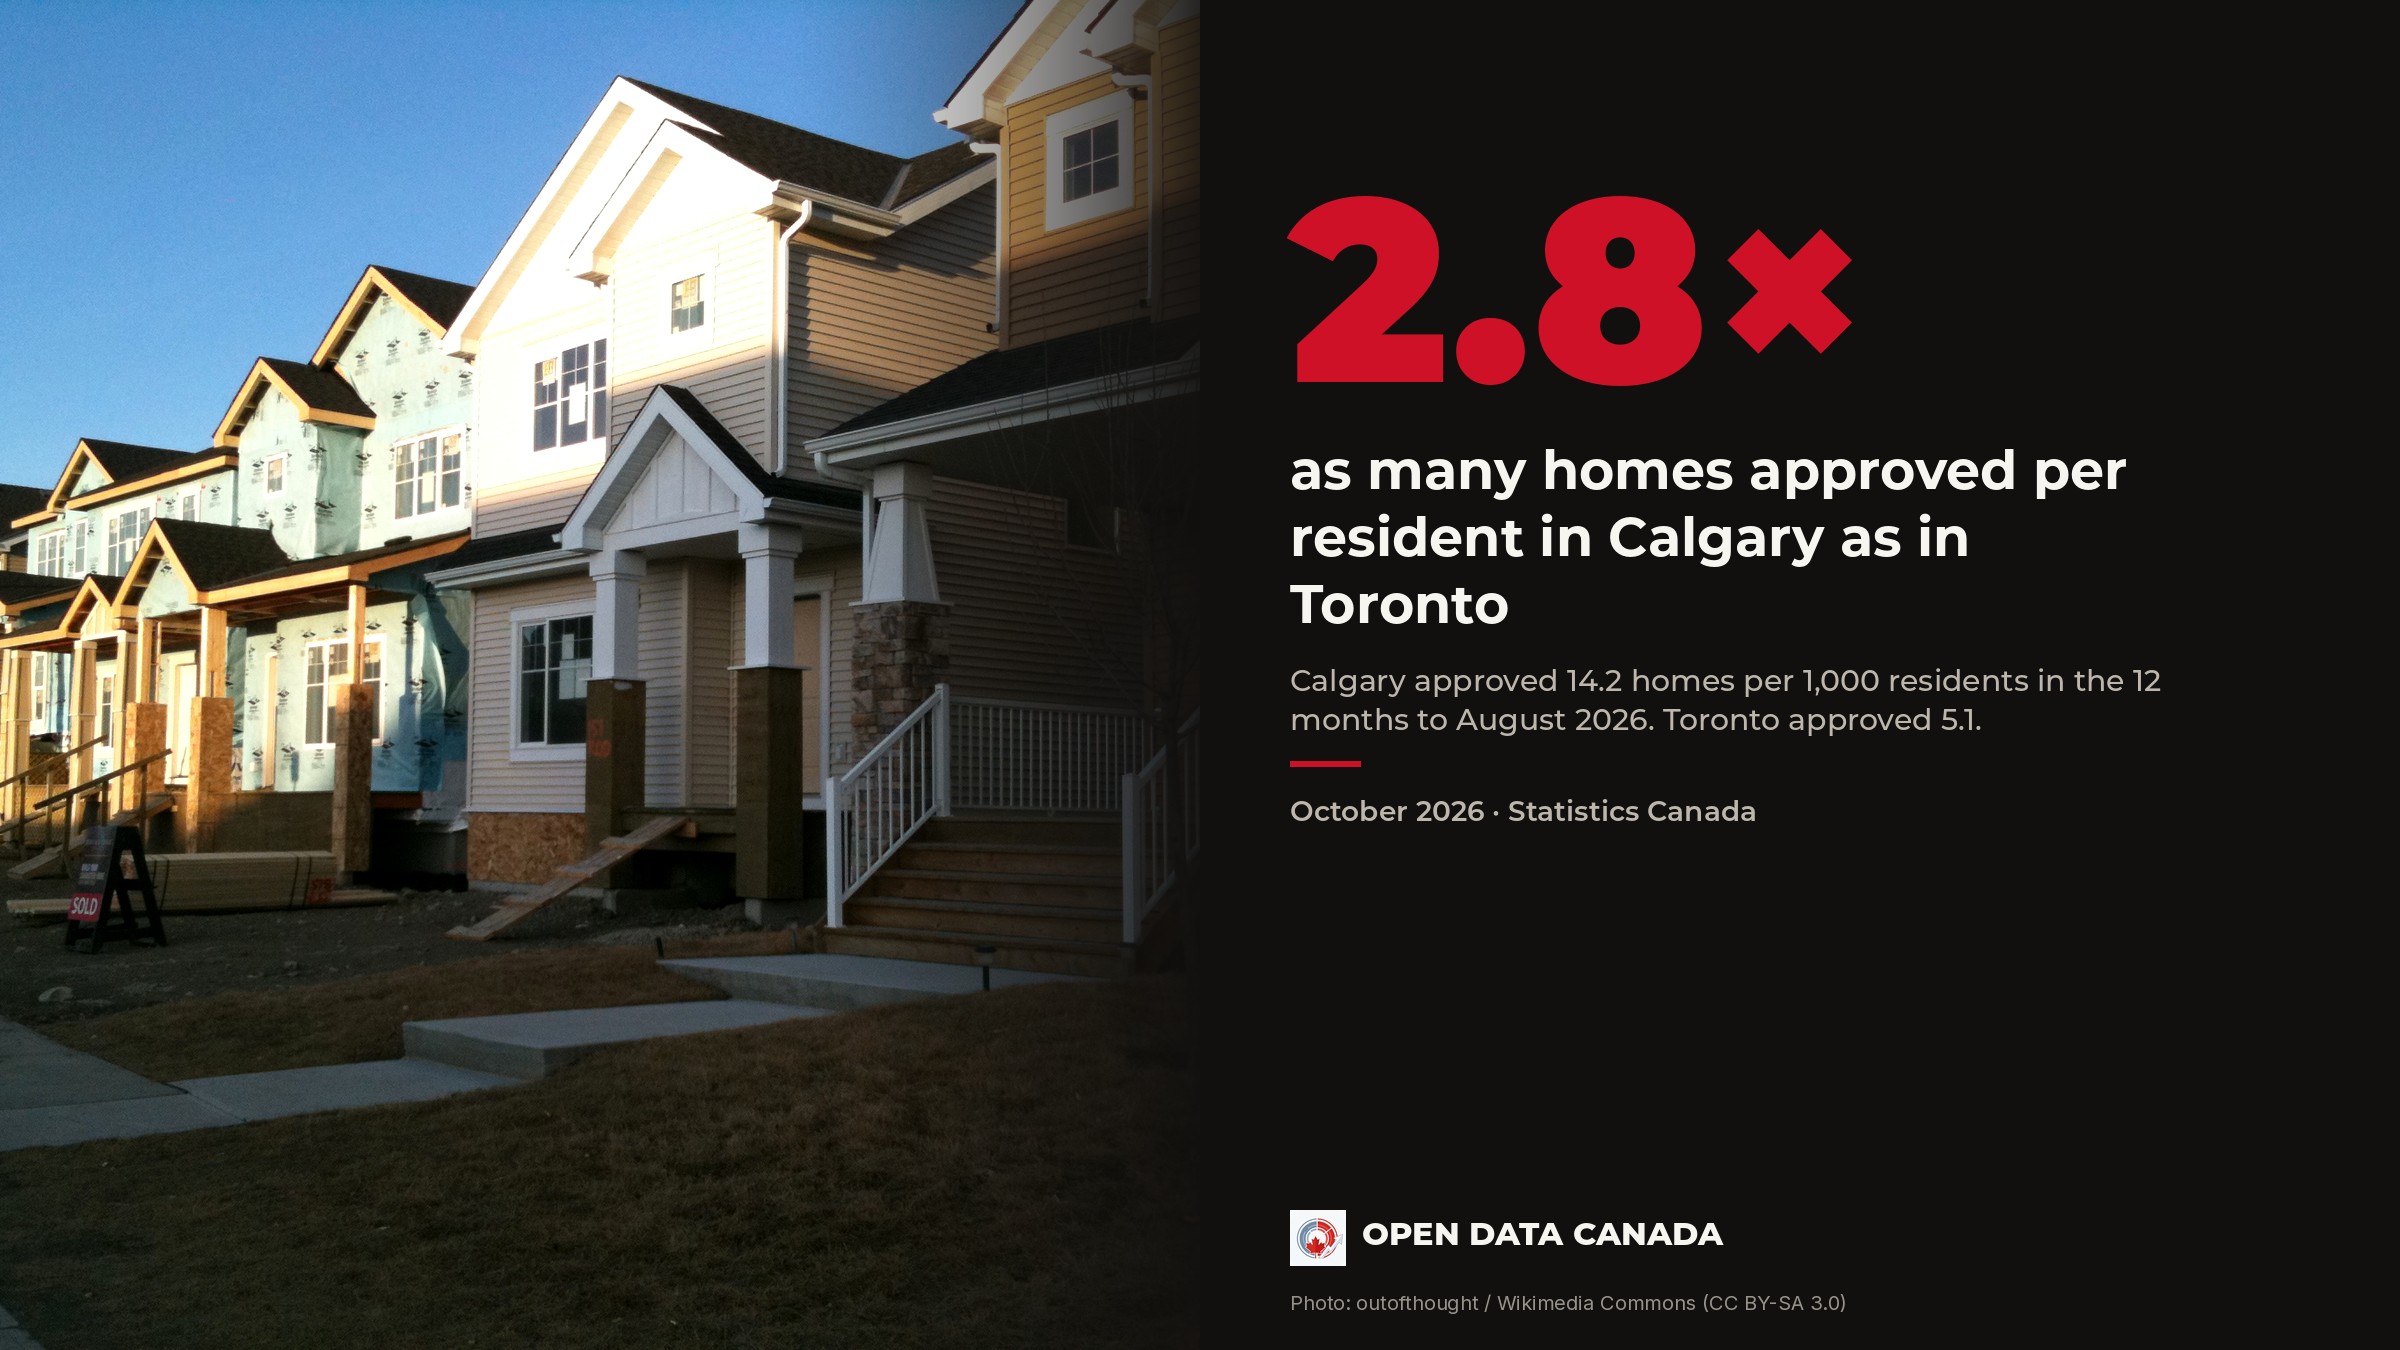
Calgary approved 2.8 times as many homes per resident as Toronto
Toronto approved more homes than any other Canadian metro. Per resident, it sits near the bottom of 42. Nine of the ten metros with the fewest approvals per person are in Ontario.
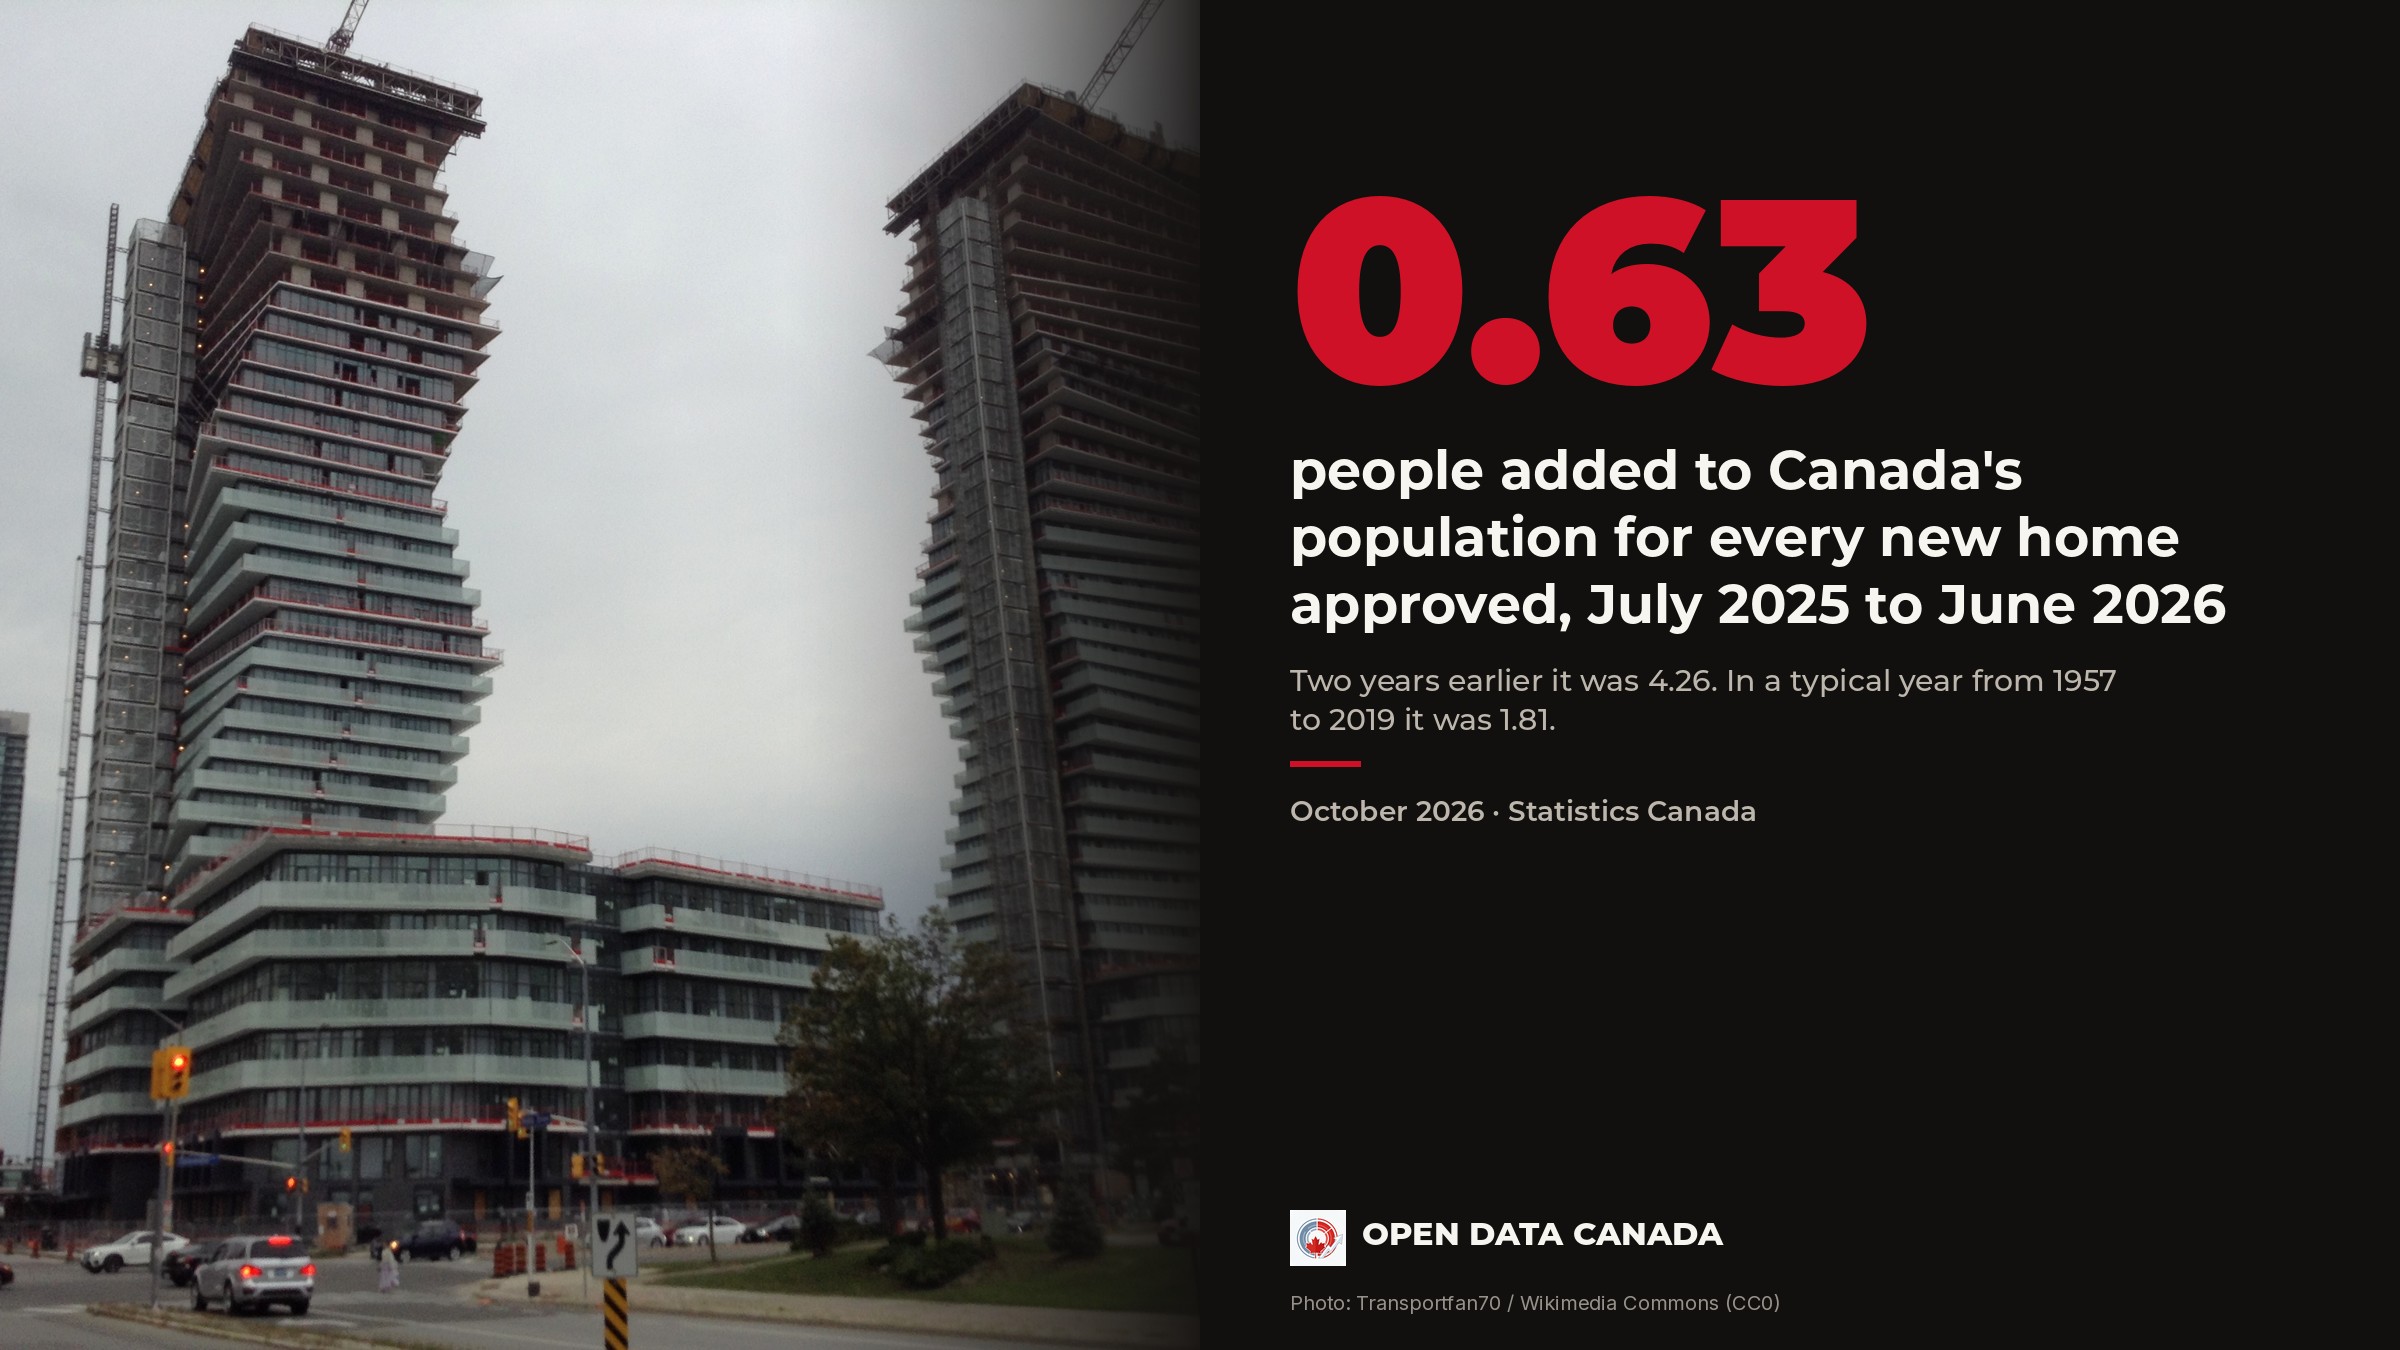
Canada Approved More Homes Than Its Population Grew in 2025–26
Canada's population grew by 189,425 people between July 2025 and July 2026. Over the same 12 months, permits were issued for 303,006 new homes. Two years earlier there were 4.3 new residents for every home approved.
Buying a typical Vancouver home requires about 225,000 dollars a year
At the five-year fixed rate three big banks are offering, none of our seven cities passes the 30% affordability test, and Edmonton sits right on the line. Even at the lowest rate we found, only Edmonton passes. Vancouver is the extreme, at about 225,000 dollars a year, twice what a typical household earns.

Asking rents fell. The rent people pay went up.
Statistics Canada says asking rents fell over the past year. It also says rents rose almost four per cent. Both are correct. One number prices the apartment you would move into, the other the one you already live in, and the difference explains most of the confusion.
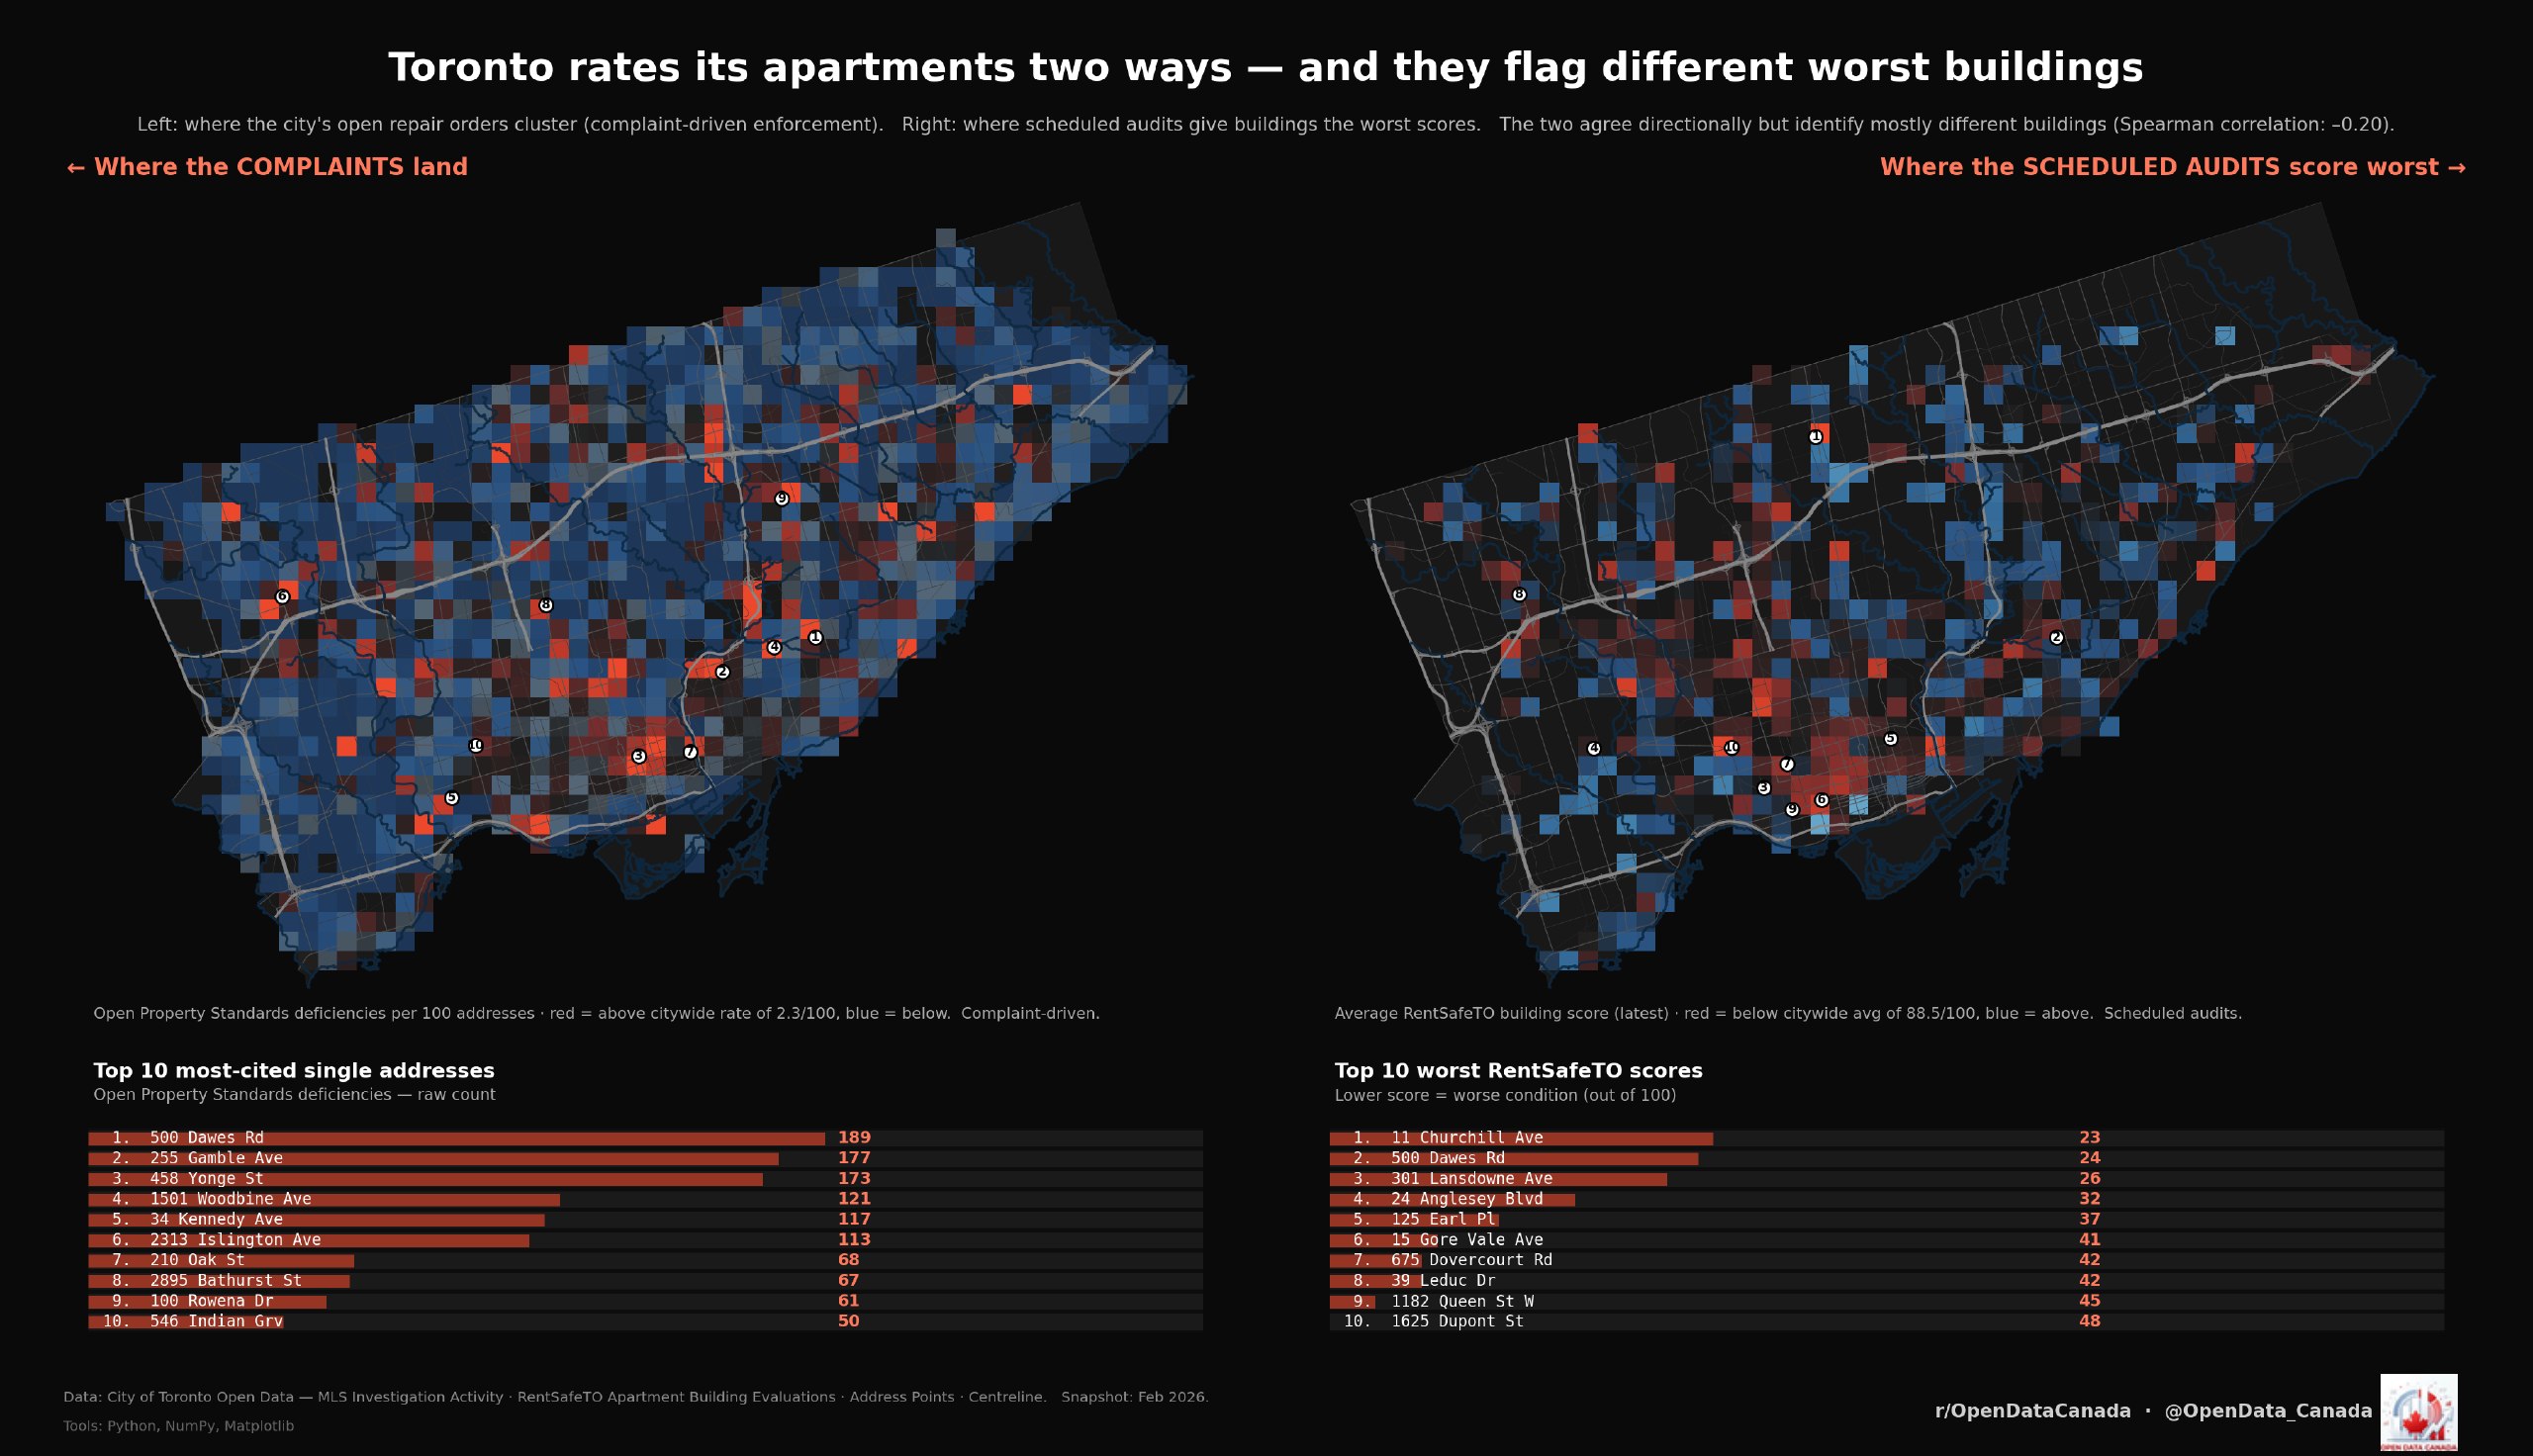
Toronto rates its apartments two ways — and they almost never agree
500 Dawes Road is the only building both of Toronto's parallel rating systems flag as one of the worst — and that agreement is unusual enough it might be why Mayor Chow went there.