Category
Environment & Energy
Emissions, energy infrastructure, climate, and wildfire. The numbers behind Canada's climate commitments, and the structural picture that constrains what's politically possible.
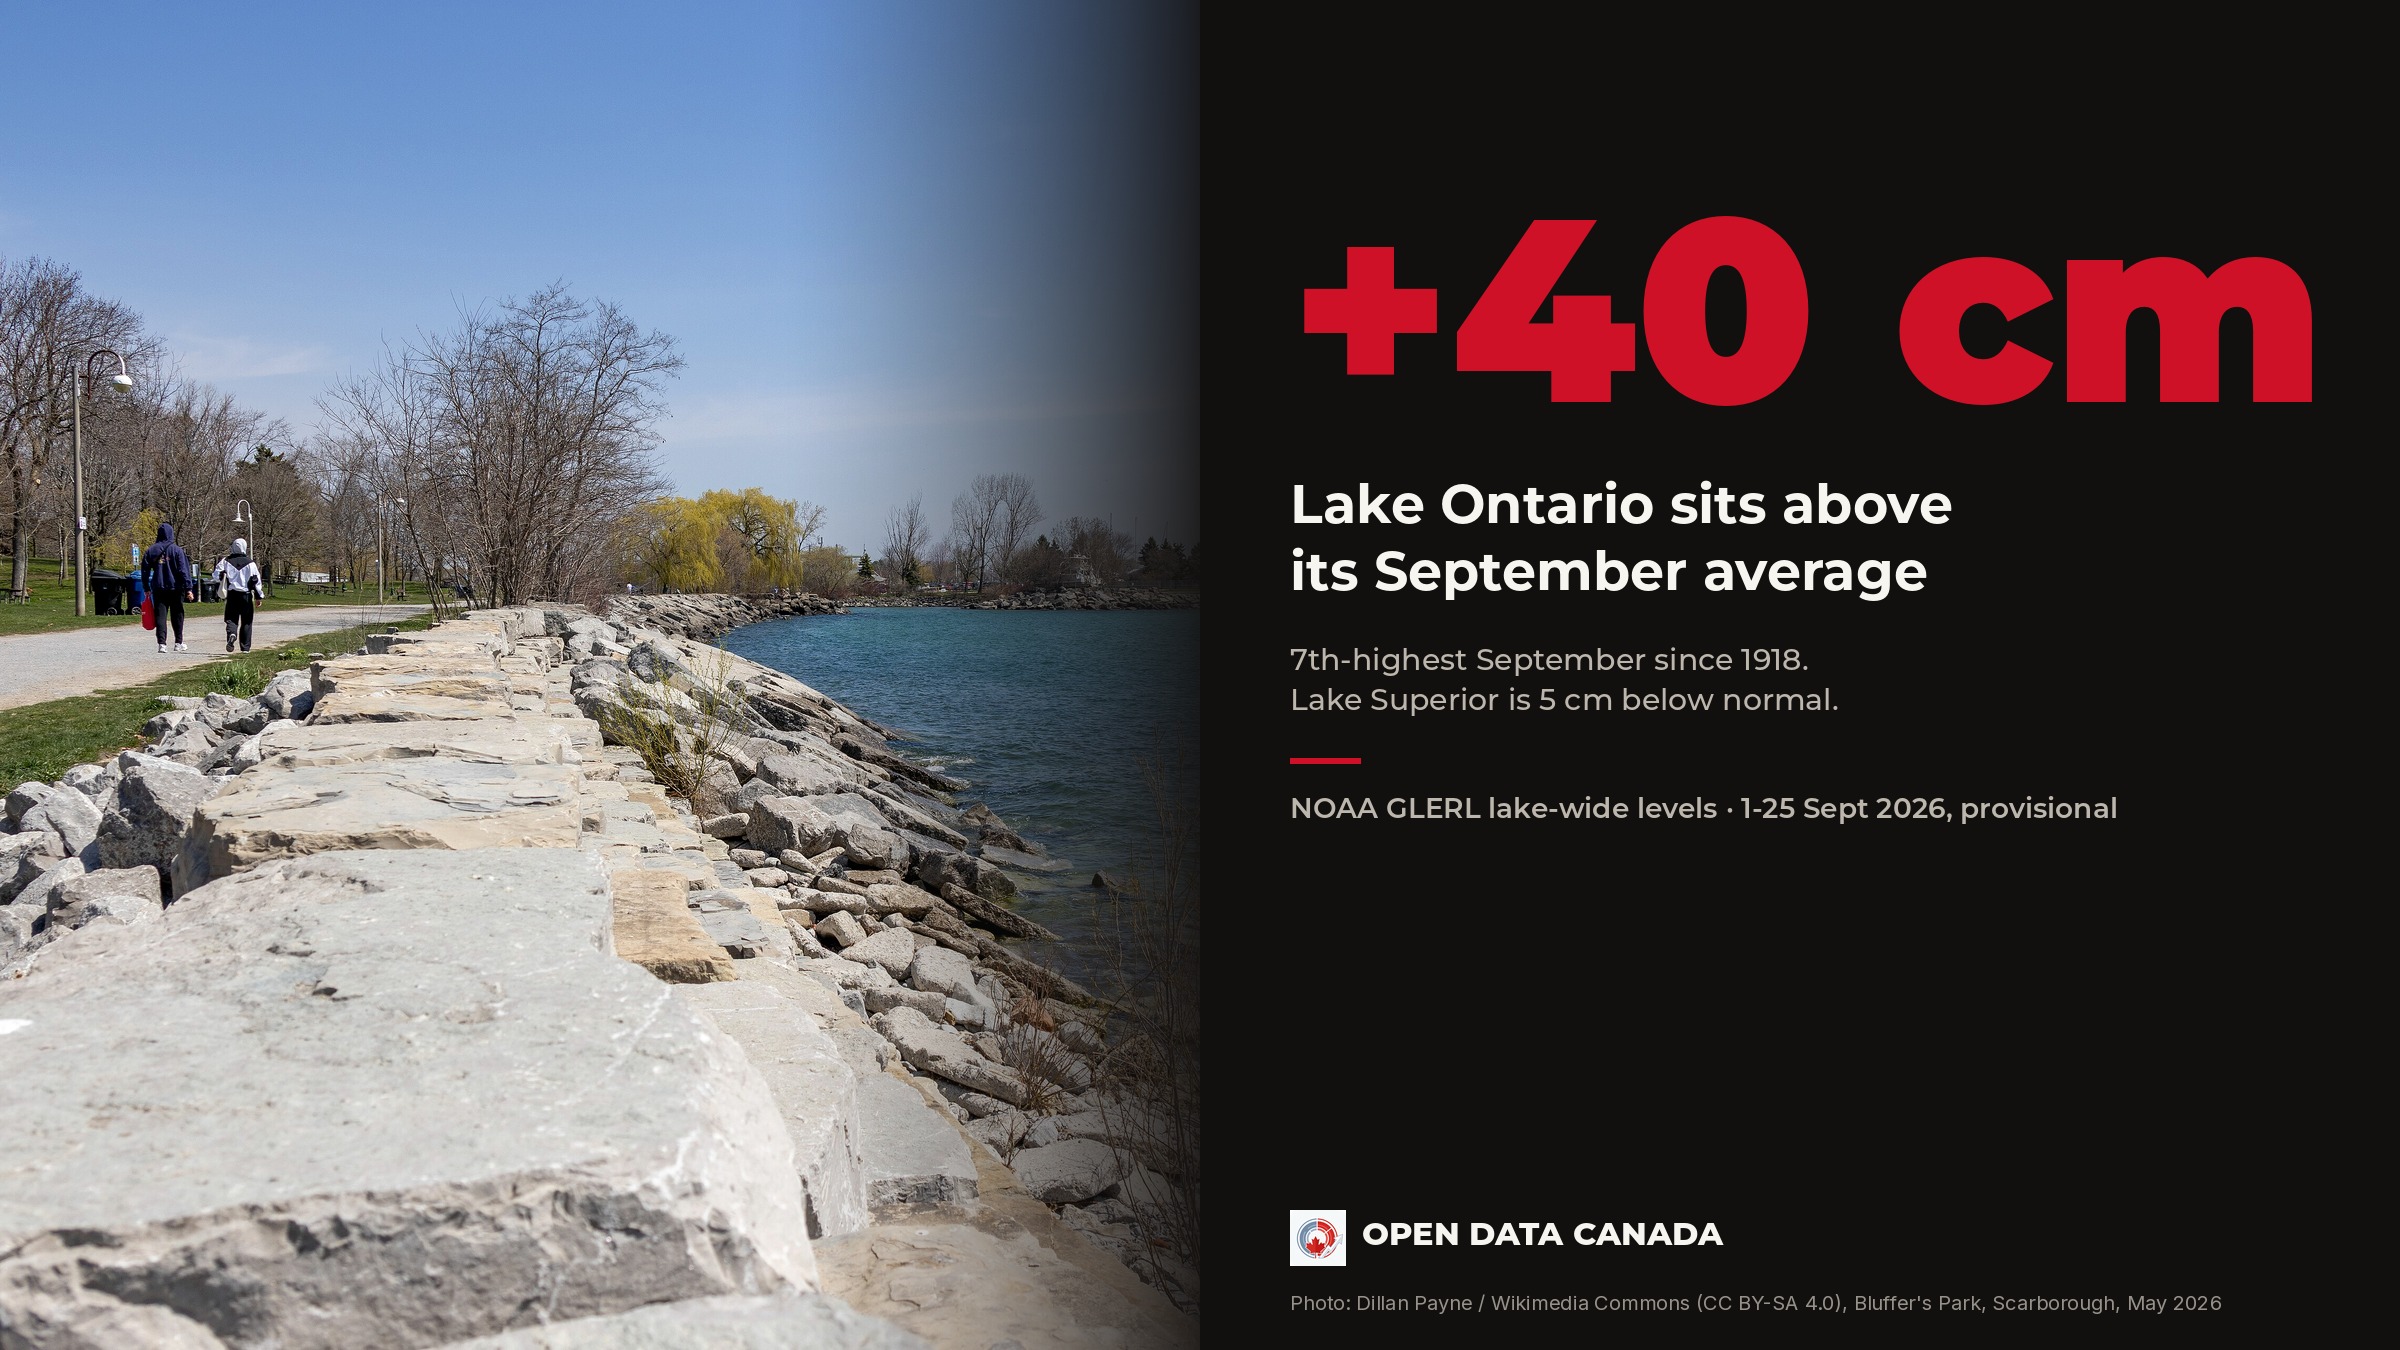
Lake Ontario Is Running Above Normal. Lake Superior Is Below It
Every Great Lake started 2026 below its long-term average. By September, on provisional figures, Lake Ontario was 40 centimetres above it, its 7th-highest September since 1918, while Lake Superior sat 5 centimetres under.
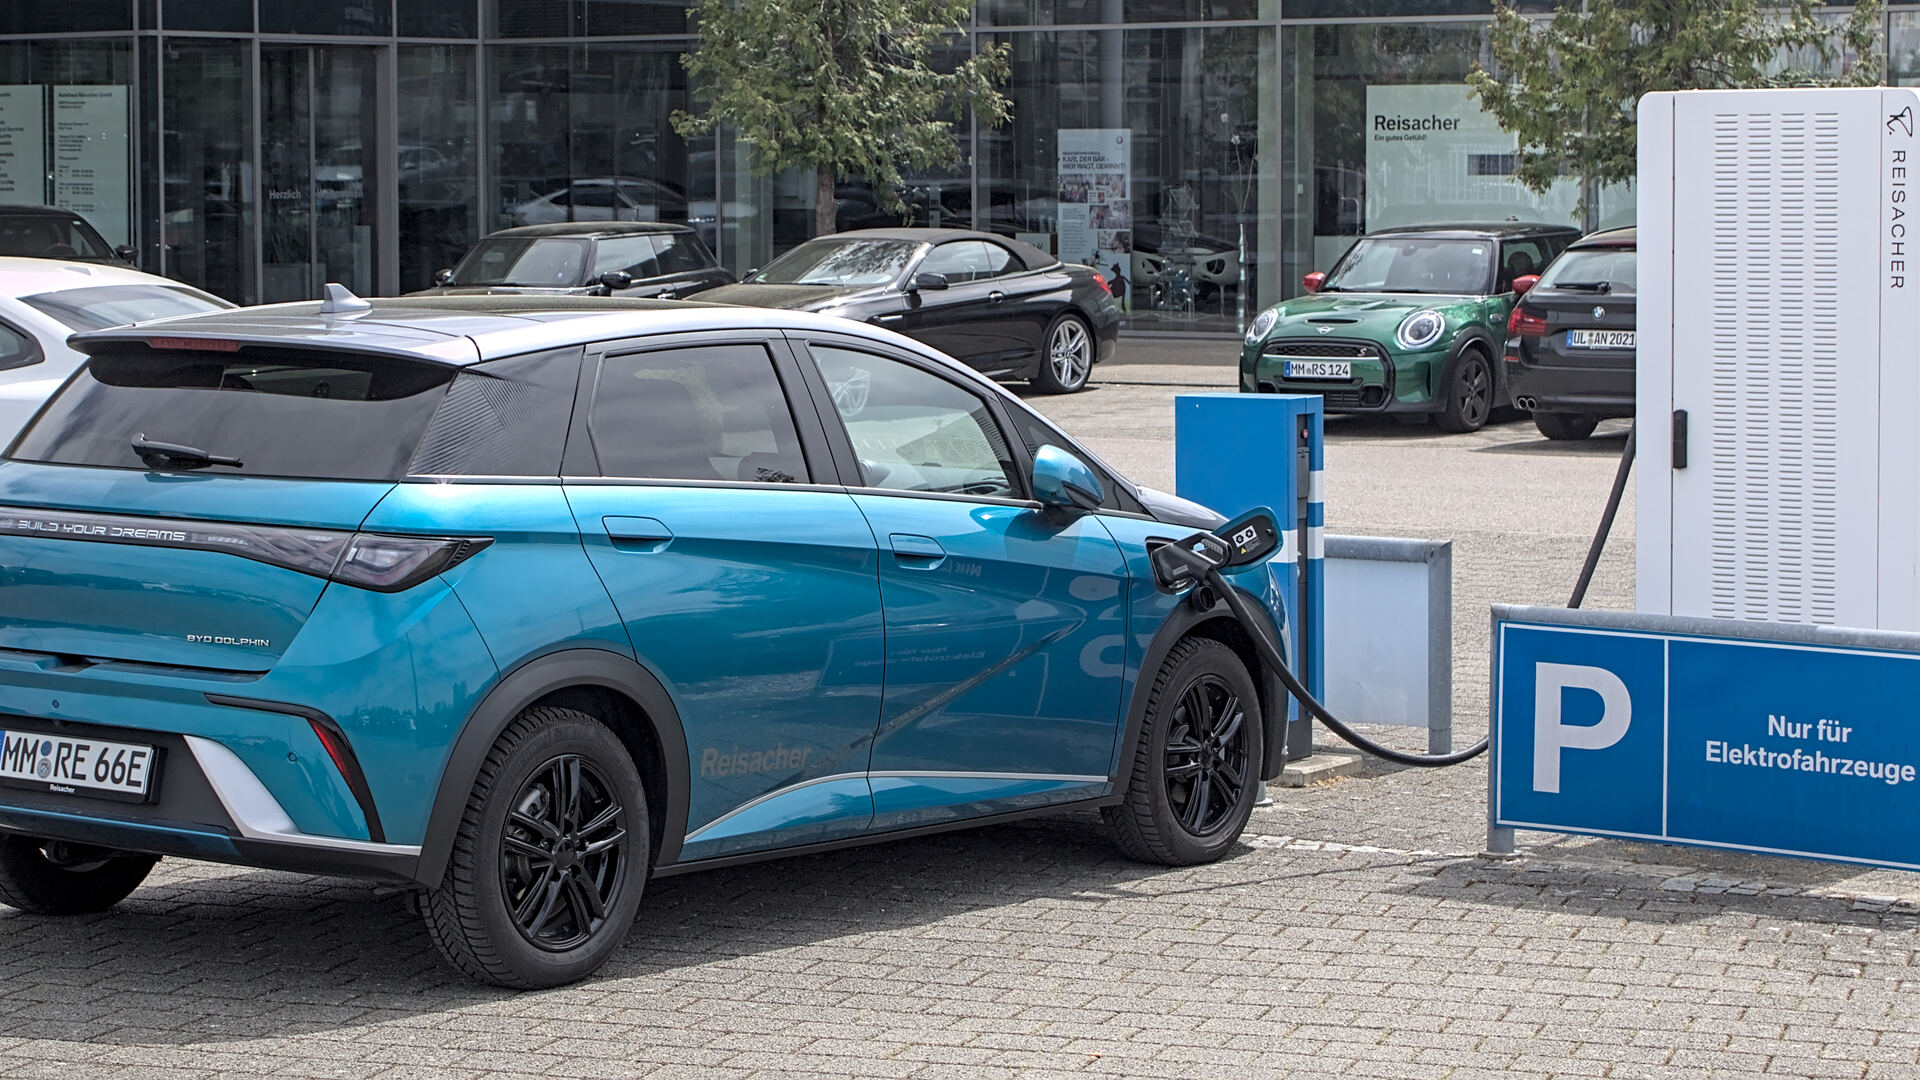
Cheap EVs can't replace Quebec's lost rebate before the year is out
Quebec's EV market crashed when its provincial rebate ended in January 2025. The first 2026 numbers are in, and matching last year's total by December would take almost triple the current sales pace, more than a revived federal rebate or a new quota on Chinese imports can deliver.
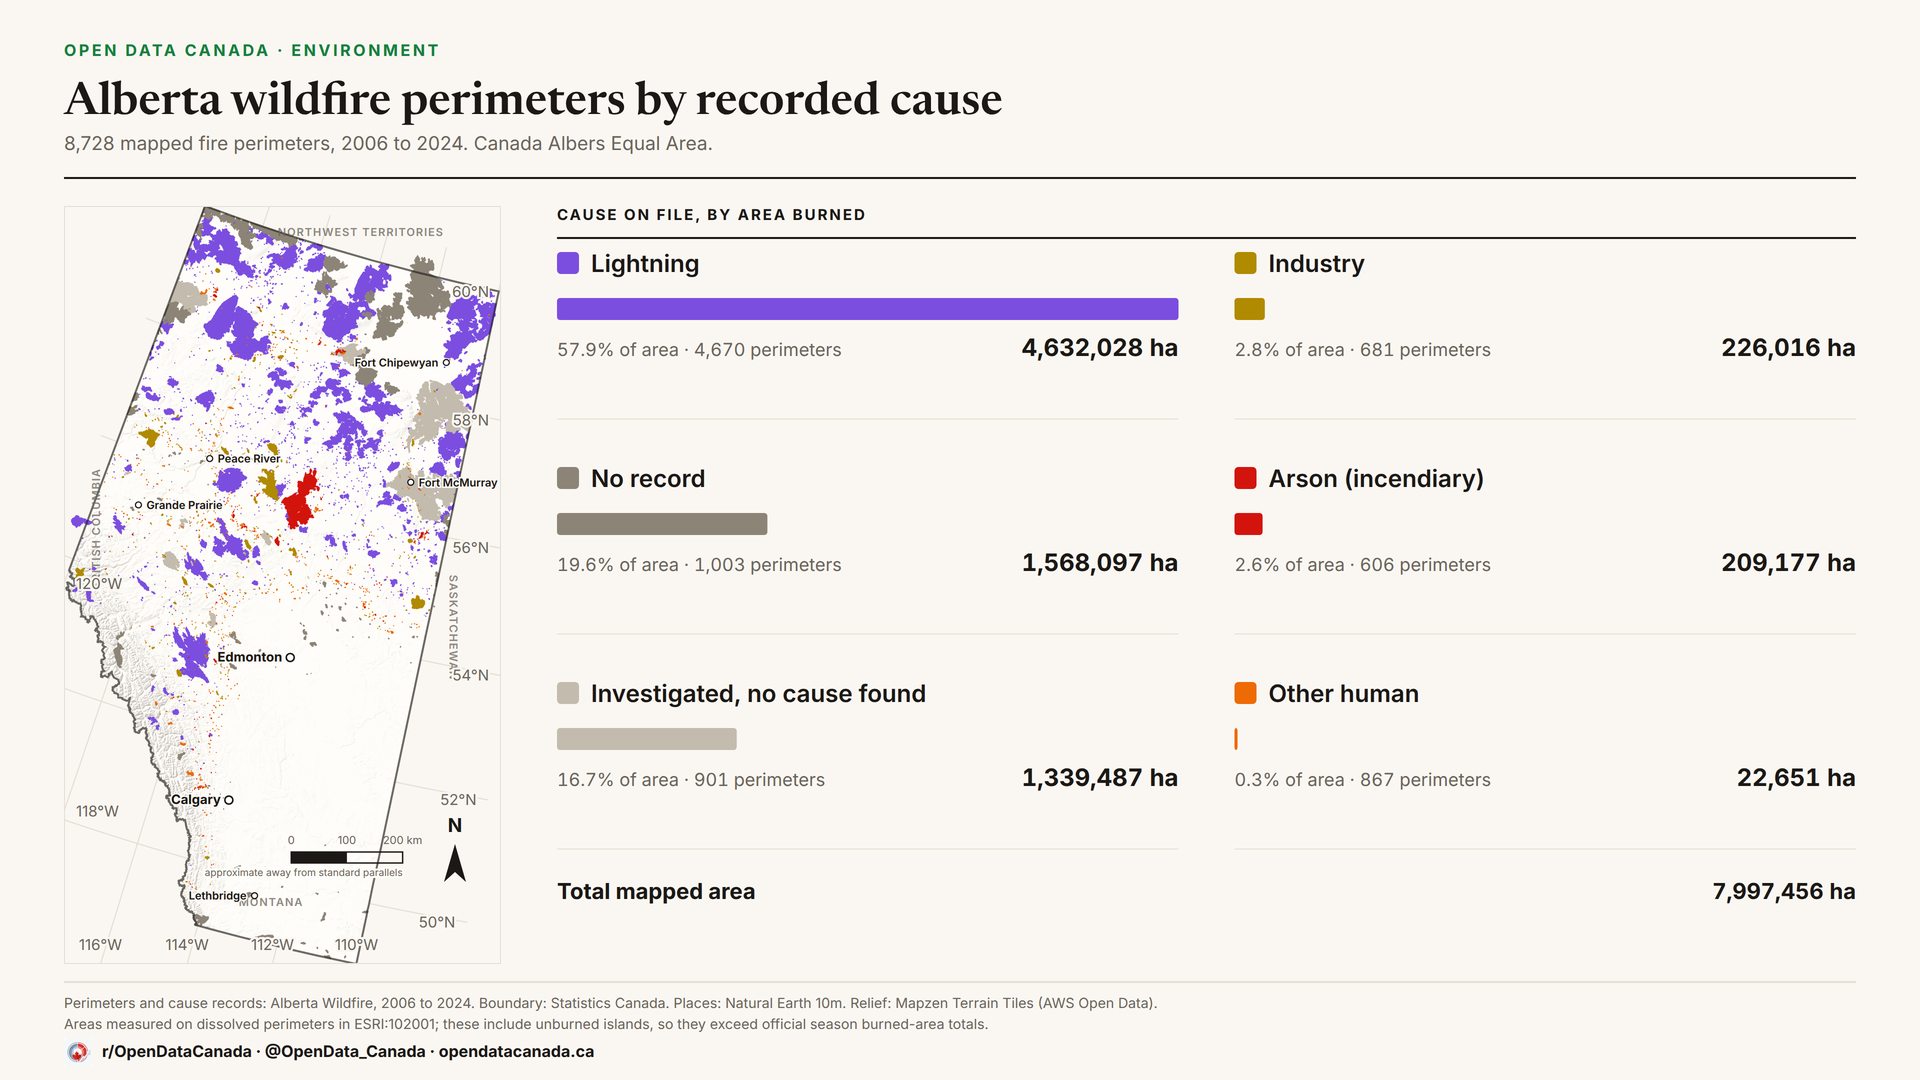
What Alberta's wildfire cause records actually show
You asked us for an arson versus lightning breakdown of the wildfires we mapped. Only Alberta publishes one. It shows arson is a rounding error by area, 95 per cent of it a single fire, and a fifth of what Alberta maps has no cause in the province's own file — though other governments hold one for almost all of it.
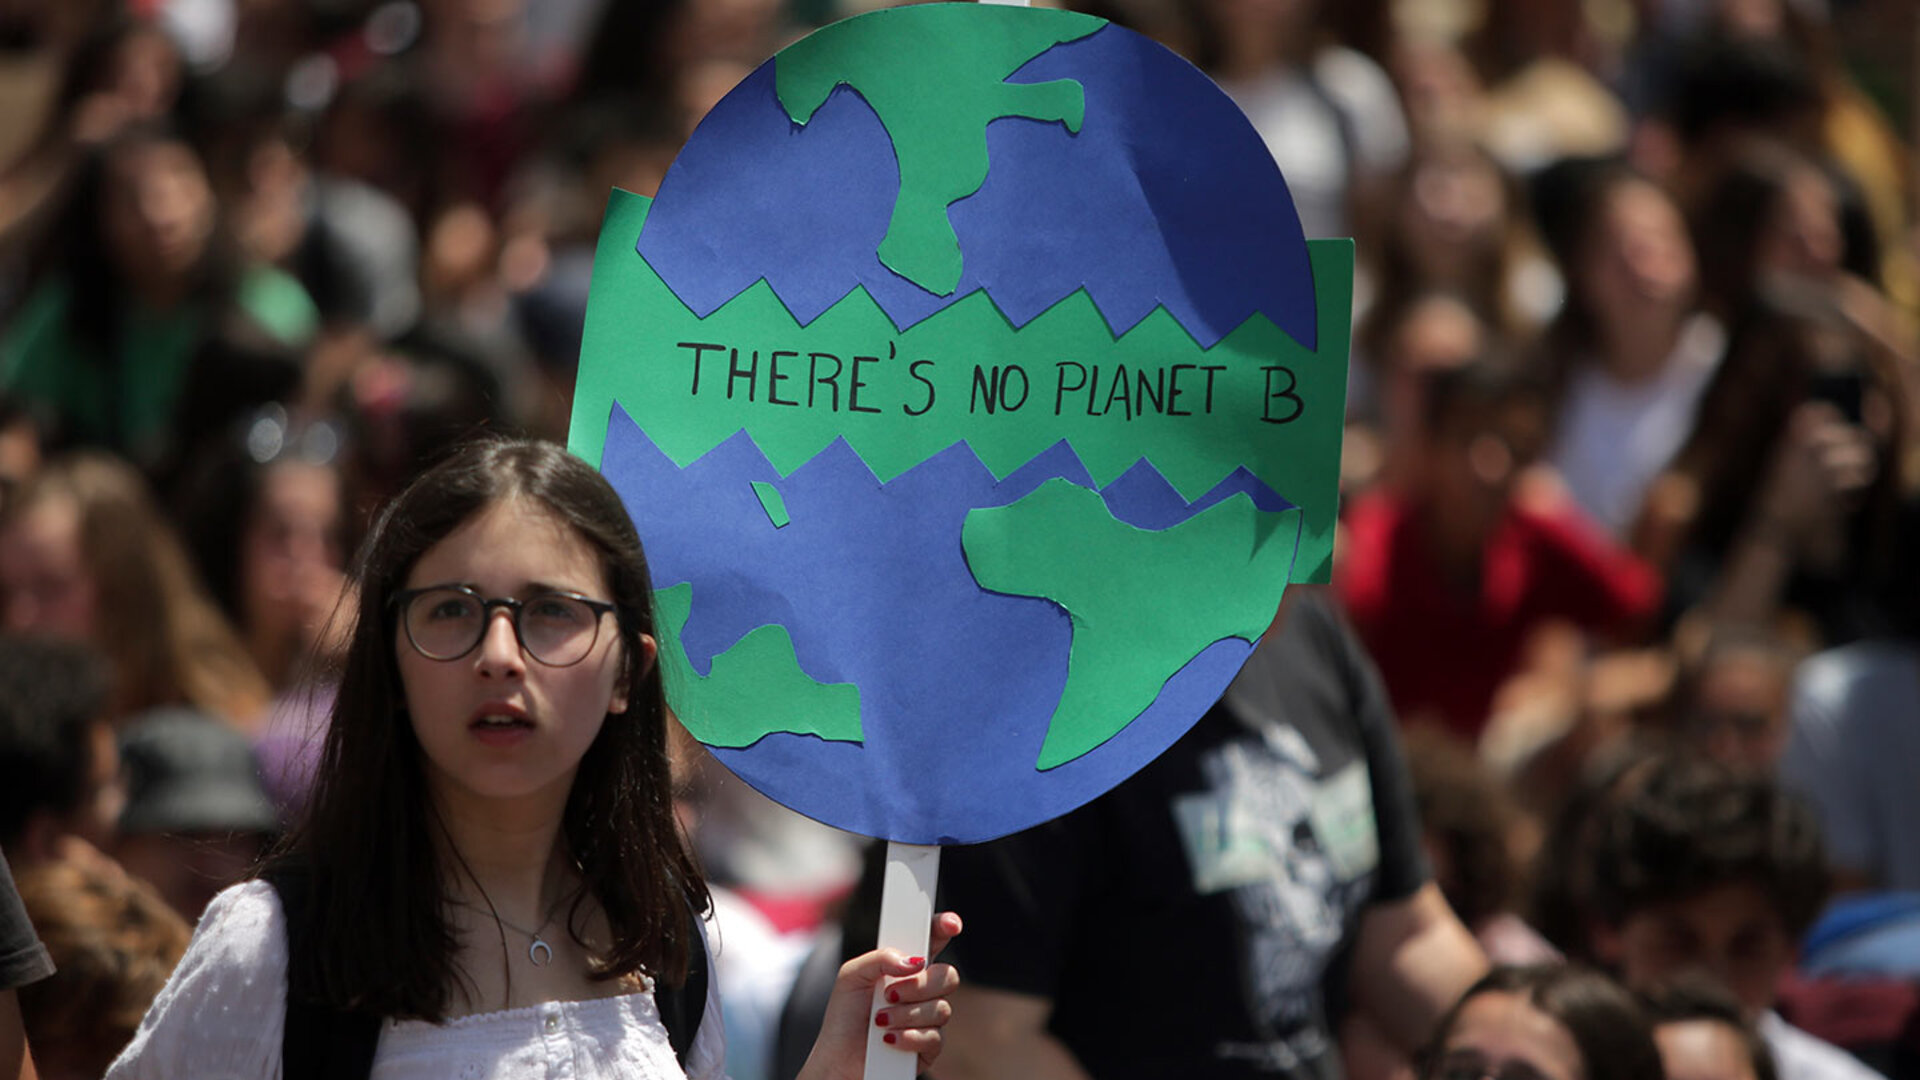
Seniors Are More Worried About Climate Change Than Gen Z
New StatCan survey data flips the usual climate-anxiety script. Canadians 65 and older report the highest concern of any age group, while 15-to-24-year-olds report the least.
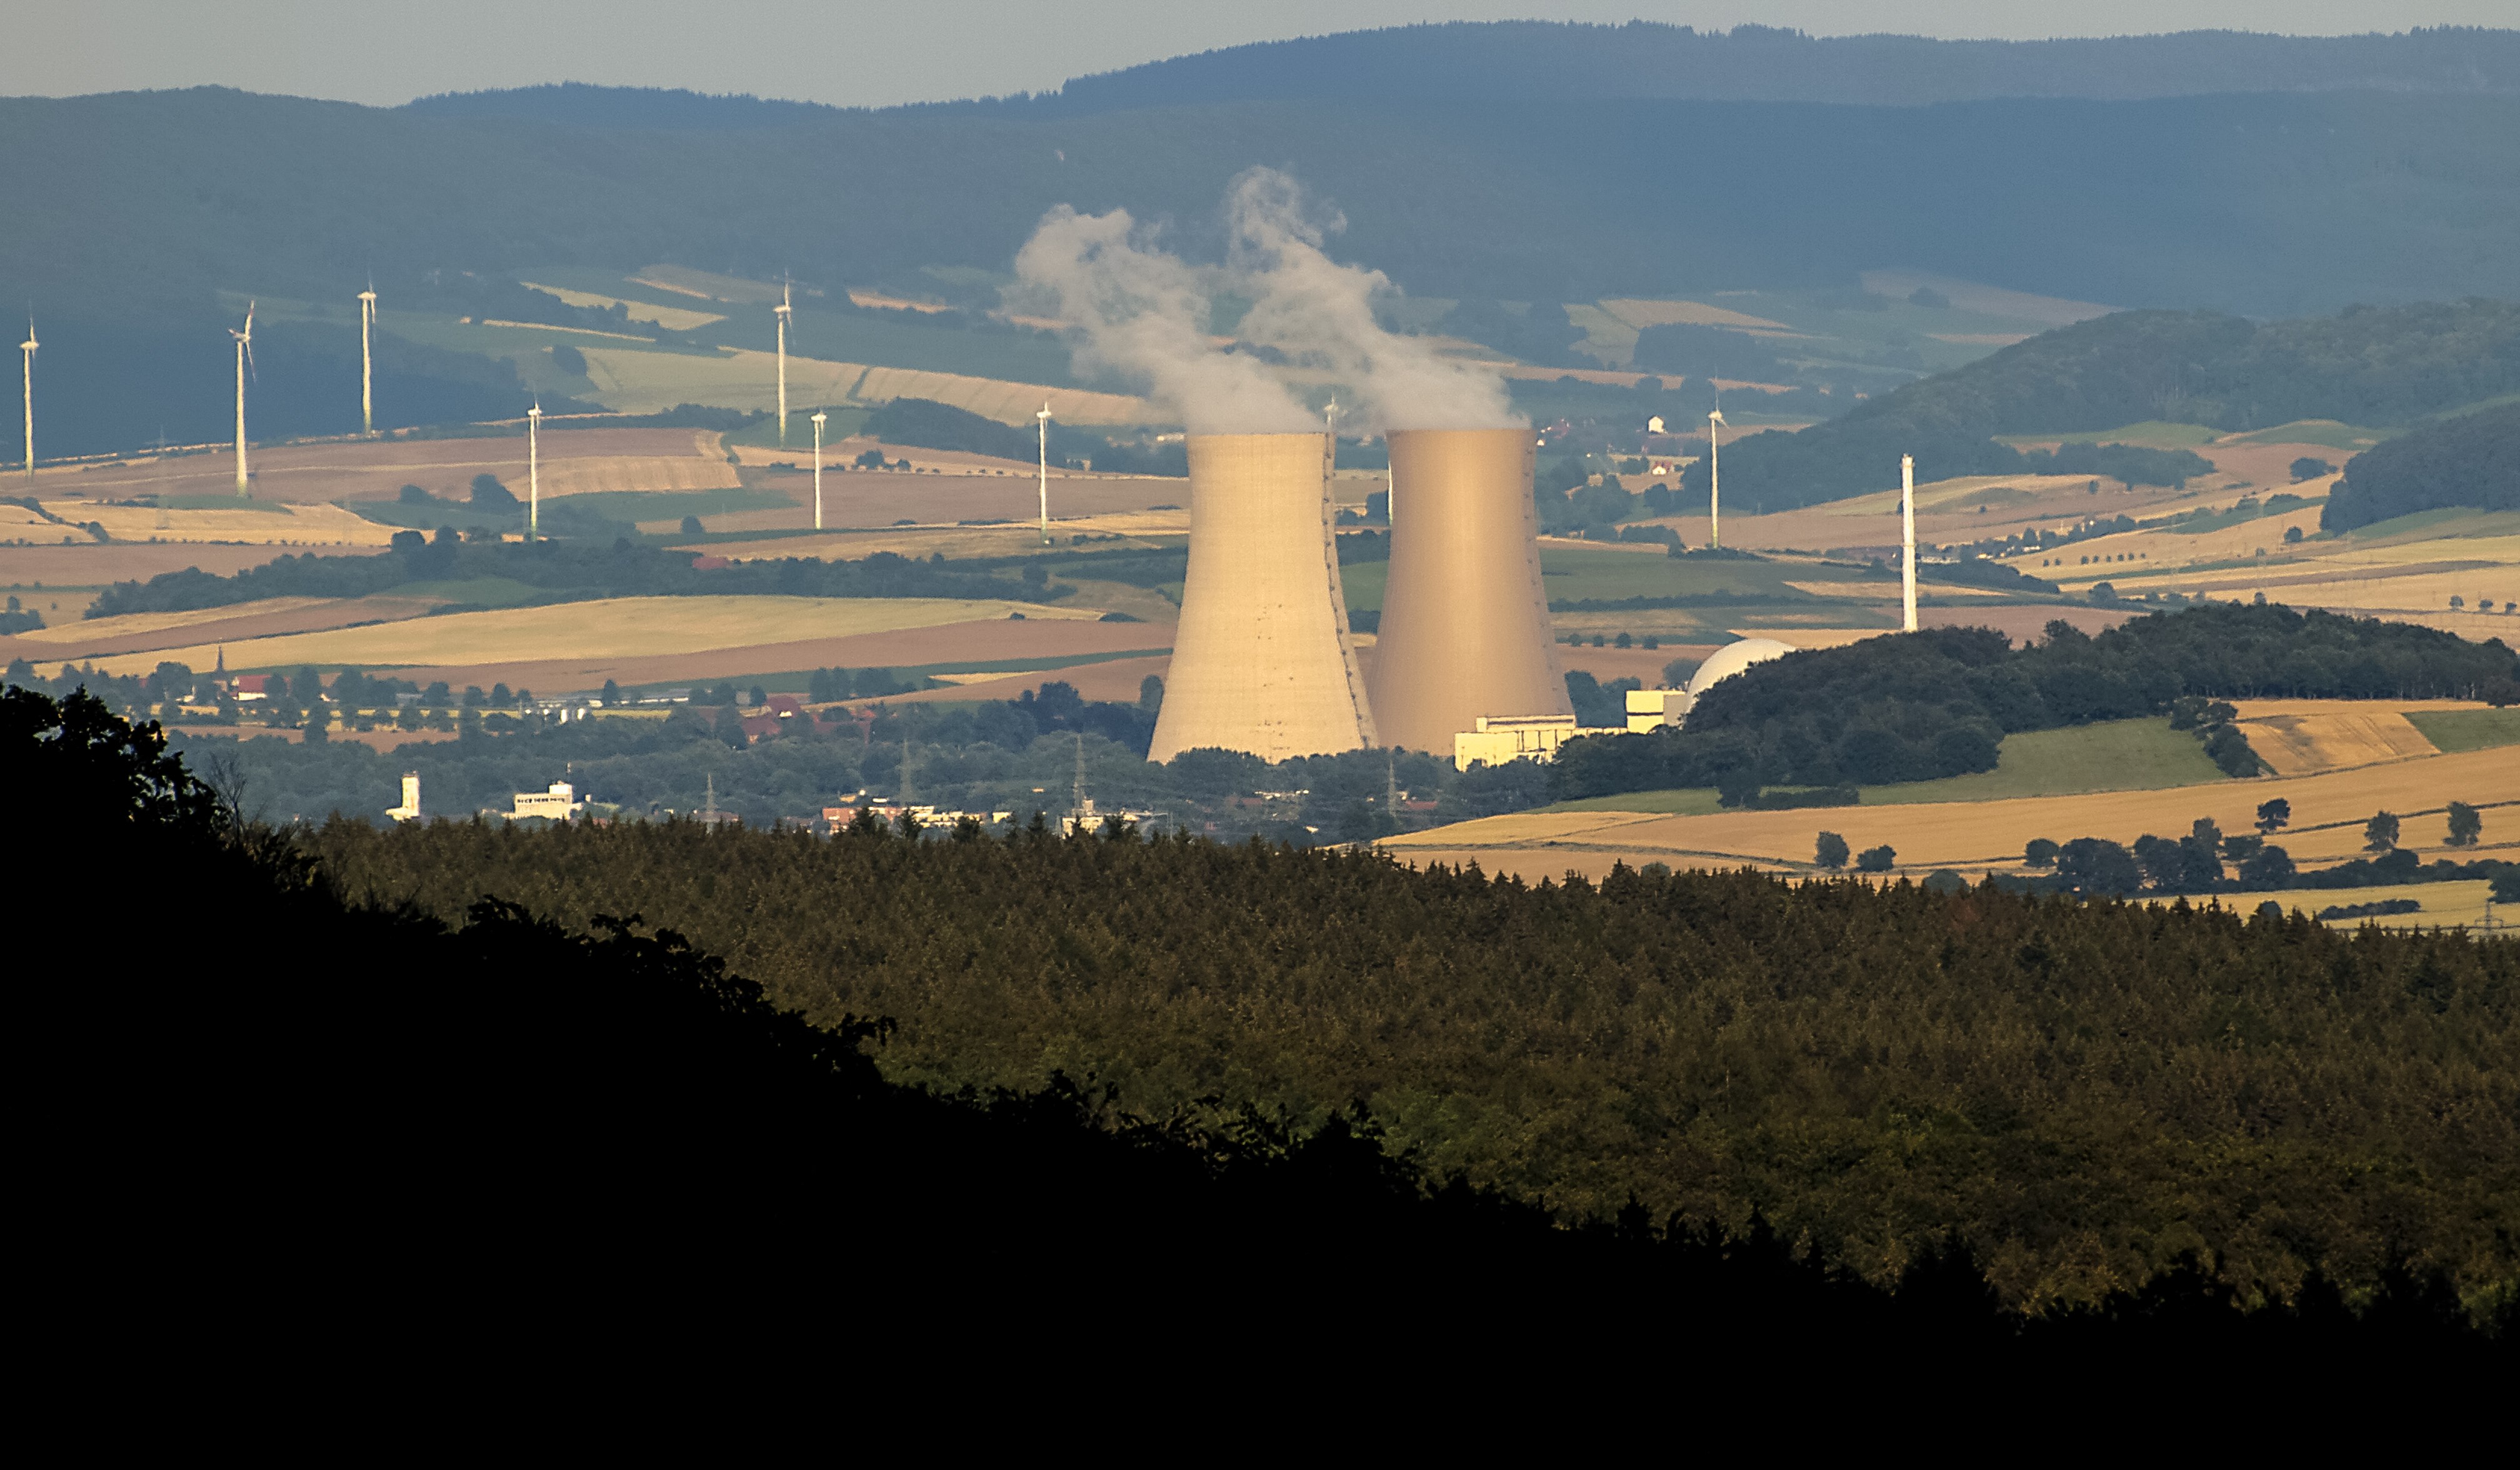
Canada's electricity grid in 2050, in one chart
The CER's net-zero scenario maps every technology from 2024 to 2050. Wind grows ninefold to become the biggest source of capacity, hydro stays roughly flat, gas keeps a smaller but real role, and nuclear stays modest. It is the regulator's modelling of one pathway to net-zero, not a forecast.
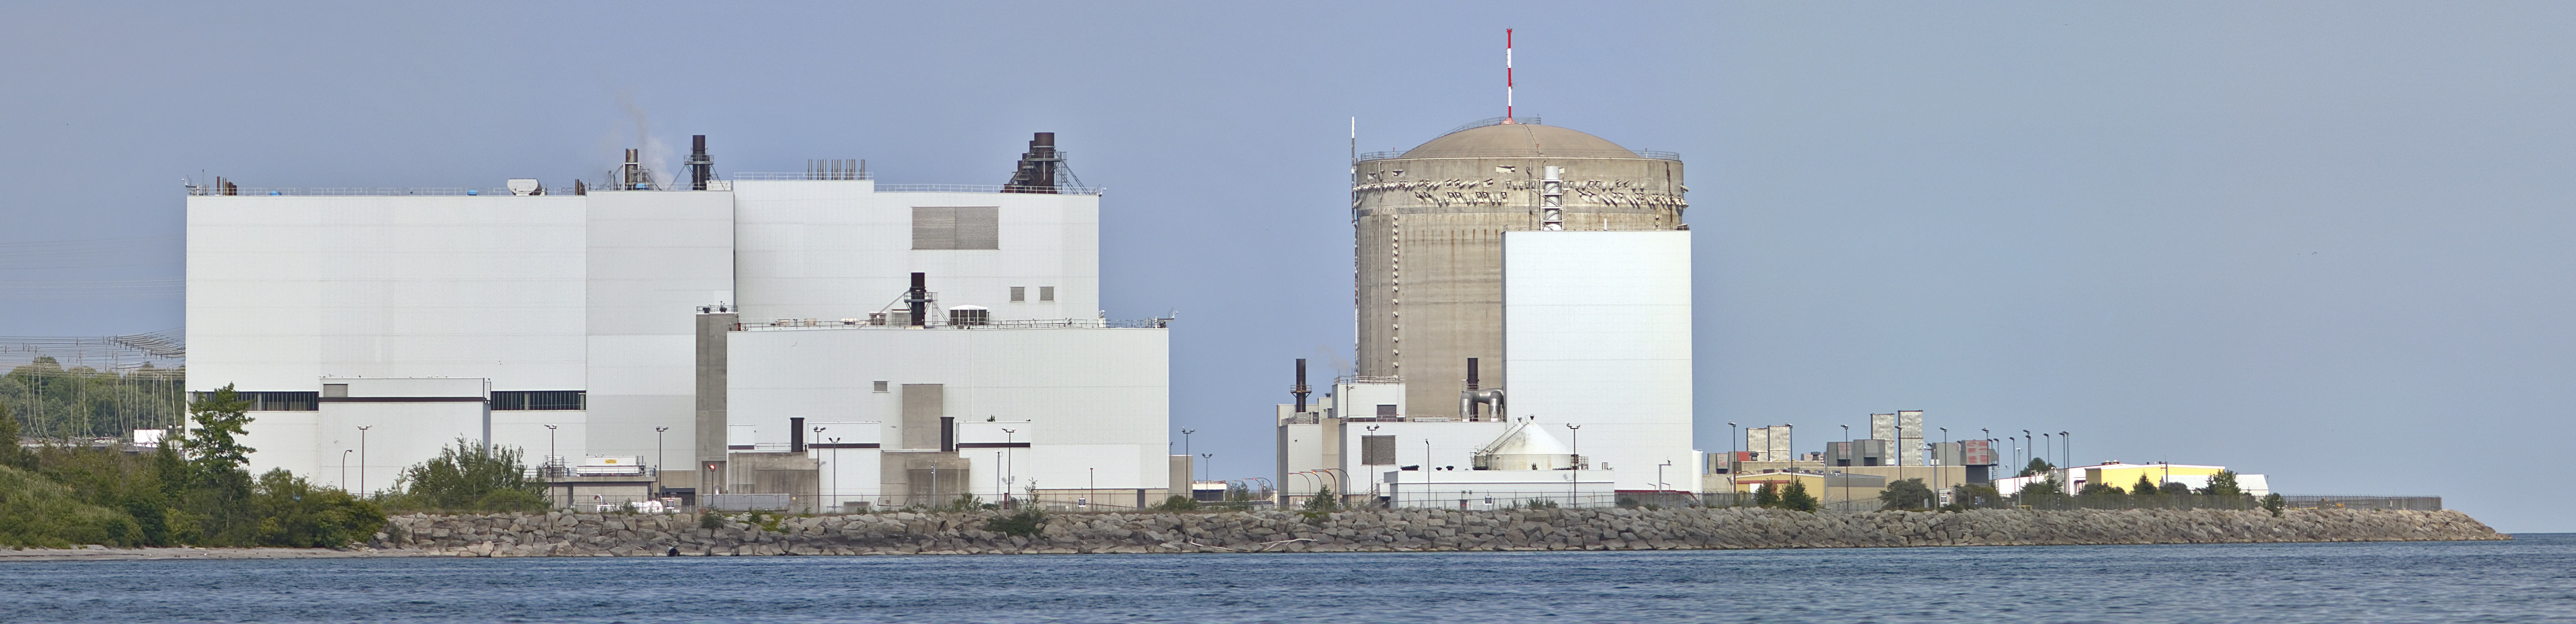
Canada's nuclear strategy is built on a number the regulator's own model doesn't deliver
Canada's new National Nuclear Energy Strategy promises to supercharge atomic power. The regulator's own net-zero model hands nuclear 5 percent of new capacity through 2050 — and assigns wind 62 percent. Ontario alone faces a potential 14.6 GW nuclear delivery gap by midcentury.
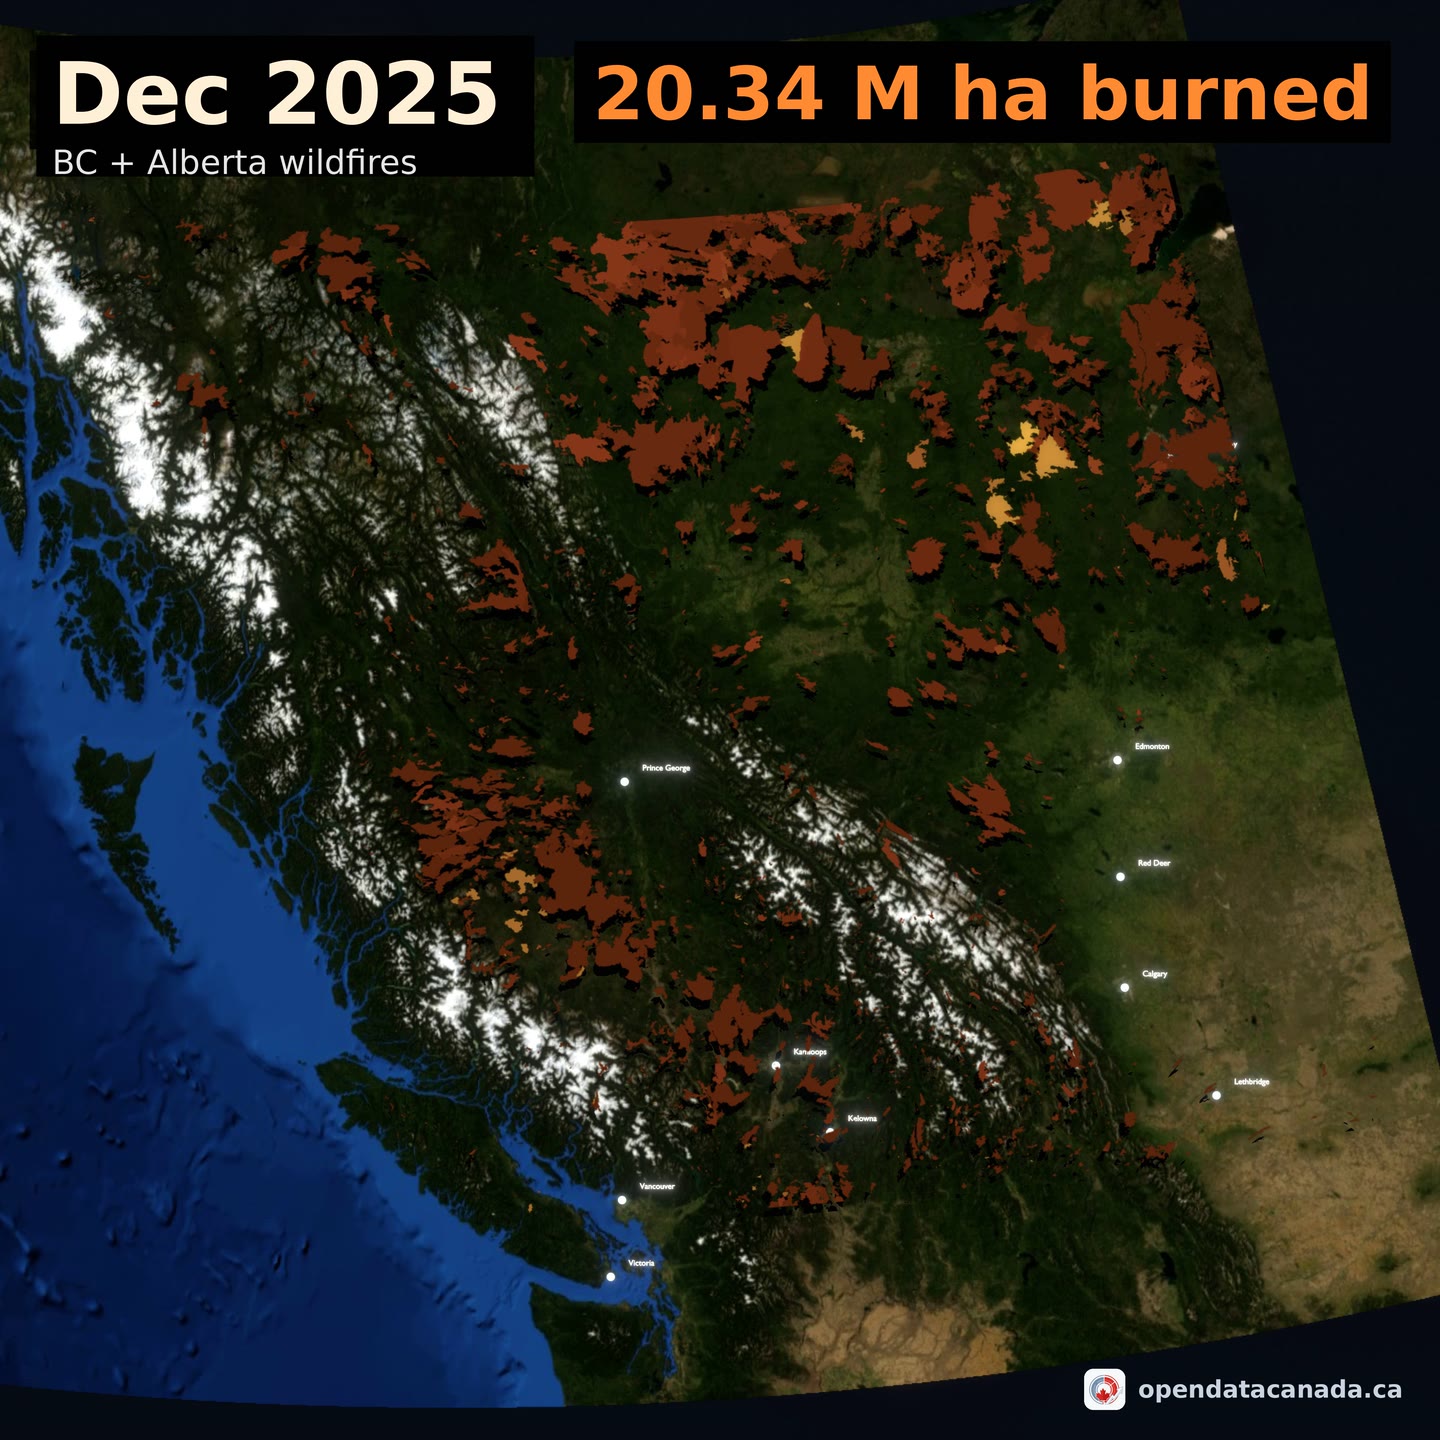
An area larger than England has burned in BC and Alberta since 2000
Every mapped fire perimeter in British Columbia and Alberta, animated month by month over 26 years. Most of the burning happened in the last six. What the acceleration means for carbon, water, communities and insurance.
26 years of BC and Alberta wildfires, animated
20.34 M hectares burned since 2000, and 55% of it in the last six years. 2023 alone added 6.47 M ha — just under a third of the entire 26-year record, in a single season.
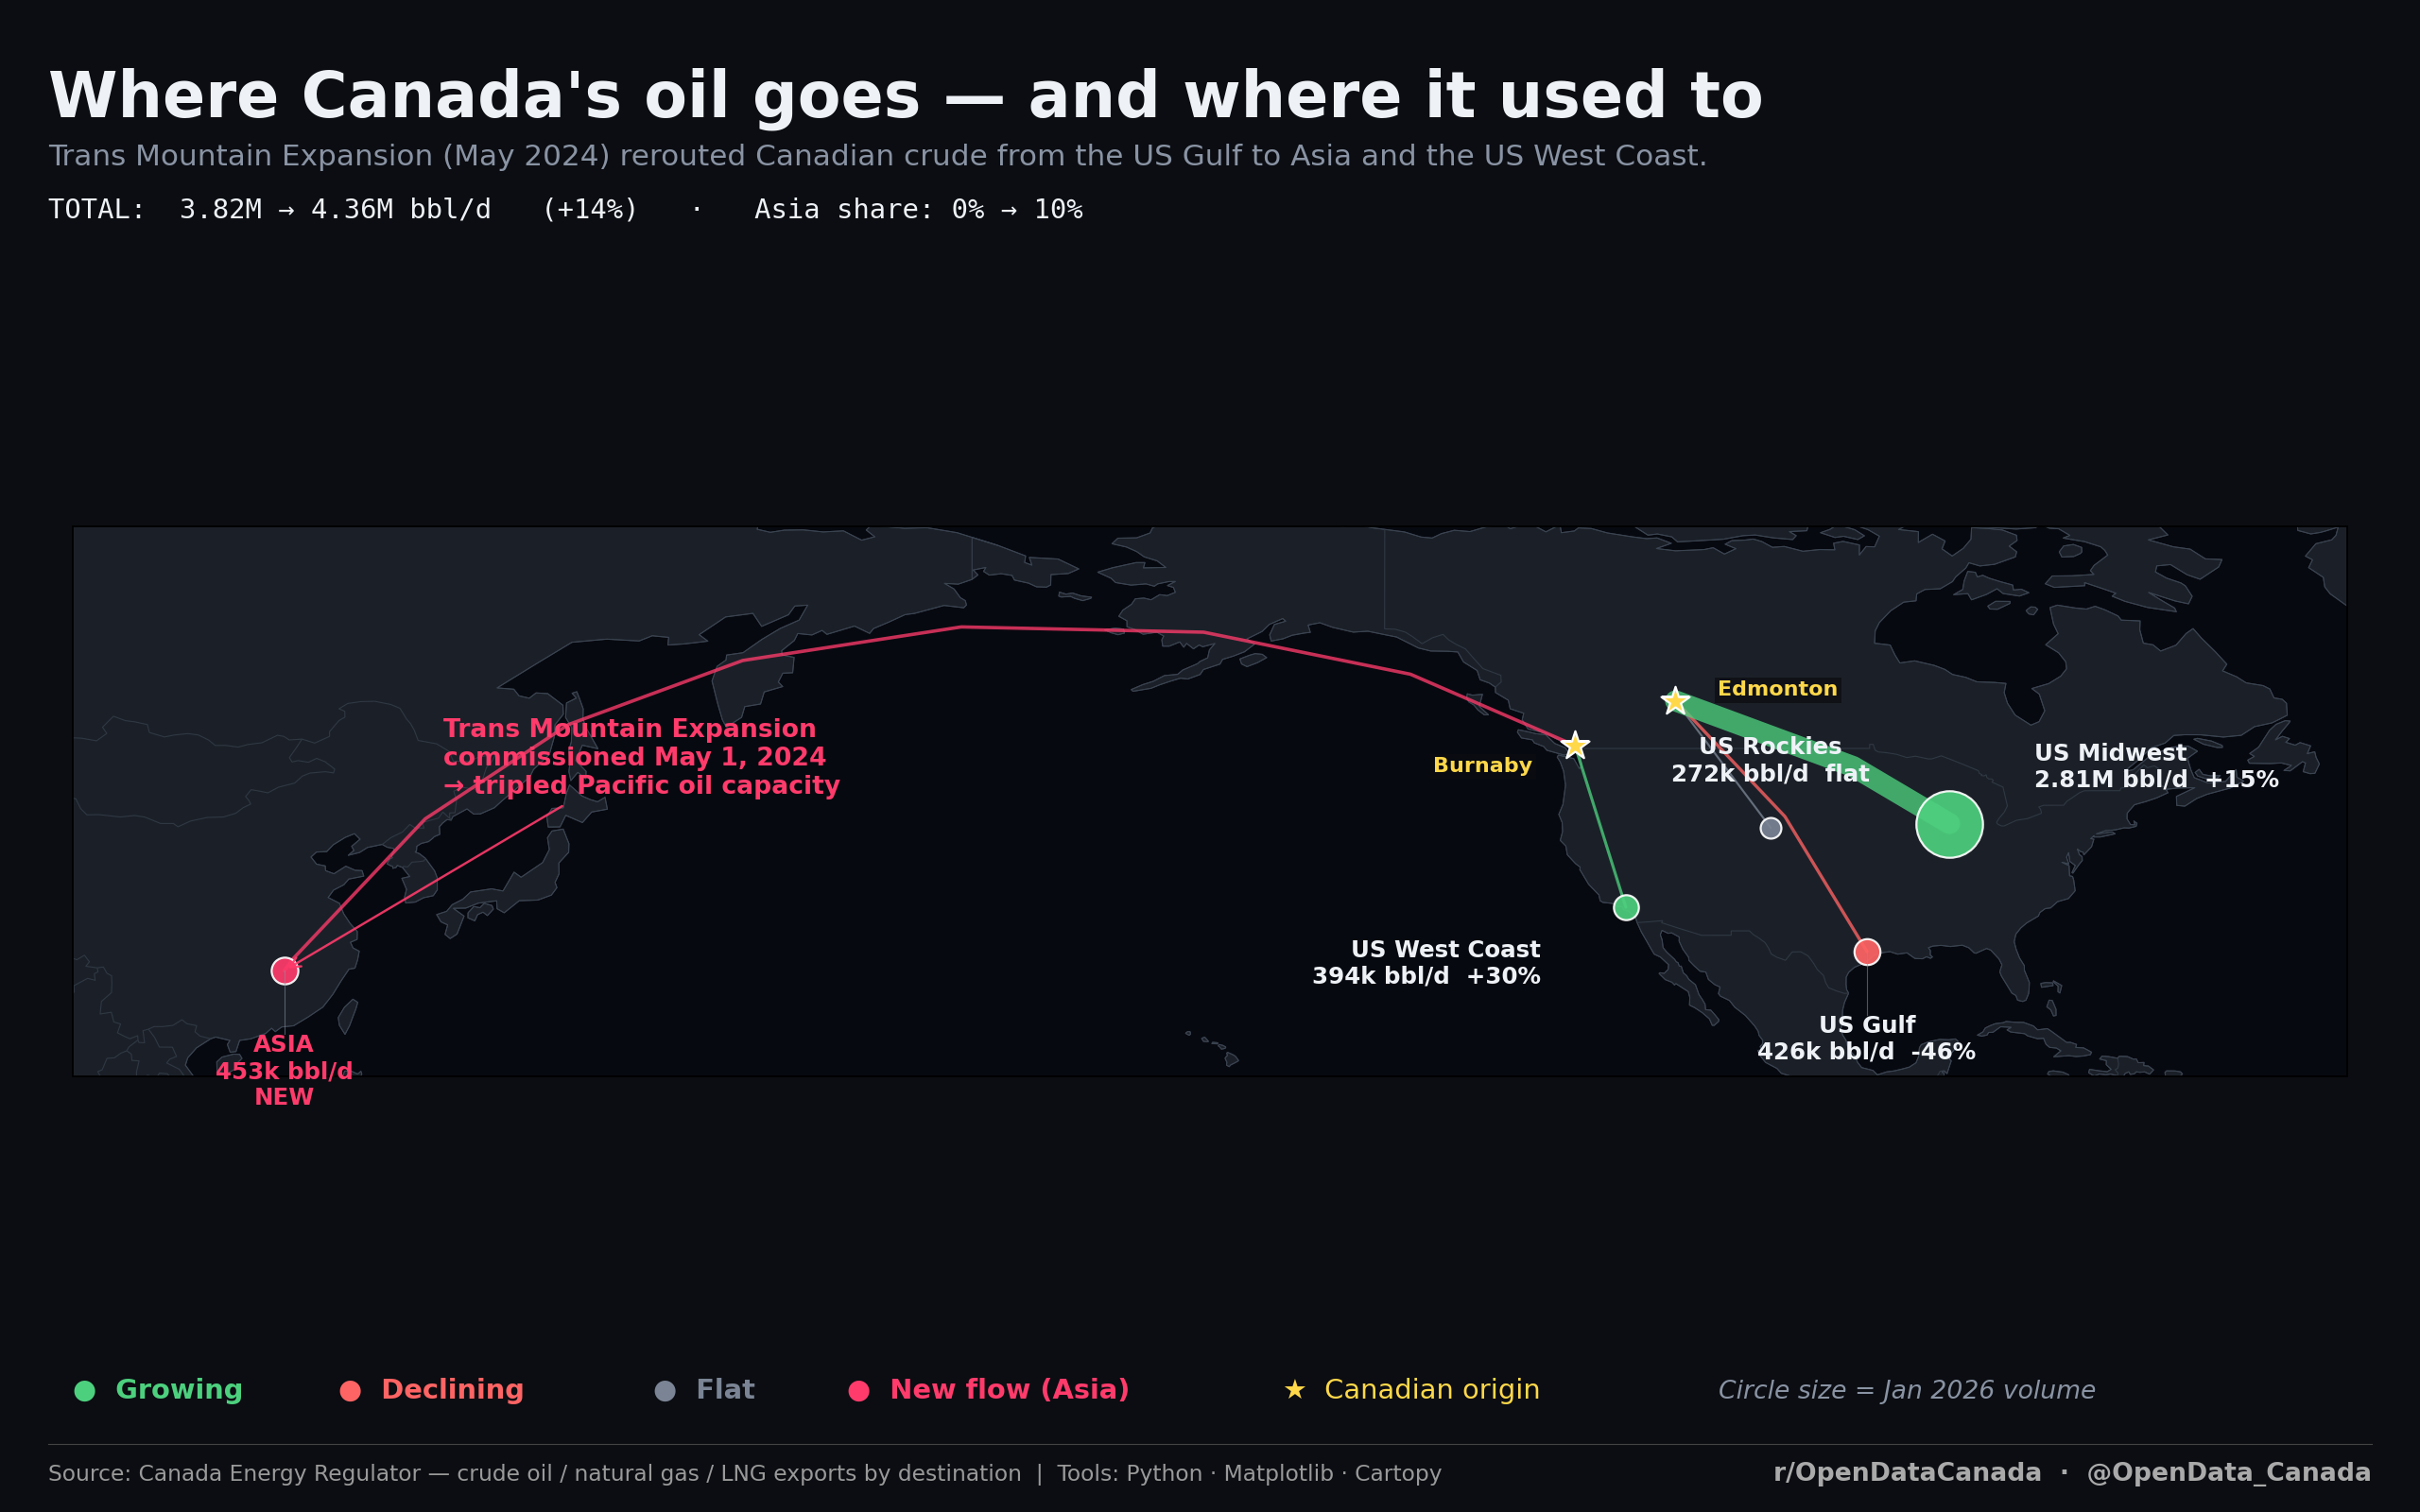
Where Canada's oil goes — and where it used to
The Trans Mountain Expansion (May 2024) tripled Pacific oil capacity. Asia's share of Canadian crude exports moved from 0 % to 10 %. US Gulf-bound flows fell 46 % as barrels were redirected west.