Energy · Trade · Chart
Trans Mountain Expansion (May 2024) tripled Pacific oil capacity
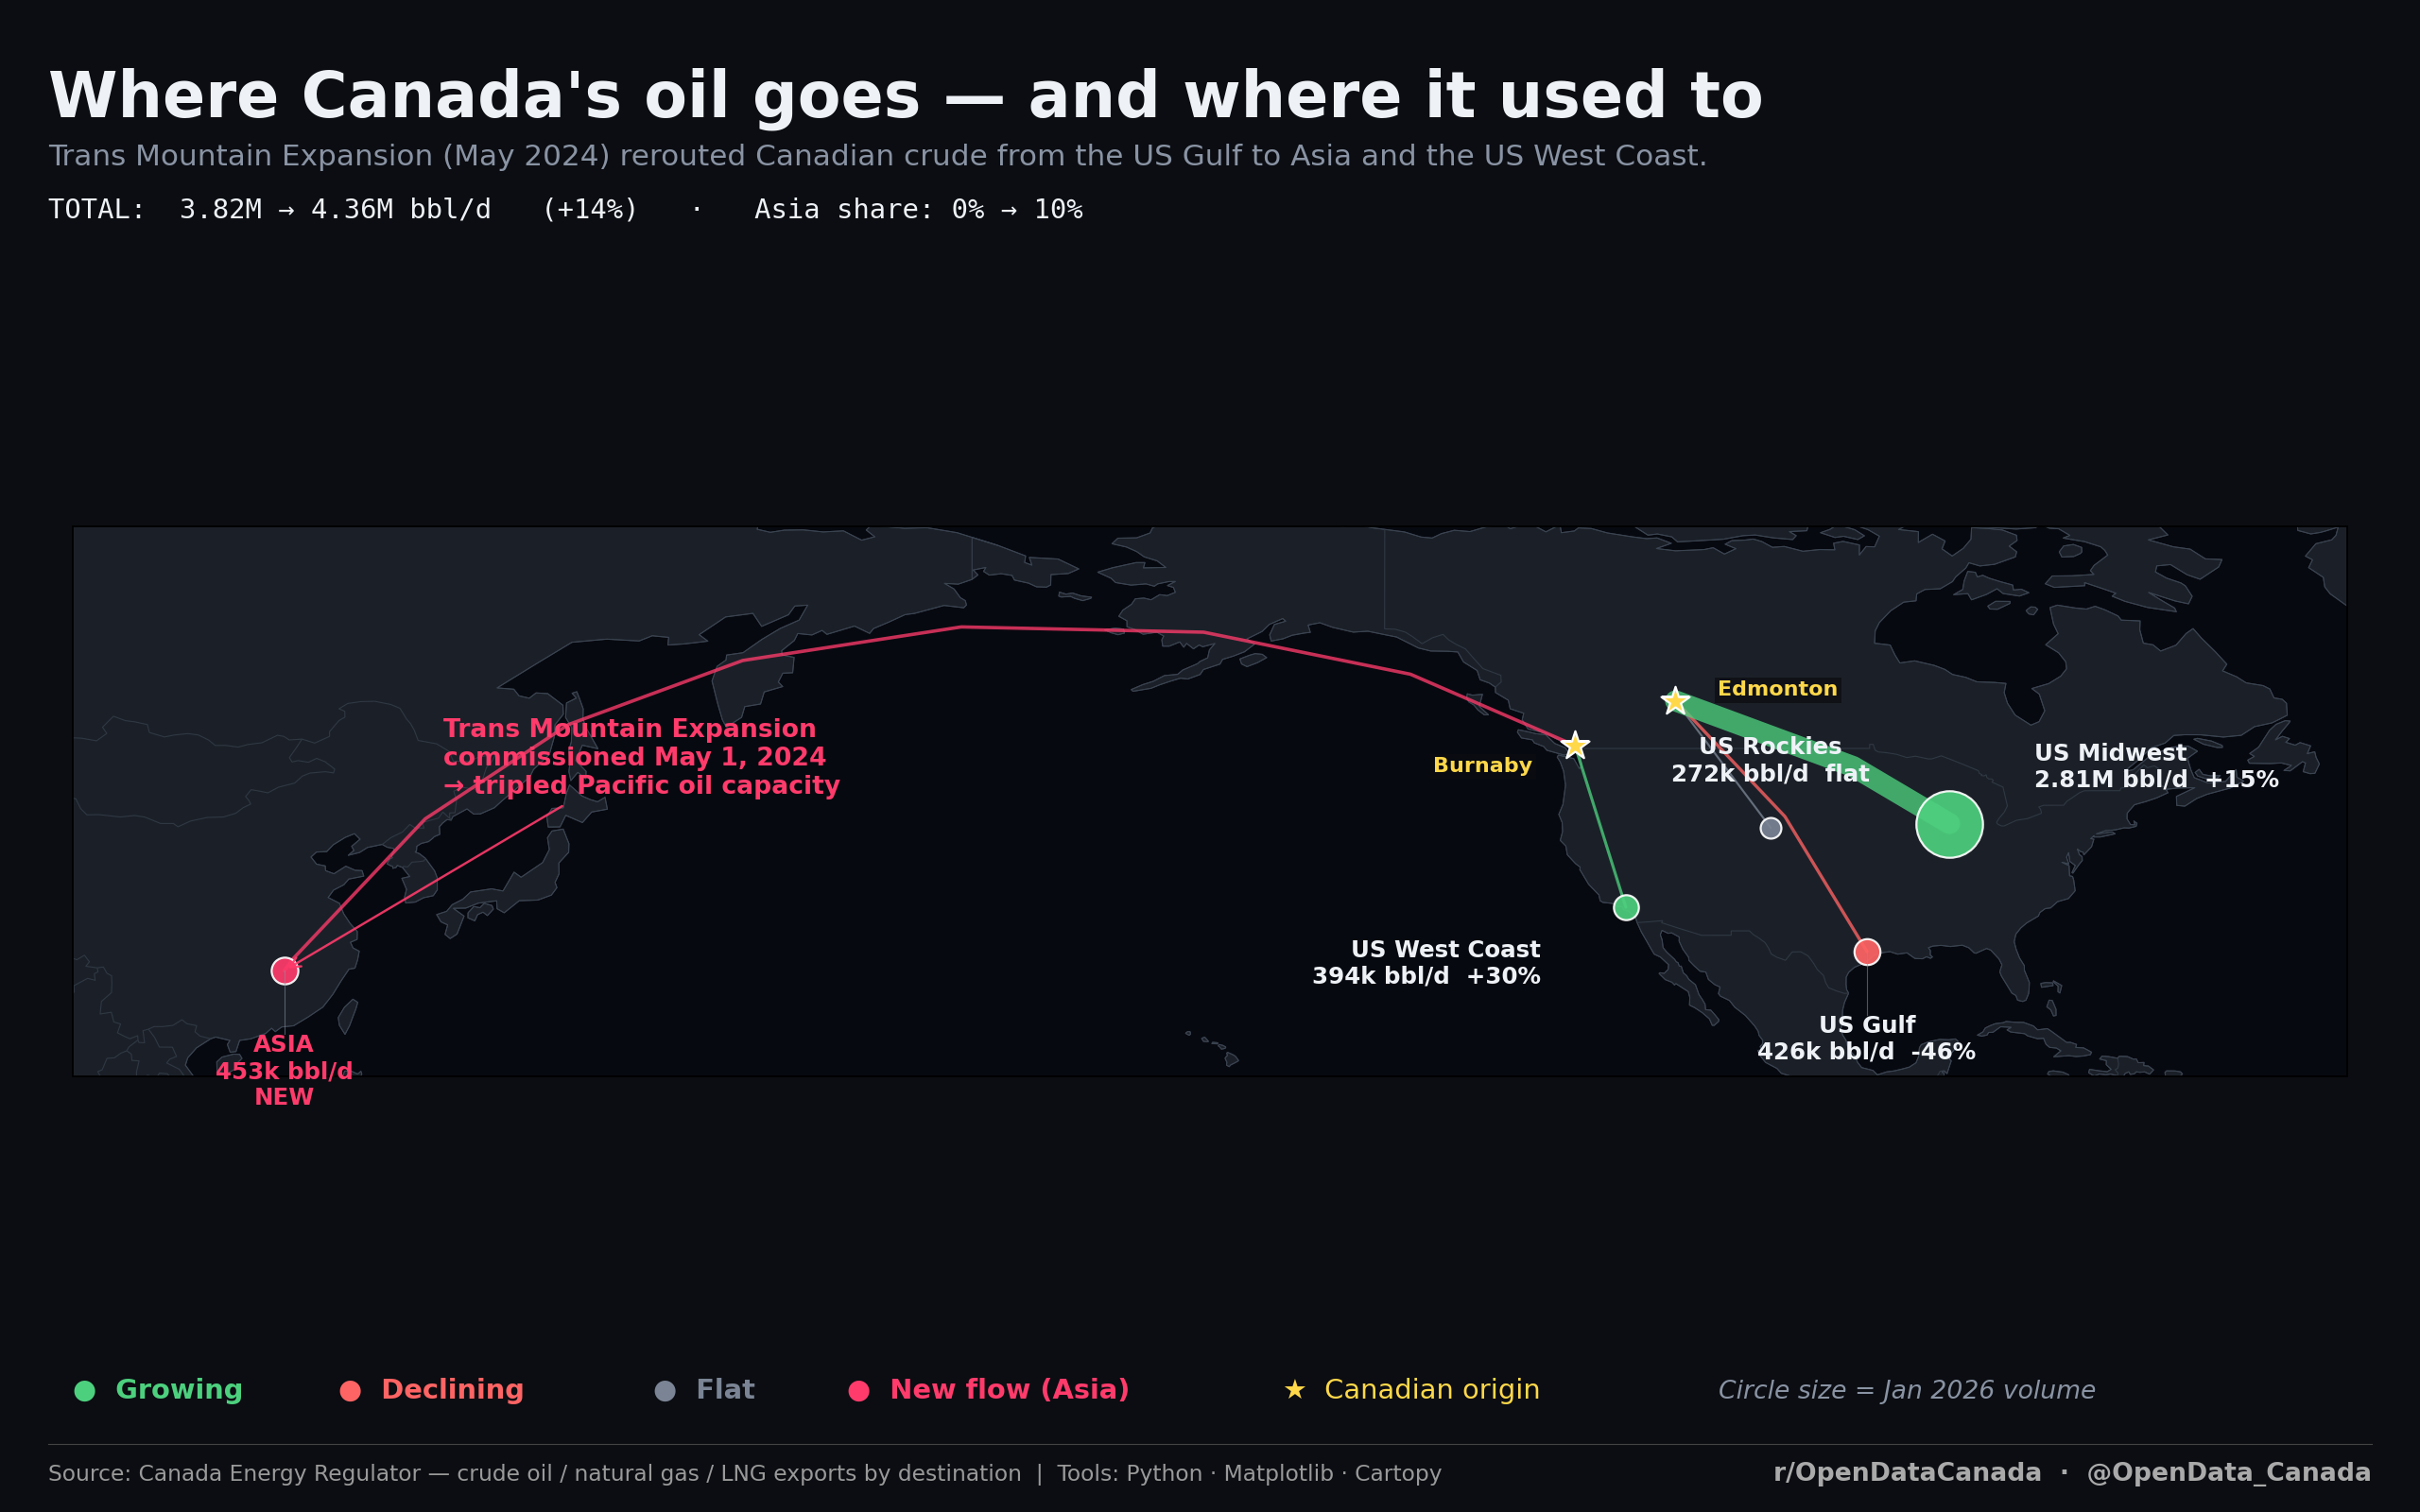
Total Canadian crude exports rose from 3.82 million barrels per day to 4.36 million bbl/d (+14 %) after the Trans Mountain Expansion was commissioned in May 2024. Asia's share moved from 0 % to 10 %. The biggest single shift inside the US: a 46 % decline in Gulf Coast deliveries as Pacific routes opened.
What the chart shows
The map plots Canadian crude oil export flows by destination region, before and after the May 2024 Trans Mountain Expansion (TMX) came online. Each circle is sized by January 2026 volume; colour codes show whether the flow is growing, declining, flat, or new.
| Destination | Volume (Jan 2026, bbl/d) | Year-over-year change |
|---|---|---|
| US Midwest | 2.81 M | +15 % (growing) |
| Asia | 453 k | NEW (was 0) |
| US Gulf | 426 k | −46 % (declining) |
| US West Coast | 394 k | +30 % (growing) |
| US Rockies | 272 k | flat |
Two flows tell the story:
- The Trans Mountain Expansion runs from Edmonton to the Westridge Marine Terminal in Burnaby, BC. It tripled the existing TMX line's capacity, opening a credible Pacific export route for the first time since the 1950s. The 453 k bbl/d Asia flow did not exist a year earlier.
- The US Gulf decline (−46 %) is the corresponding subtraction. With Pacific tanker capacity now available, barrels that previously had to flow south through the US Midwest and onward to refineries on the Gulf Coast are now flowing west instead. Same barrel, different buyer.
The total flow rose by 14 % (3.82 M → 4.36 M bbl/d), so this is not a pure substitution — there is real new export volume — but a meaningful share of the year-over-year change is a redirection rather than an addition.
Why this matters
Three implications, each independently verifiable from upstream data:
- The single-customer-dependence headline (95.6 % to the US) is now starting to ease. The 2023 share was approximately 99 %. The 2024–25 share is 95.6 %. This is the first material drop in two decades.
- Asian buyers are price-takers, not price-setters, for these volumes. The TMX-routed crude is a marginal supply to the Asian market, not a structural source. Pricing for these cargoes follows Brent-linked Asian benchmarks rather than the West Texas Intermediate–Western Canadian Select differential that dominates US-bound flows.
- The Gulf-to-Pacific reroute is partly netback-driven. When pipeline tolls, marine freight, and grade differentials are stacked, west-coast Asian sales can produce a higher netback to the producer than US Gulf sales for the same barrel. This is a quiet structural shift in producer economics that does not show up in the headline price.
What the chart can't tell you
The chart is a snapshot, not a trend. The Asian share is currently around 10 % of total exports; whether it grows further depends on three factors not visible in the data:
- TMX capacity utilisation. The line is currently running at approximately 75–80 % of nameplate. Higher utilisation is achievable but requires shippers to commit to firm contracts, which most are reluctant to do at current rates.
- Refinery configuration changes in Asia. Heavy Canadian crude requires deep-conversion refineries with coker capacity. Most Asian refineries can process limited volumes; expansion plans exist in China and India but are years out.
- Future pipeline projects. No new mainline projects are currently in advanced regulatory review. Energy East was cancelled in 2017; Northern Gateway in 2016. The current TMX expansion is the only material new capacity in the visible pipeline (no pun intended).
A follow-up chart on TMX utilisation by quarter, and a separate one on per-barrel netback by destination, are both on the explainer backlog.
Read next