Housing · Chart
15.3 % delivered, 33 % of the timeline elapsed
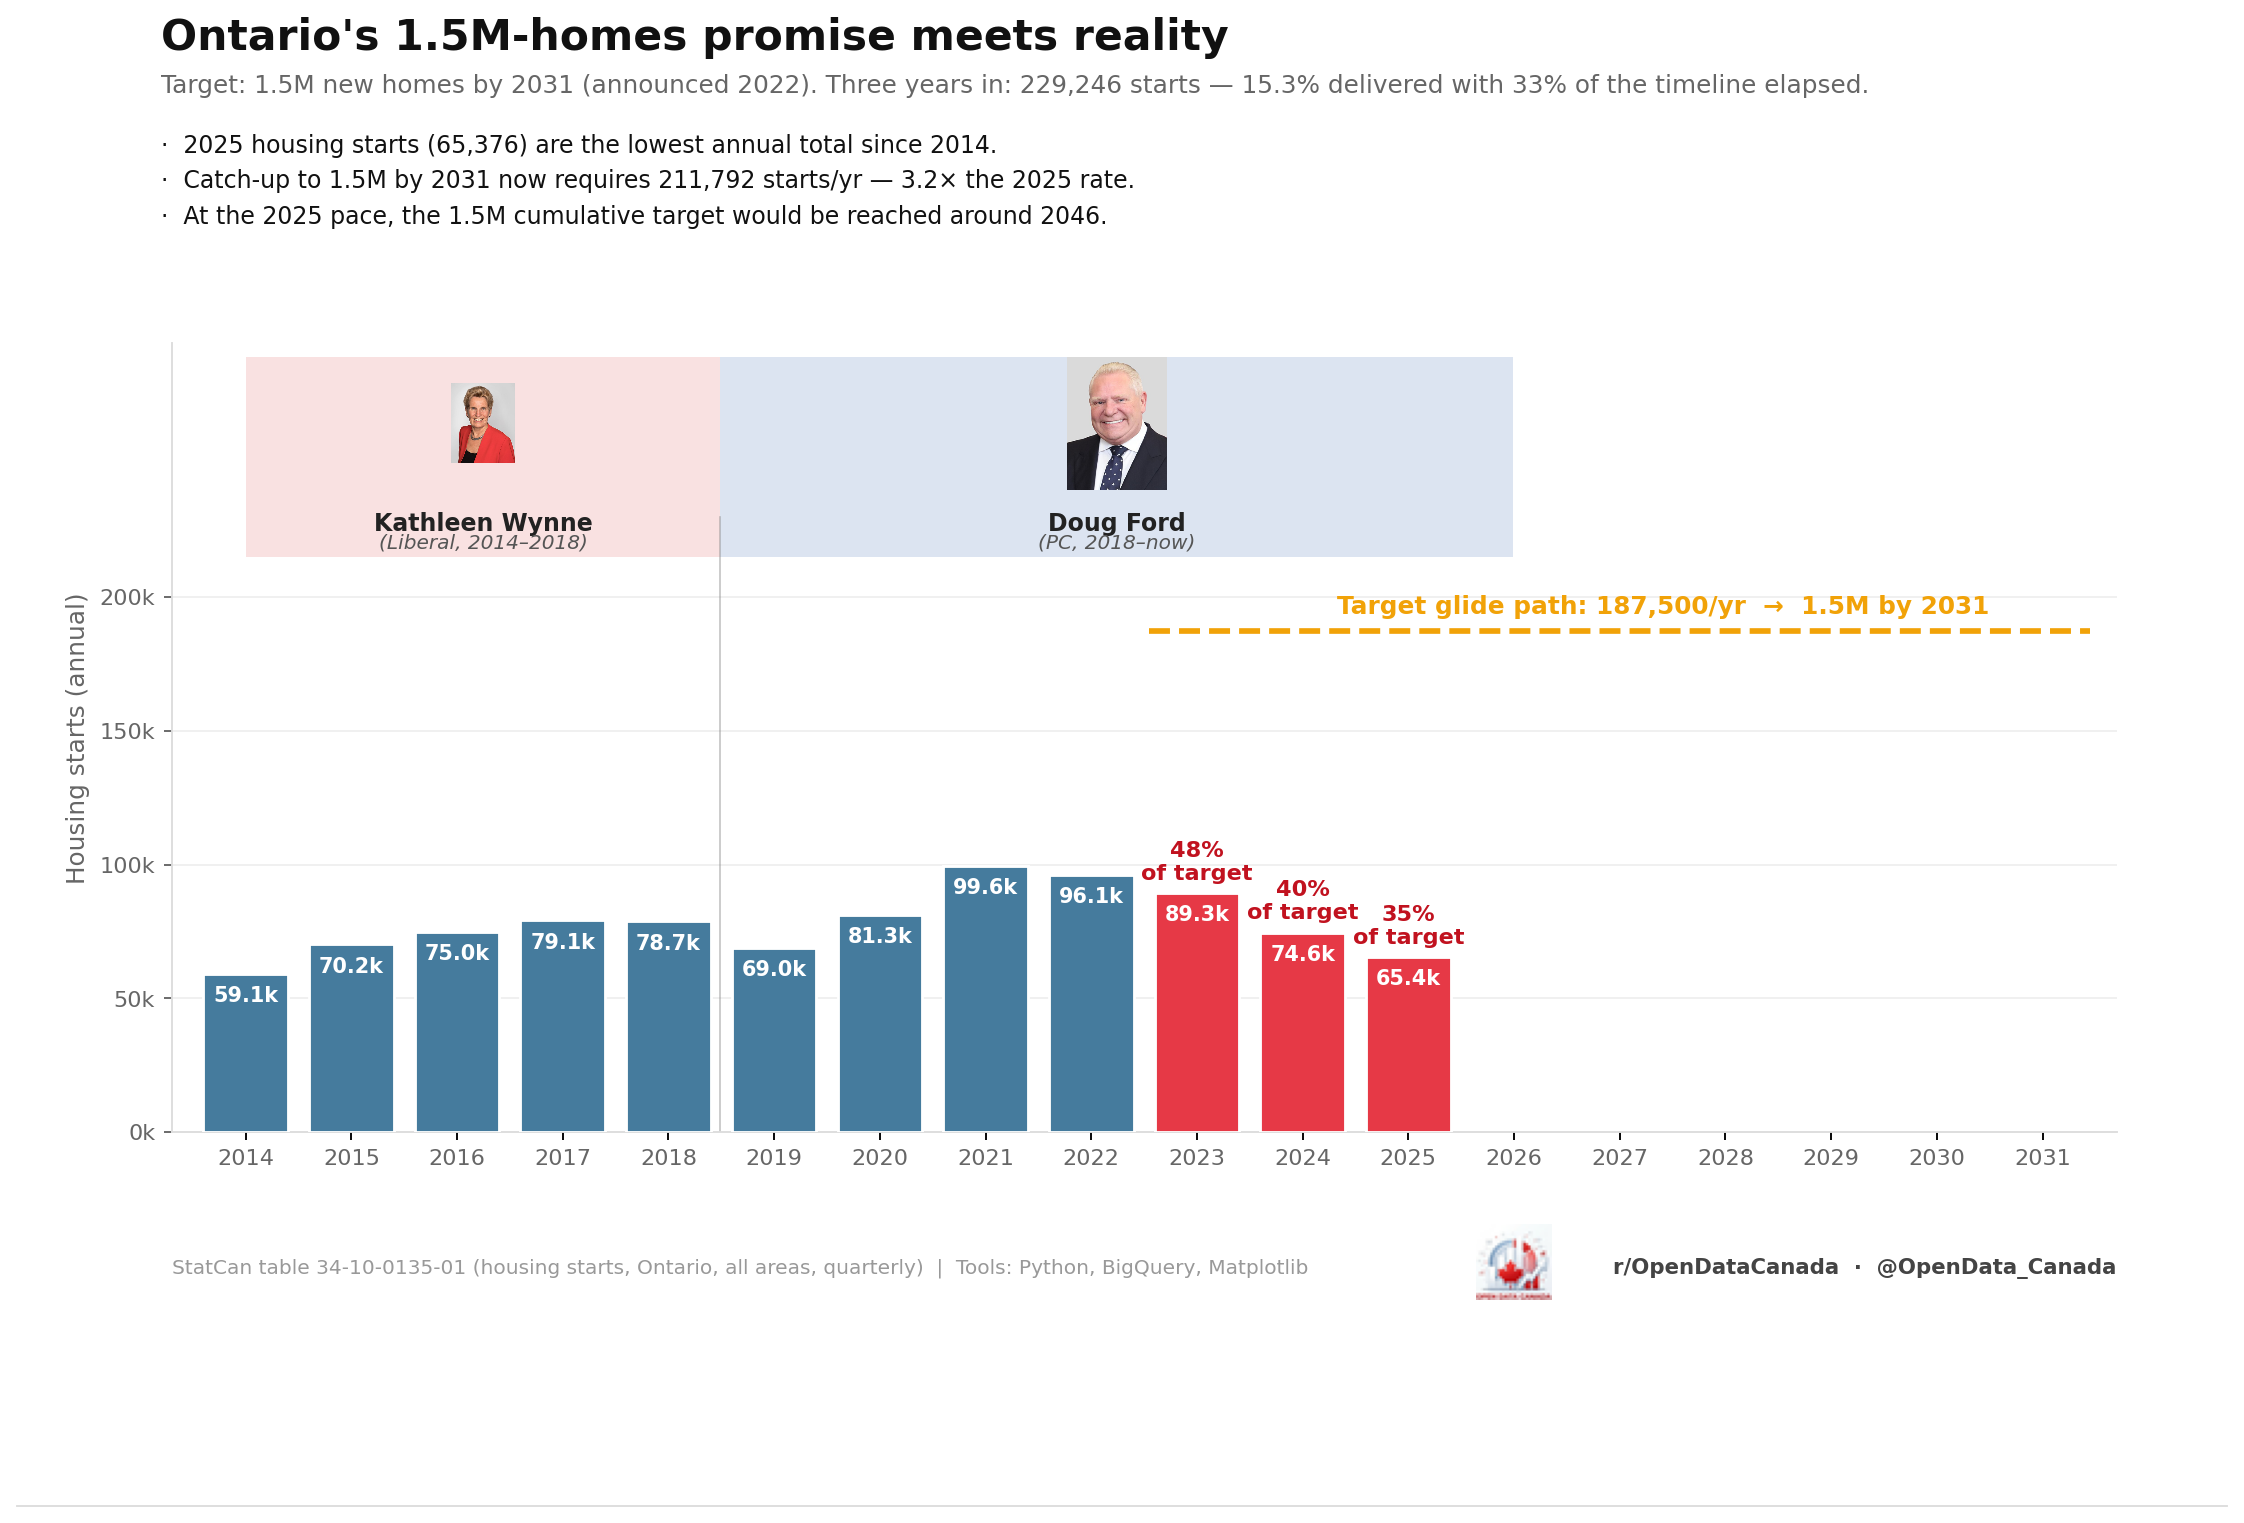
In 2022, Ontario's PC government committed to building 1.5 million new homes by 2031. Three years in, 229,246 housing starts have been recorded — 15.3 % of the target, against 33 % of the timeline elapsed. Catching up to the original 1.5 M target would now require 211,792 starts per year through 2031, which is 3.2 × the 2025 rate.
What the chart shows
The bars are annual Ontario housing starts (all areas, quarterly aggregated to annual) from 2014 through 2025. Two political tenures are shaded: Wynne (Liberal, 2014–2018) and Ford (PC, 2019–present). The dashed yellow line at 187,500 starts/year is the implied glide-path needed to reach the 1.5 million cumulative target by 2031.
| Year | Housing starts | % of 187,500 target |
|---|---|---|
| 2014 | 59.1 k | 32 % |
| 2015 | 70.2 k | 37 % |
| 2016 | 75.0 k | 40 % |
| 2017 | 79.1 k | 42 % |
| 2018 | 78.7 k | 42 % |
| 2019 | 69.0 k | 37 % |
| 2020 | 81.3 k | 43 % |
| 2021 | 99.6 k | 53 % |
| 2022 | 96.1 k | 51 % |
| 2023 | 89.3 k | 48 % |
| 2024 | 74.6 k | 40 % |
| 2025 | 65.4 k | 35 % |
A few things worth pulling out:
- 2014's 59.1 k is the lowest annual total in the series. Every subsequent year has been higher, including the years preceding the 2022 target.
- 2021 (99.6 k) was the highest. It remains the only year in the series above 100 k starts. It was reached during a period of historically low mortgage rates and high builder confidence.
- The trend since 2021 is downward, not upward. 2023 fell to 89.3 k, 2024 to 74.6 k, 2025 to 65.4 k. The direction of travel is moving away from the target, not toward it.
- At the 2025 pace, the cumulative 1.5 M target would be reached around 2046, fifteen years late.
Why the line is going the wrong way
Two structural drivers, both well-established in CMHC's quarterly Housing Market Outlook publications:
- Interest-rate sensitivity. Roughly 40 % of new Ontario housing starts in the previous decade were condominium projects, which depend on pre-construction sales to secure project financing. The 2022–2024 rate-rise cycle collapsed pre-construction sales by approximately 50 % across the GTA, which lagged into 2024–25 starts. This is a direct mechanism, not a correlation.
- Construction-cost inflation. Materials and skilled-trade wages rose roughly 30 % between 2020 and 2024 in Ontario. Combined with land prices that did not fall in proportion, the breakeven sale price for new builds rose meaningfully — which prices out the buyer pool that pre-construction projects target.
Note that "municipal approvals are slow" is also a real factor but is not what changed between 2021 (99.6 k) and 2025 (65.4 k). Approval timelines were already slow in 2021 and the starts number was a record. The 34 k-unit decline since then is rate-and-cost driven, not approvals-driven.
What the chart can't tell you
The chart shows starts, not completions. Starts and completions diverge most when projects are paused mid-construction. A start counted in 2022 may not produce an occupied home until 2026; a start counted in 2025 may not produce an occupied home until 2029. The 1.5 M-by-2031 framing is technically about starts (per the original PC commitment), but the public framing of the policy was about homes available to live in, which is the completions number — and is currently lower than the starts number.
The chart also shows Ontario only. The 1.5 M target is a province-level commitment; comparing against, say, BC (where starts have also fallen) or Quebec (where they have held more flat) would change which factors look most explanatory.
A "starts vs completions vs approvals" three-line chart and a multi-province comparison are both on the explainer backlog.
Read next