Health · Chart
20.9 hours — what an admitted patient spent in an Ontario ER in 2022/23
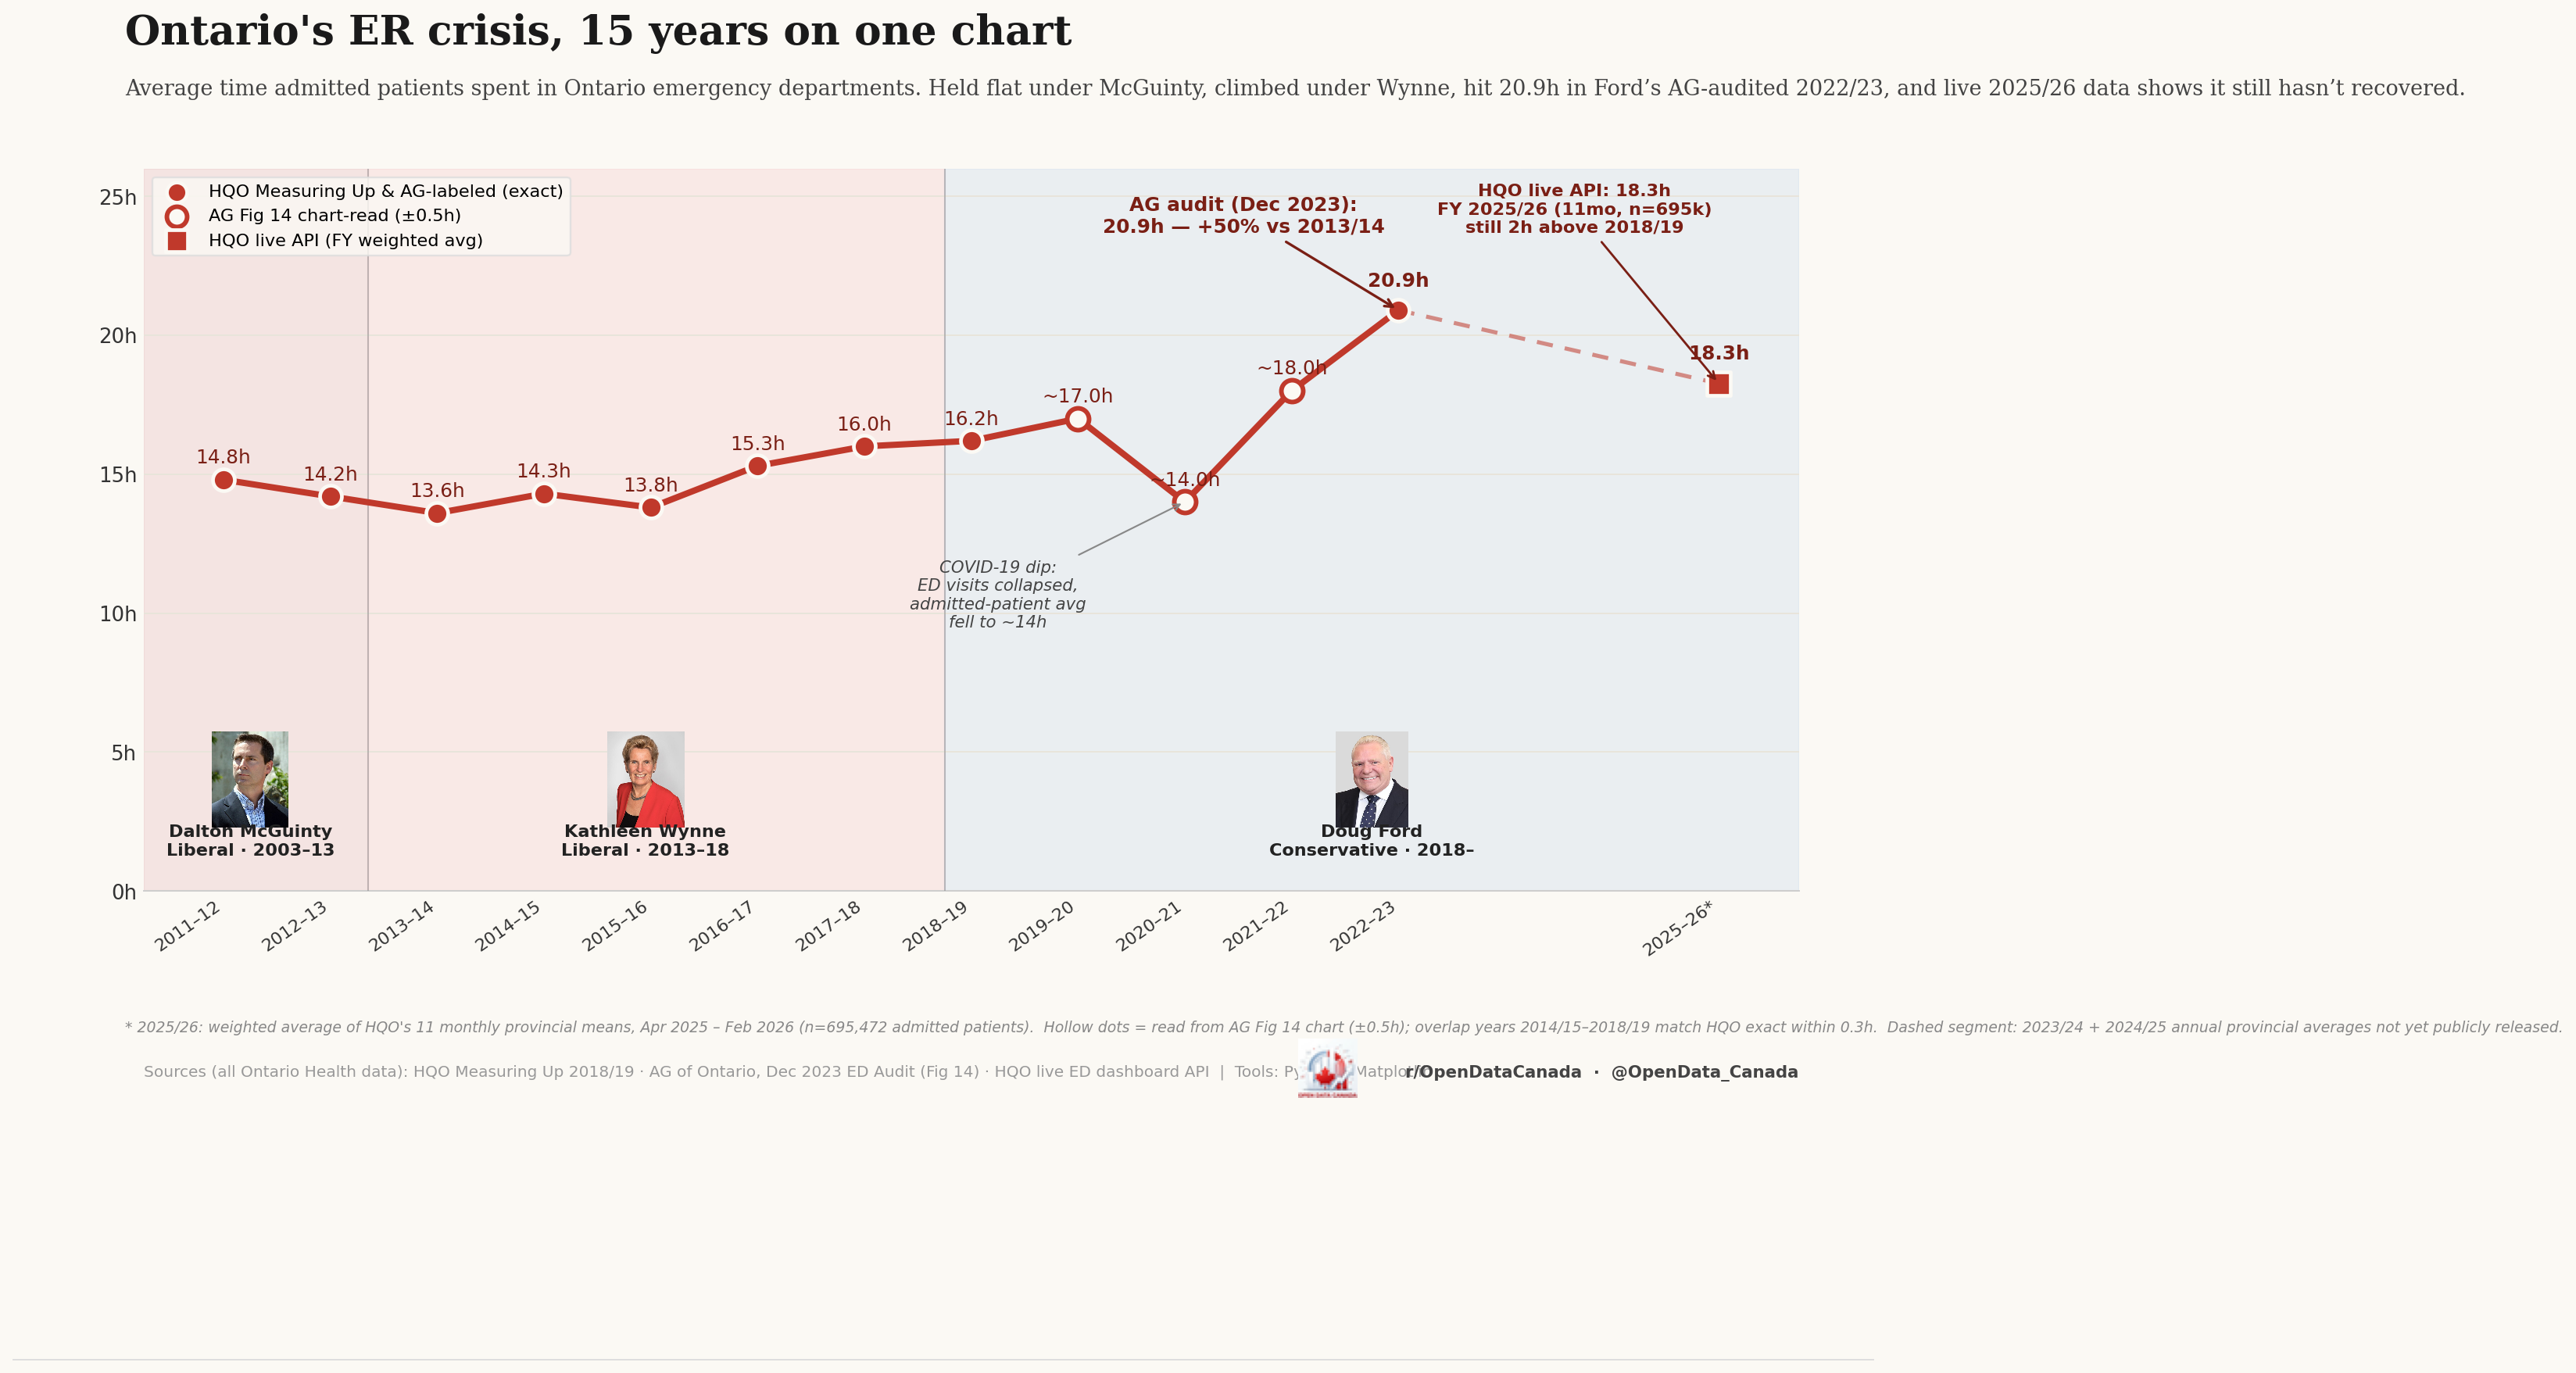
Ontario's average emergency-department length-of-stay for admitted patients held flat under McGuinty (2003–2013), climbed under Wynne (2013–2018), and reached an Auditor-General-confirmed 20.9 hours under Ford in 2022/23. Live 2025/26 data shows it has fallen back to 18.3 hours — still nearly four hours above the 2014 baseline of 14.3 hours.
What the chart shows
The y-axis is "average time spent in the emergency department" for admitted patients — patients whose ER visit ended with admission to hospital, not those who were discharged from the ER itself. The x-axis is fiscal year (April–March). Three Ontario governments are marked: McGuinty (Liberal, 2003–13), Wynne (Liberal, 2013–18), and Ford (PC, 2018–present).
Headline numbers from the chart:
| Fiscal year | Average ED length-of-stay (admitted patients) | Source |
|---|---|---|
| 2011/12 | 14.8 h | HQO Measuring Up |
| 2013/14 | 13.6 h | HQO Measuring Up |
| 2014/15 | 14.3 h | HQO Measuring Up (low point) |
| 2017/18 | 15.3 h | HQO Measuring Up |
| 2018/19 | 16.0 h | HQO Measuring Up |
| 2019/20 | 16.2 h | HQO Measuring Up |
| 2020/21 | ~14 h | HQO Measuring Up (COVID dip — ED volumes collapsed) |
| 2022/23 | 20.9 h | Auditor General audit, Dec 2023 |
| 2025/26 (live) | 18.3 h | HQO live API (n=695k) |
The Auditor-General-audited 2022/23 figure is the highest the series has ever recorded. The 50 % increase versus the 2013/14 trough (13.6 → 20.9 hours) happened across two governments and was not a single-administration phenomenon.
What's actually driving the line
Three structural pressures, each of which is independently testable:
- Hospital occupancy at or above 100 %. Admitted patients who cannot be moved from the ER to an inpatient bed remain in the ER. The bottleneck is rarely "ER triage was slow"; it is almost always "no inpatient bed is free." Ontario's average occupancy has been at or above 100 % in most months since 2018.
- Alternate Level of Care (ALC) patients occupying inpatient beds. Patients medically ready for discharge but waiting for long-term-care placement, home care, or rehab — currently between 14 % and 18 % of provincial inpatient days — make the inpatient bed shortage worse without any corresponding reduction in ER demand.
- Population growth without proportional capacity growth. Ontario added roughly 2 million residents between 2014 and 2024; the inpatient bed count grew by approximately 6 %. The mismatch is large enough on its own to explain a meaningful share of the curve.
These three are usually presented in isolation in policy debate. They compound. Any analysis that addresses only one will under-explain the chart.
What the chart can't tell you
The chart shows admitted patients only. The much larger group — patients discharged from the ER — has a different and shorter wait time, currently around 4 hours on average. Combining the two creates a misleading composite. The 20.9-hour figure is the slow tail of the distribution, not a "typical ER visit."
The chart also doesn't break out by hospital. Provincial averages mask large between-hospital variation: the worst-performing 10 % of Ontario hospitals run admitted-patient stays meaningfully above 30 hours; the best 10 % run them below 12. A hospital-level view would change which jurisdictions look responsible.
A multi-province version of this chart — comparing Ontario against BC, Quebec, and Alberta — would also be analytically useful and is on the backlog. Cross-province comparisons require careful normalisation because each province defines "admitted patient" slightly differently.
Read next