Articles
Explainers
When a chart, map, or visualization needs context the picture alone can't carry, this is where the longform expansion lives — usually a few pages, always with the objections engaged honestly rather than ignored.
Canada was the world's 4th-largest carmaker in 2000. It now ranks 14th — behind the Czech Republic and Turkey.
Canada built 2.96 million vehicles in 2000 and sat fourth in the world. In 2025 it built 1.24 million and ranked 14th, behind the Czech Republic and Turkey. Mexico now builds 3.3 times as many vehicles as Canada does. Four plant exits in 23 years did most of the work — Sainte-Thérèse 2002, Oshawa Truck 2009, Oshawa Car 2019, Brampton idled 2024.
Canadian millennials are twice as likely to live with their parents as boomers were
16.3 percent of millennials aged 25 to 39 still lived with at least one parent in 2021 — twice the 8.2 percent rate baby boomers had at the same age in 1991. Generation X, measured the same way in 2006, sat at 12.2 percent. Three census points, three measurements of the same life stage, no reversals.
Canada's 2026 Census is being collected now — here's when each result lands, and what's worth watching
StatCan hasn't published the 2026 release calendar yet, but the 2021 cycle gives a tight template — first headline counts about nine months out, full picture about eighteen. Ten things the new data is set up to settle, including the first nationally-representative LGB+ count, the temporary-resident gap, and the housing crisis baseline.
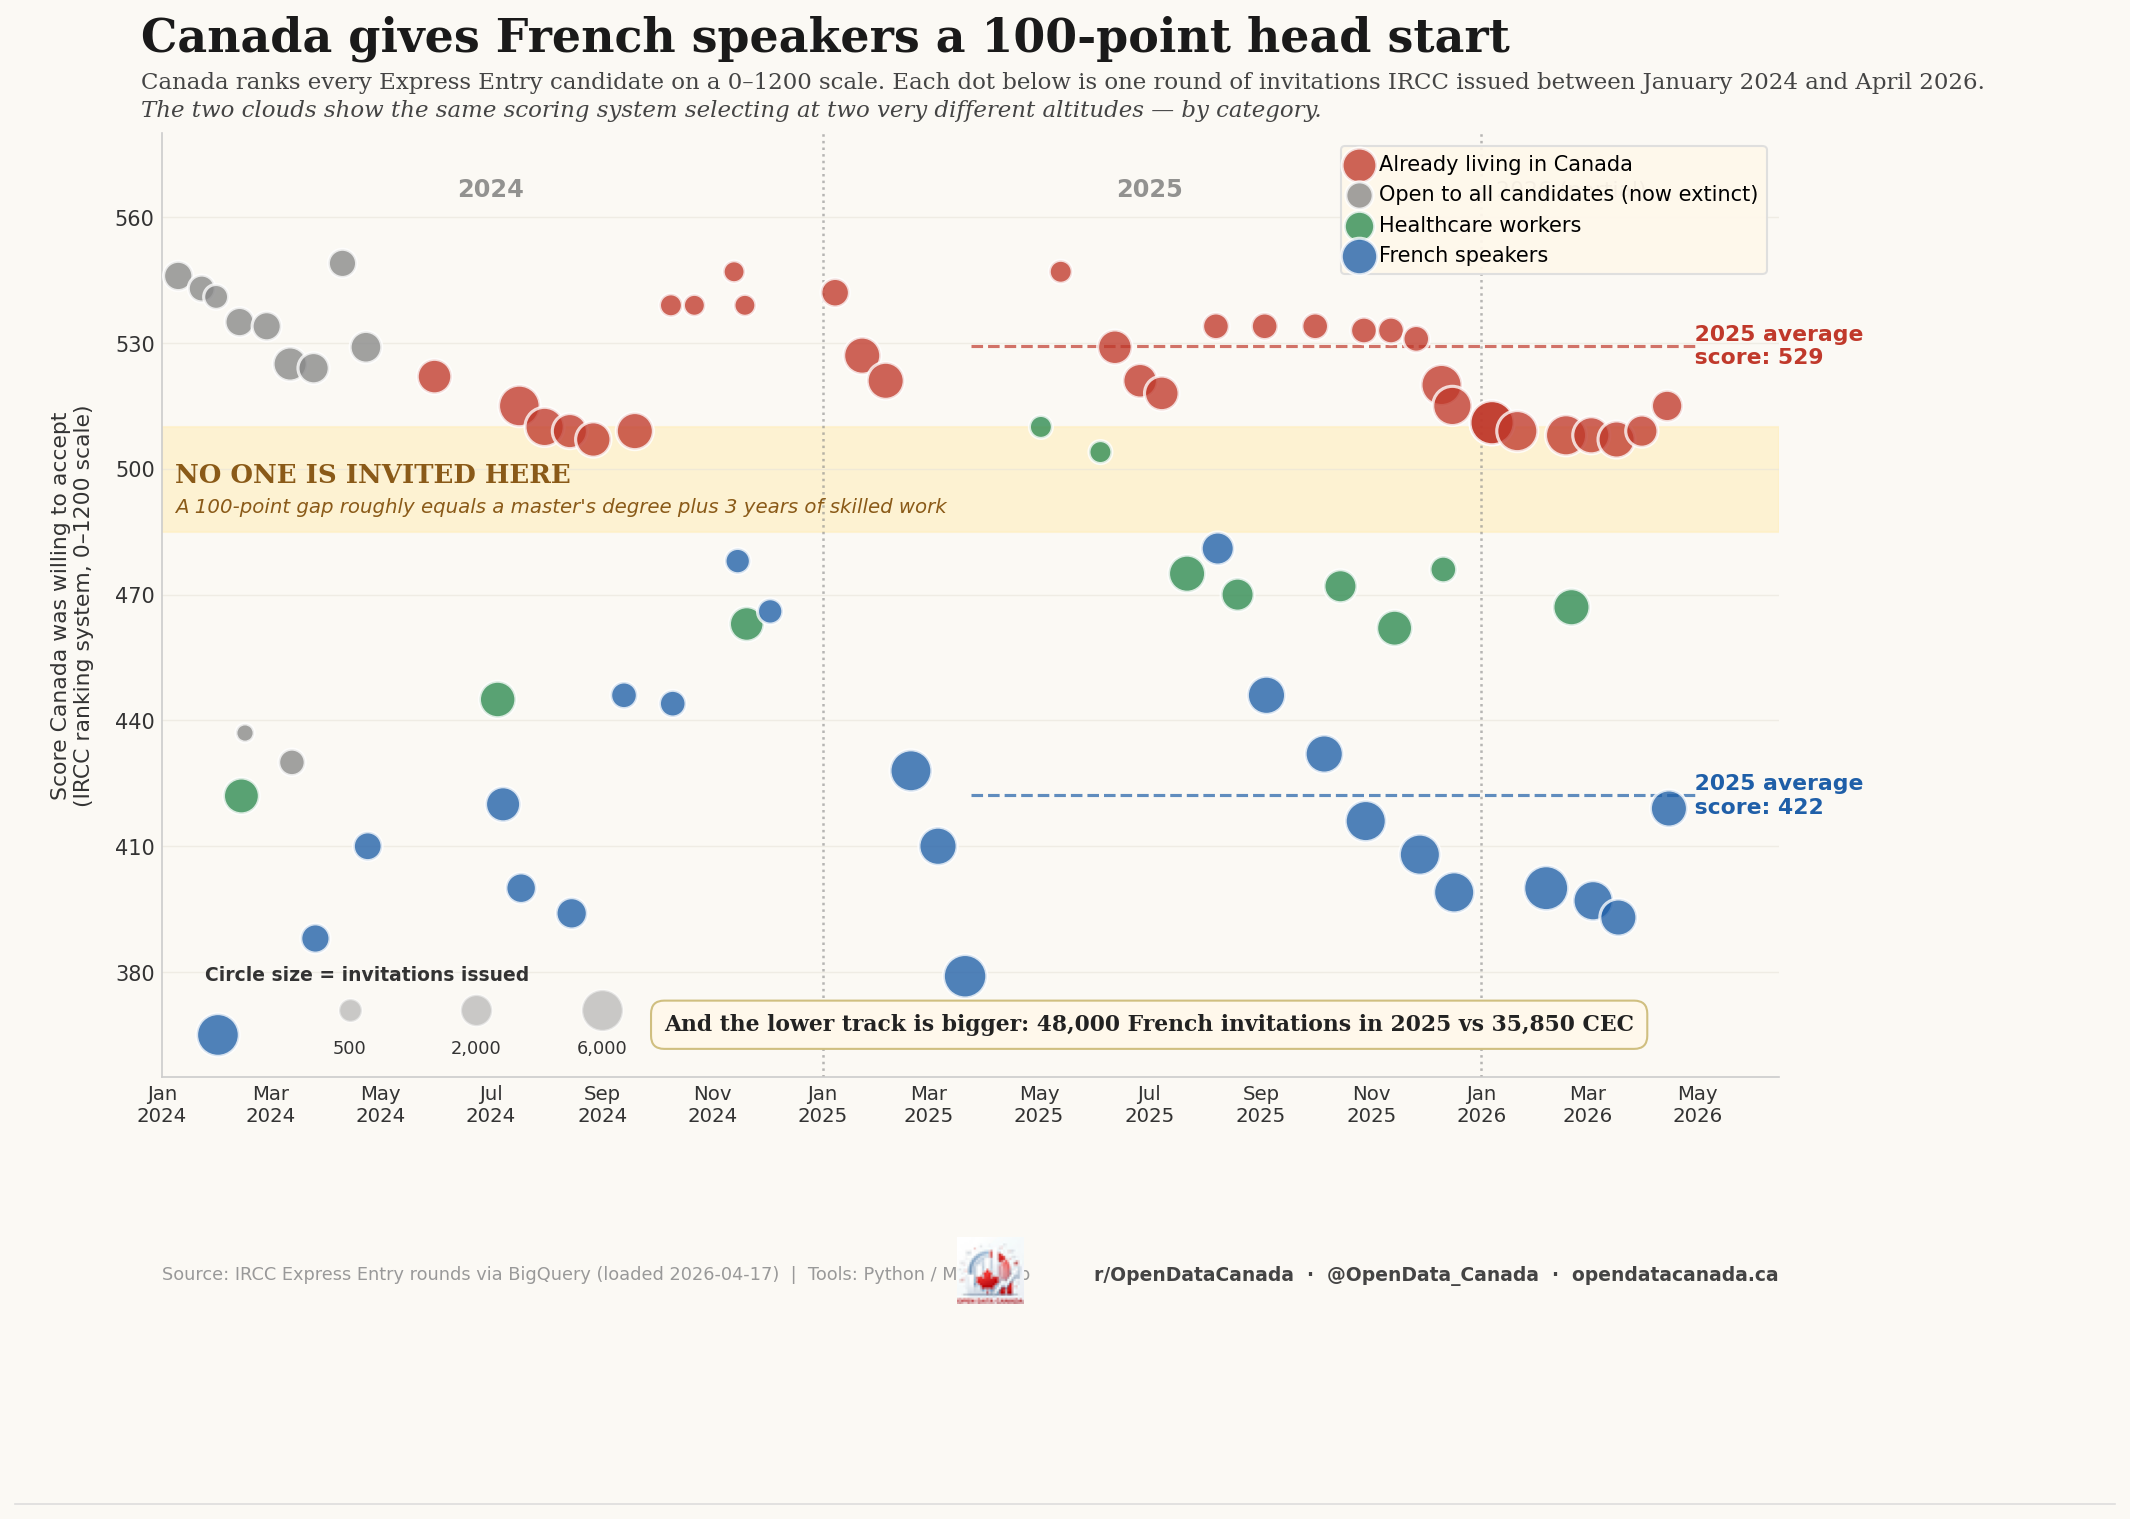
Canada will pay 107 CRS points for a French speaker
French-stream Express Entry cutoffs averaged CRS 422 in 2025. Canadian Experience Class averaged 529. Same scoring system, two distinct altitudes. The 48,000 French invitations issued in 2025 are the largest deliberate source-country reshape since Express Entry launched in 2015.
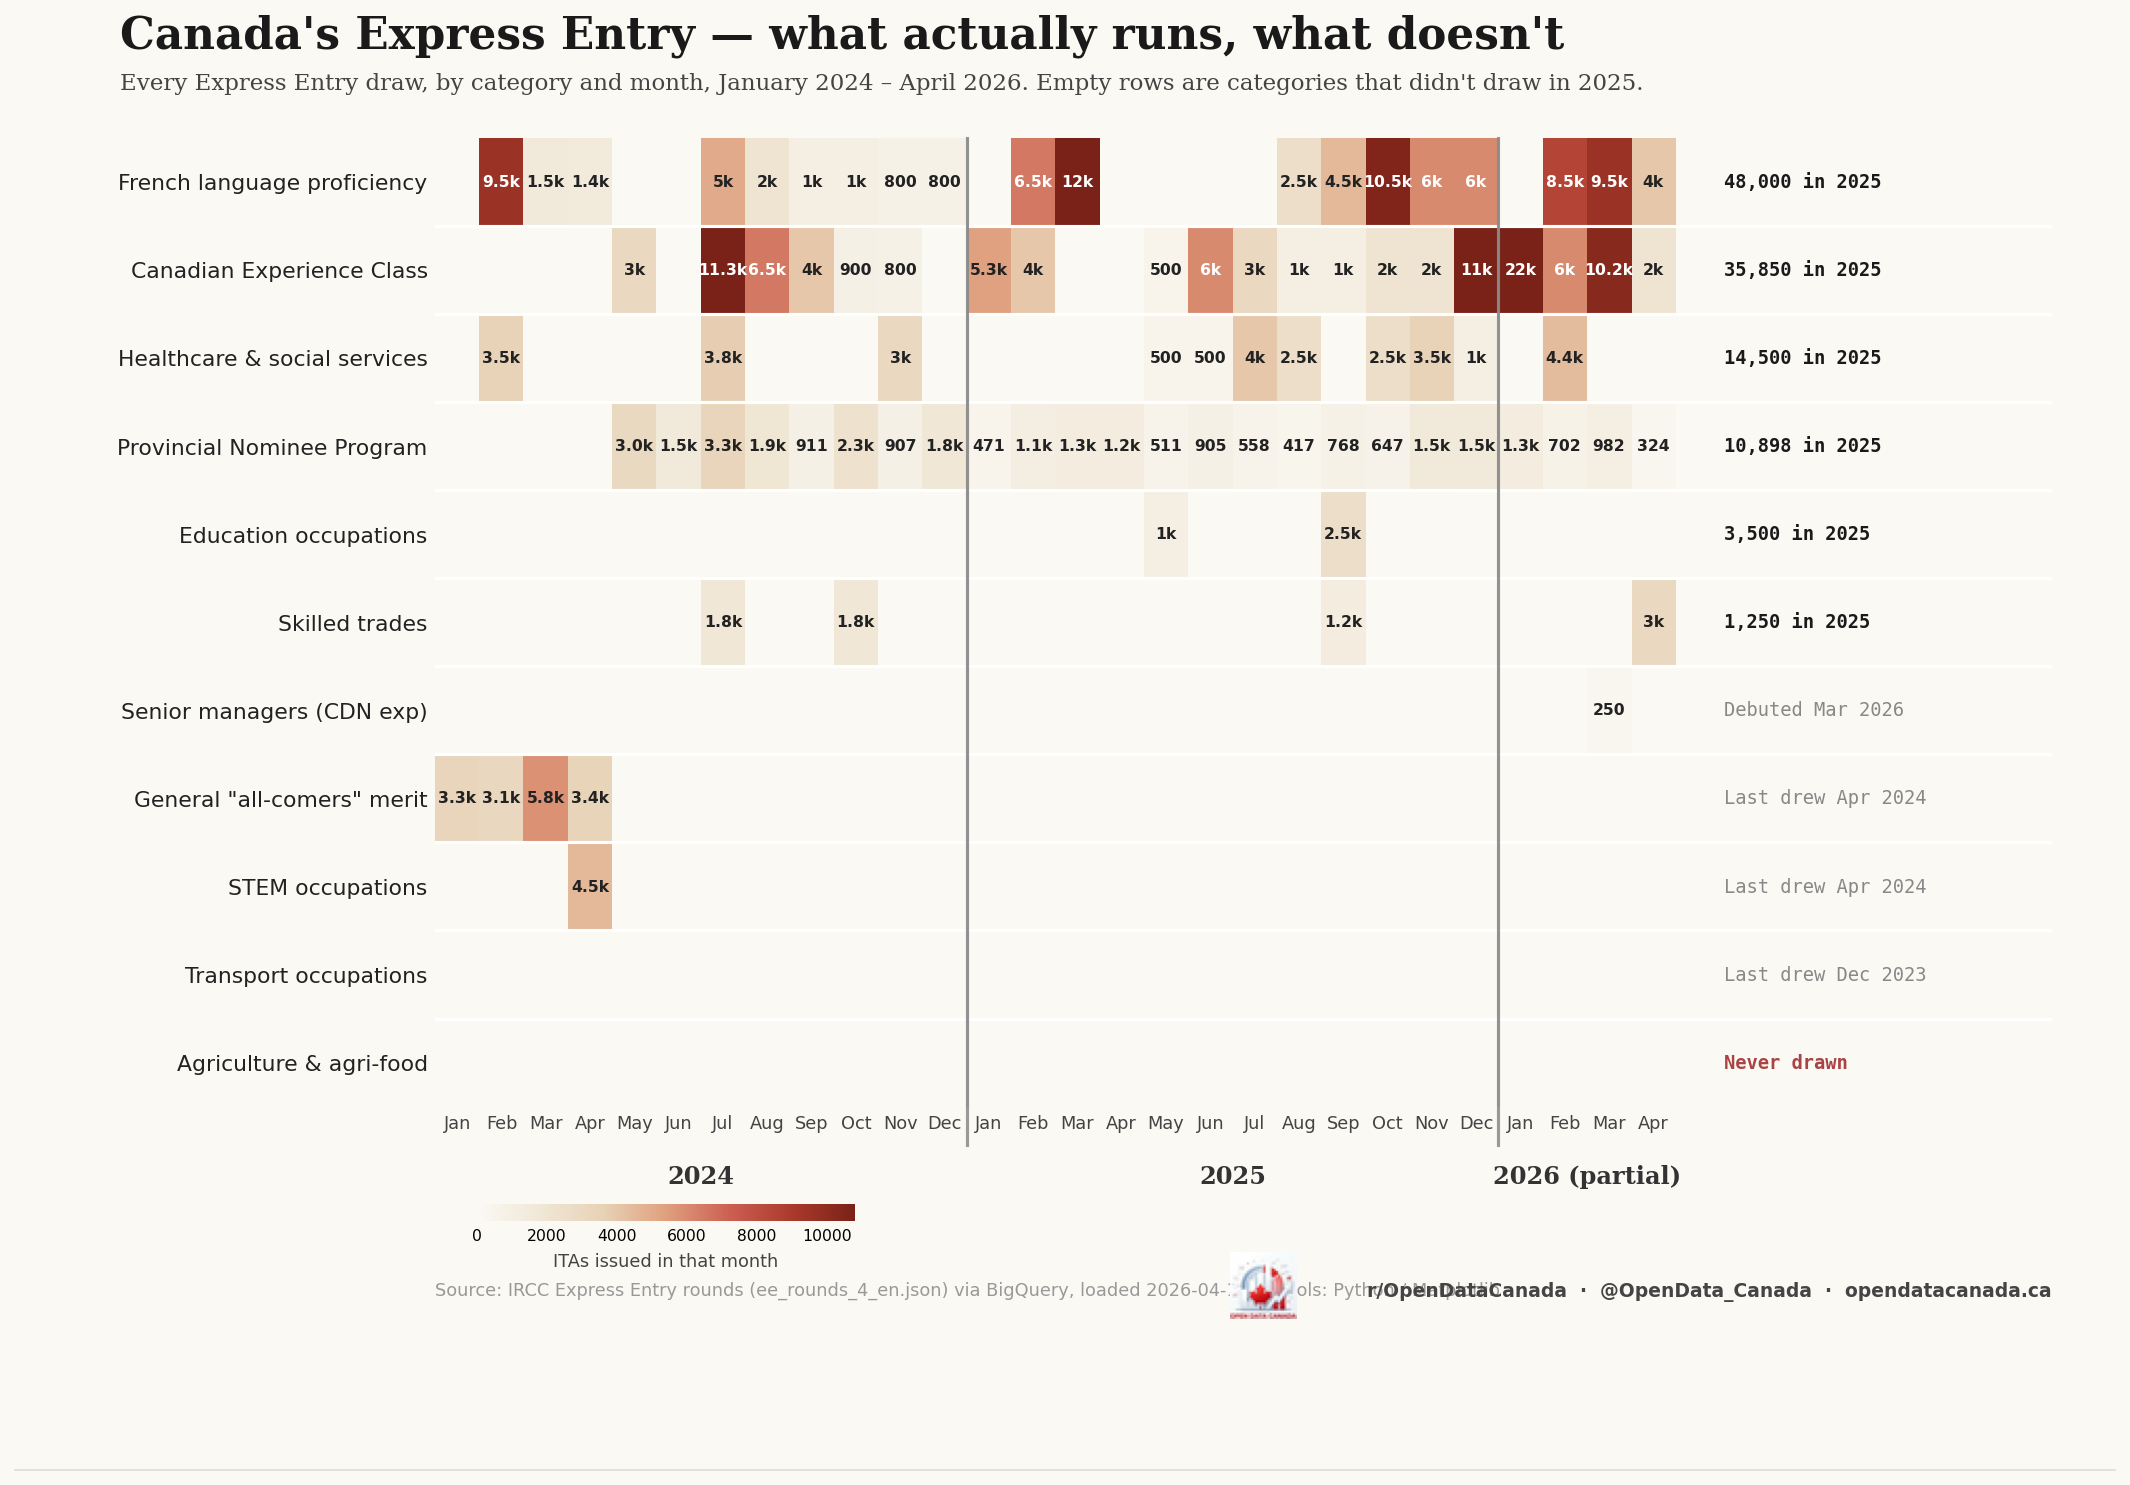
Canada has seven Express Entry priority categories. Three of them did 86% of the work.
French, CEC, and Healthcare did 86,350 of the 113,998 invitations IRCC issued in 2025 — 75.7% of the year. STEM hasn't drawn since April 2024. Transport drew once in December 2023. Agriculture has never drawn at all.
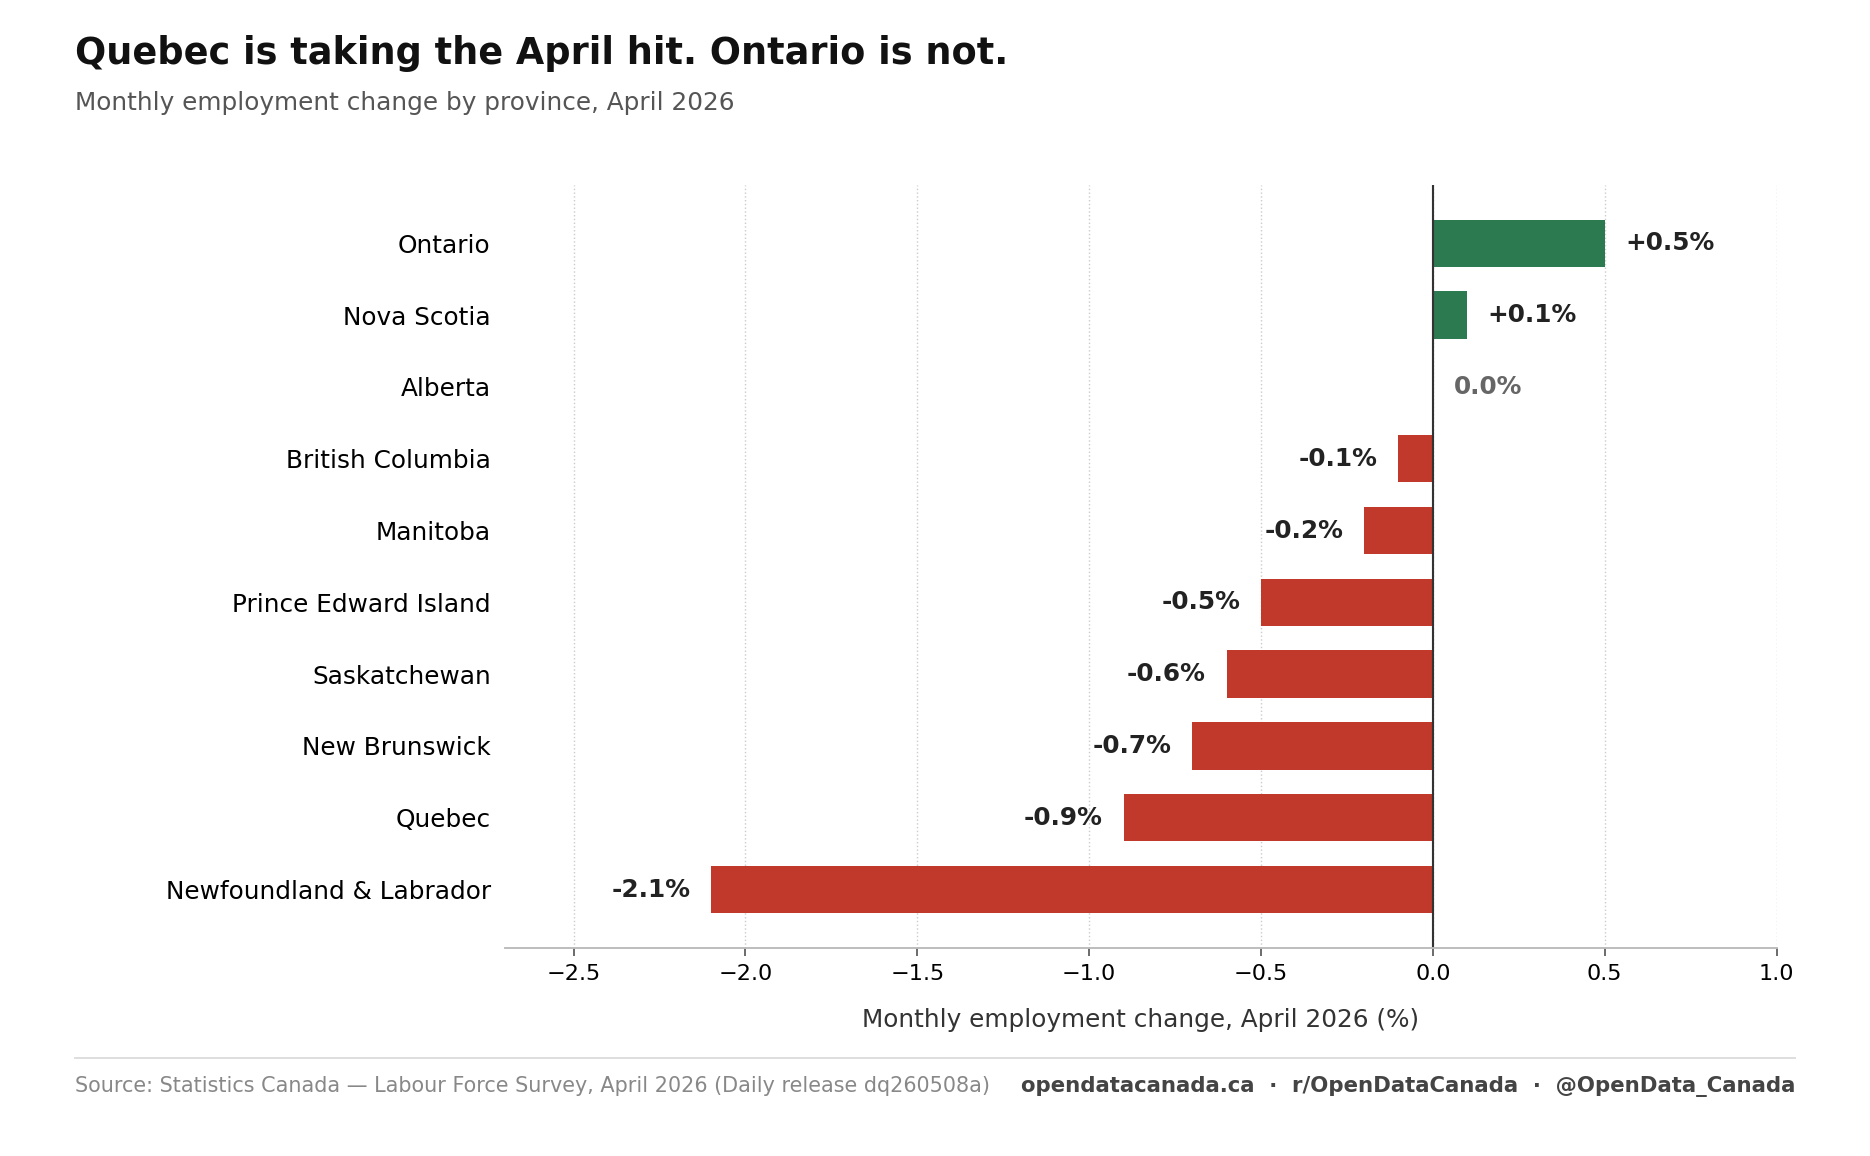
Canada has lost 111,000 full-time jobs since January. Quebec is taking the worst of it.
April was the fourth straight monthly decline in full-time employment. Unemployment hit a six-month high. Wages still grew 4.5 percent year-over-year. The headline number of −18,000 hides what is happening underneath it.
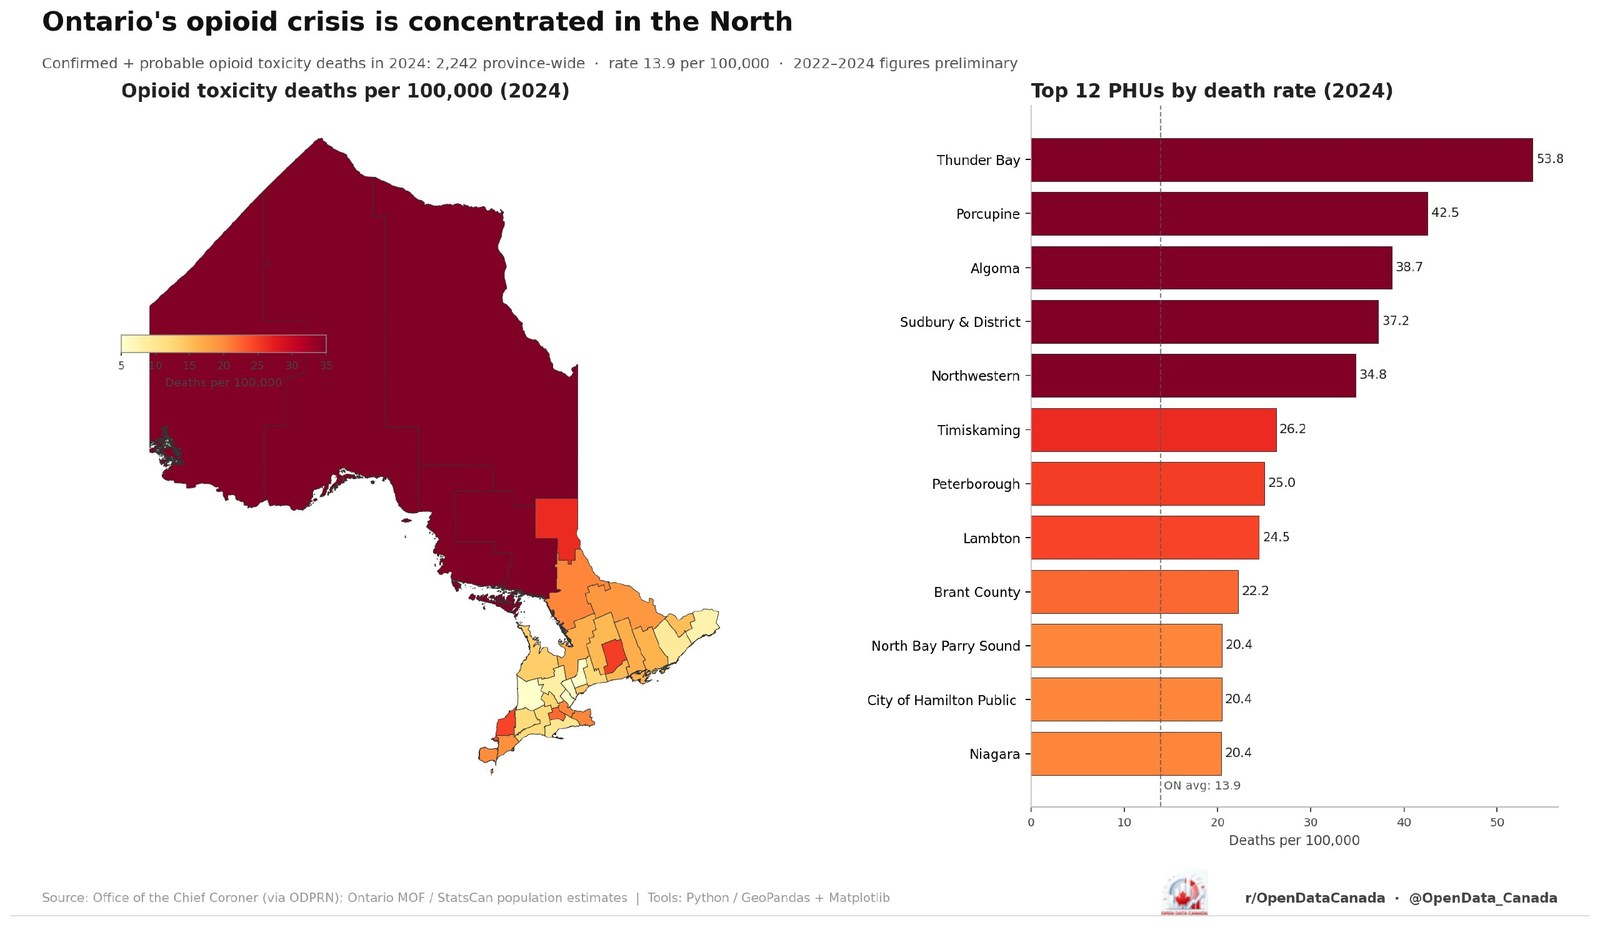
Ontario's opioid crisis is concentrated in the North — Thunder Bay's rate is nearly 4× the provincial average
2,242 deaths province-wide in 2024 (13.9 per 100,000). Thunder Bay 53.8. Porcupine 42.5. Algoma 38.7. Toronto near the average. Peel lowest. The provincial number hides a sharp geographic split.
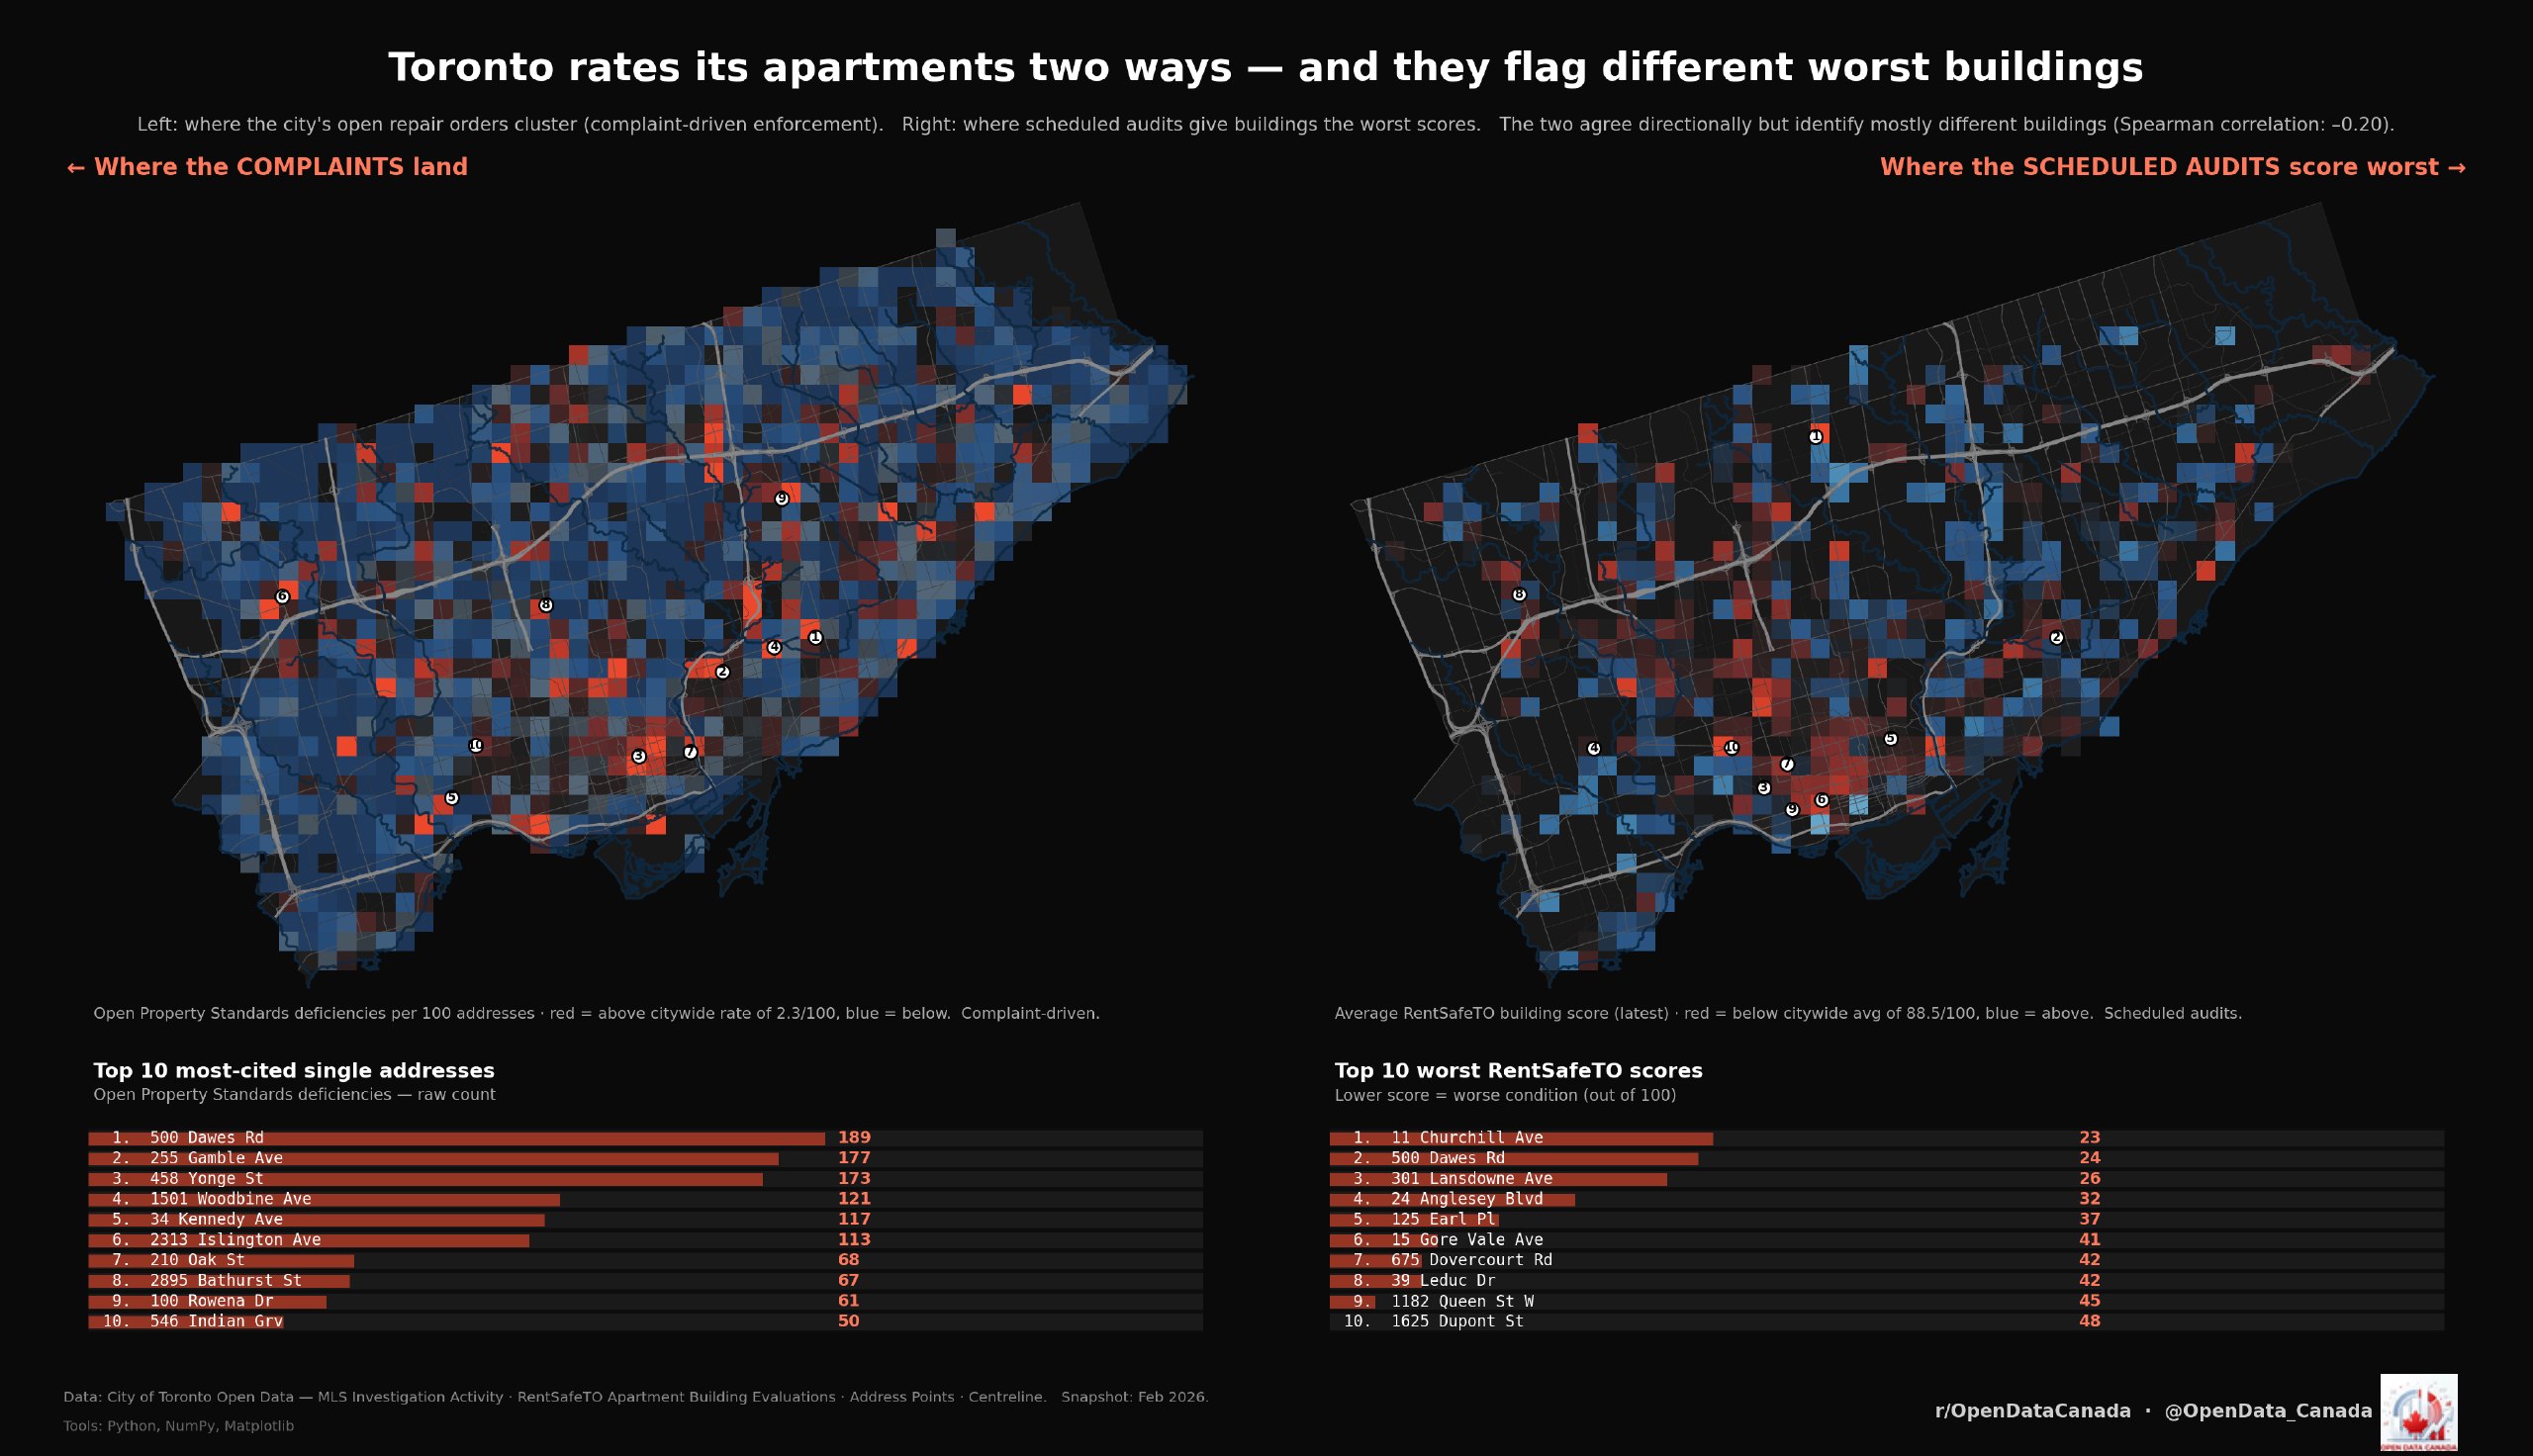
Toronto rates its apartments two ways — and they almost never agree on which buildings are worst
Toronto runs two parallel apartment-rating systems: one inspects every building on a schedule, the other reacts to 311 calls. They almost never agree on which buildings are worst. 500 Dawes Road — the only address on both top-10 lists — is the building Mayor Chow visited and where city crews are now doing the repairs themselves.
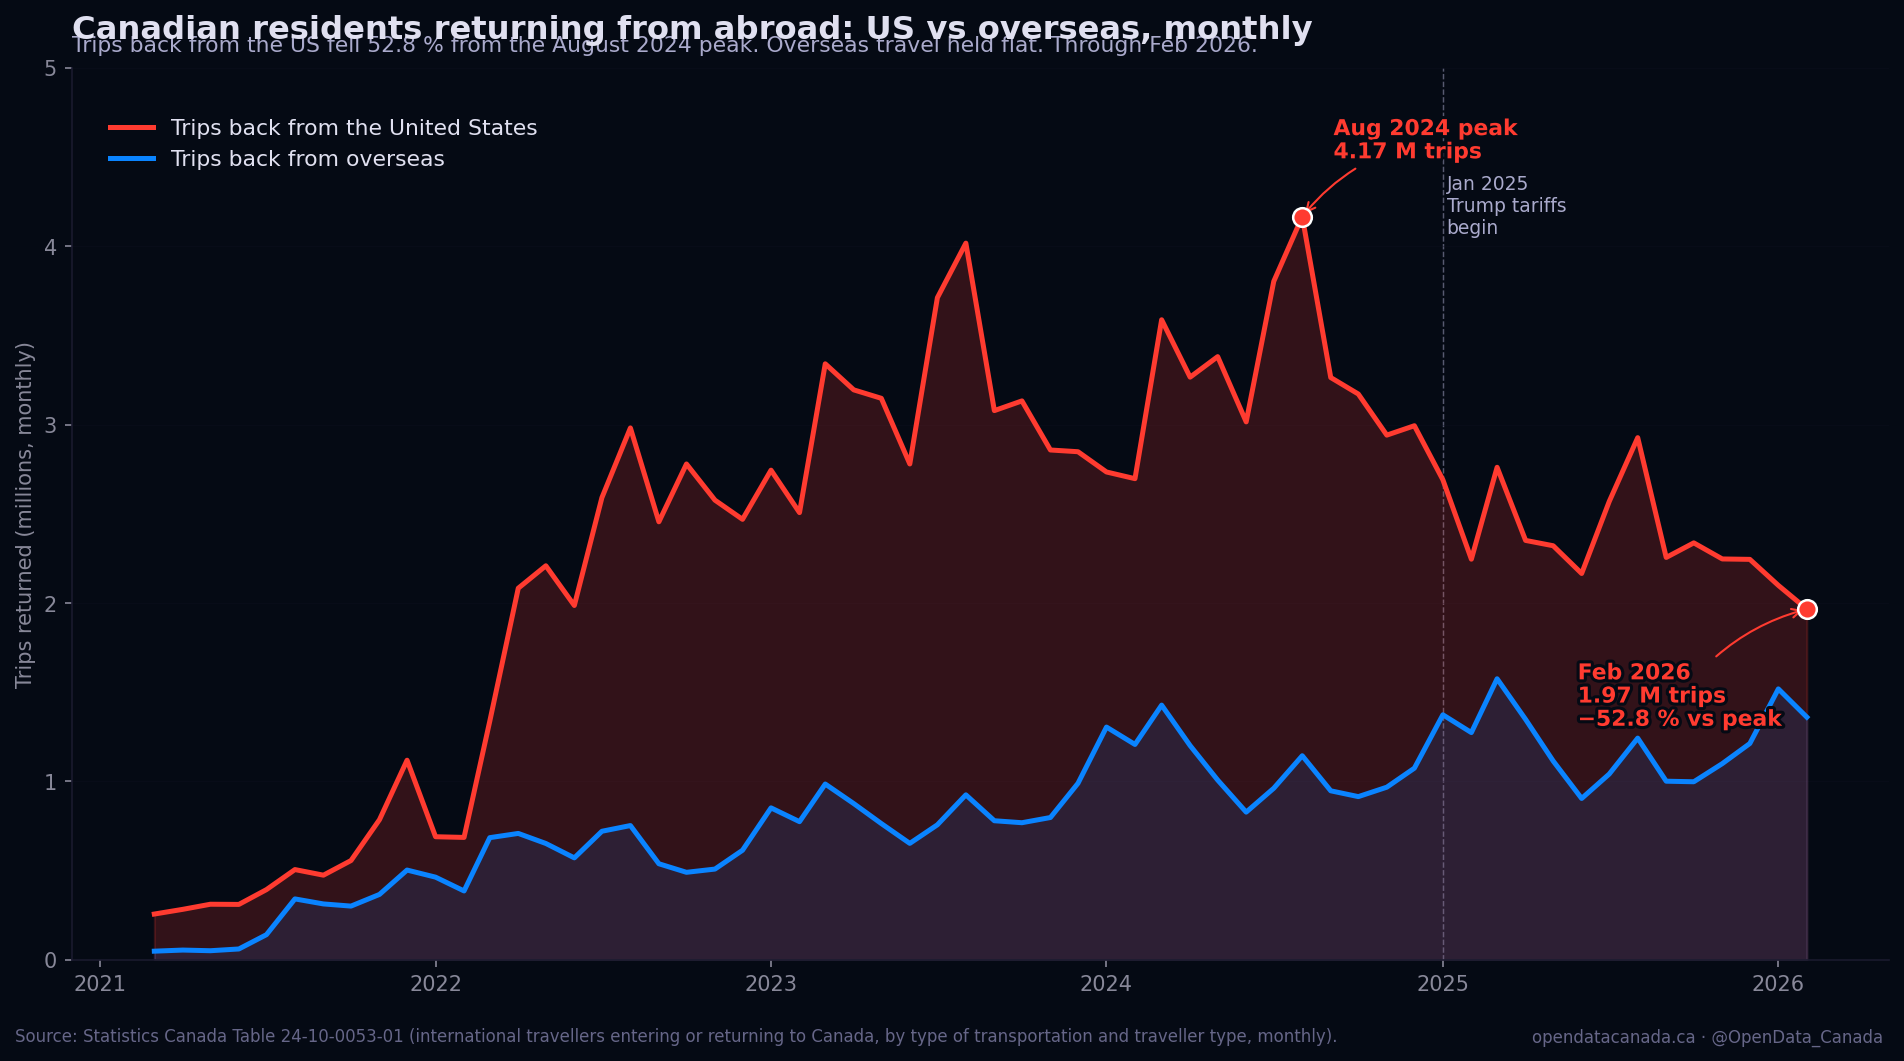
52.8 % — Canadian trips to the US have collapsed since August 2024
4.17 M trips back from the US in Aug 2024 → 1.97 M in Feb 2026. Fourteenth consecutive month of YoY decline. Overseas travel didn't move. Tied precisely to January 2025 tariffs and the "Buy Canadian" response.
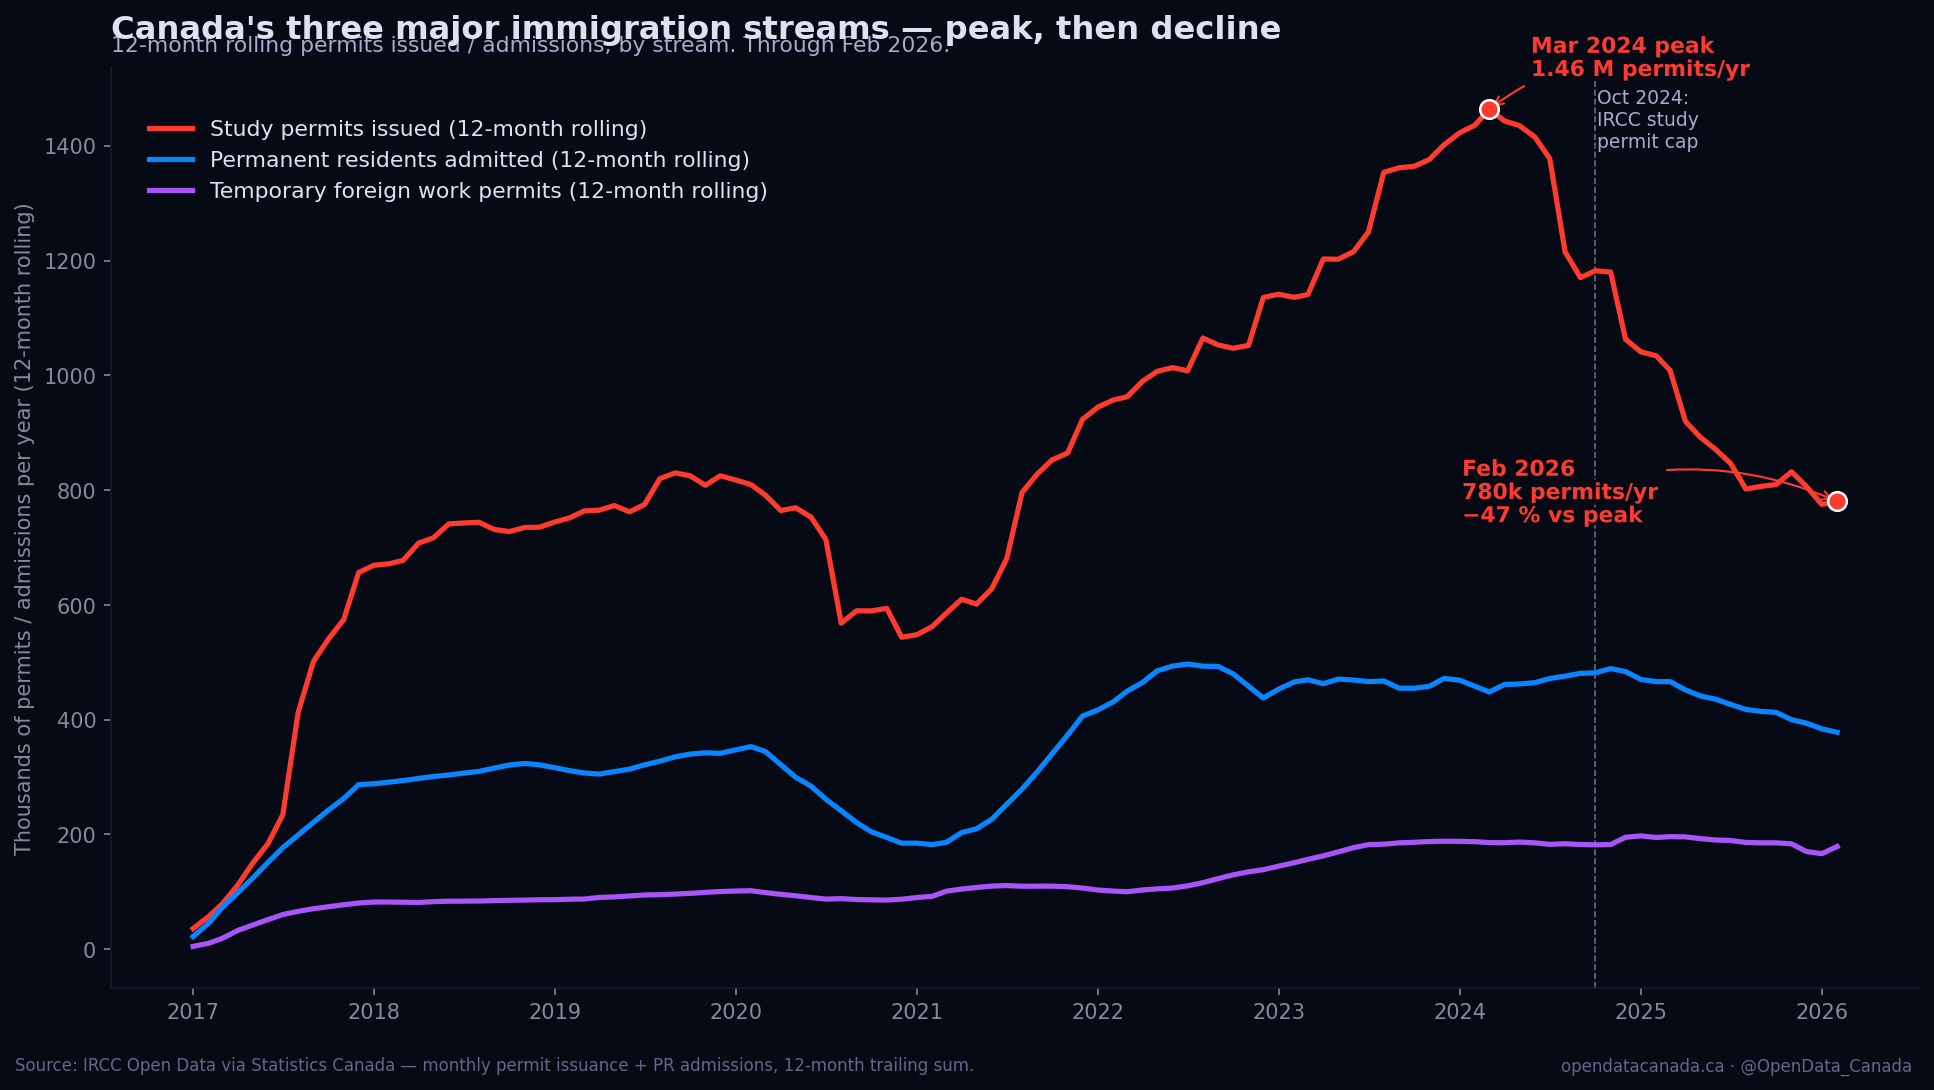
The boom is over — every major immigration stream is now declining
Study permits issued: 1.46 M (Mar 2024) → 780k (Feb 2026), −47 %. PR admissions down 24 %. TFW work permits down 9 %. The October 2024 cap is hitting its target faster than the announced trajectory required.
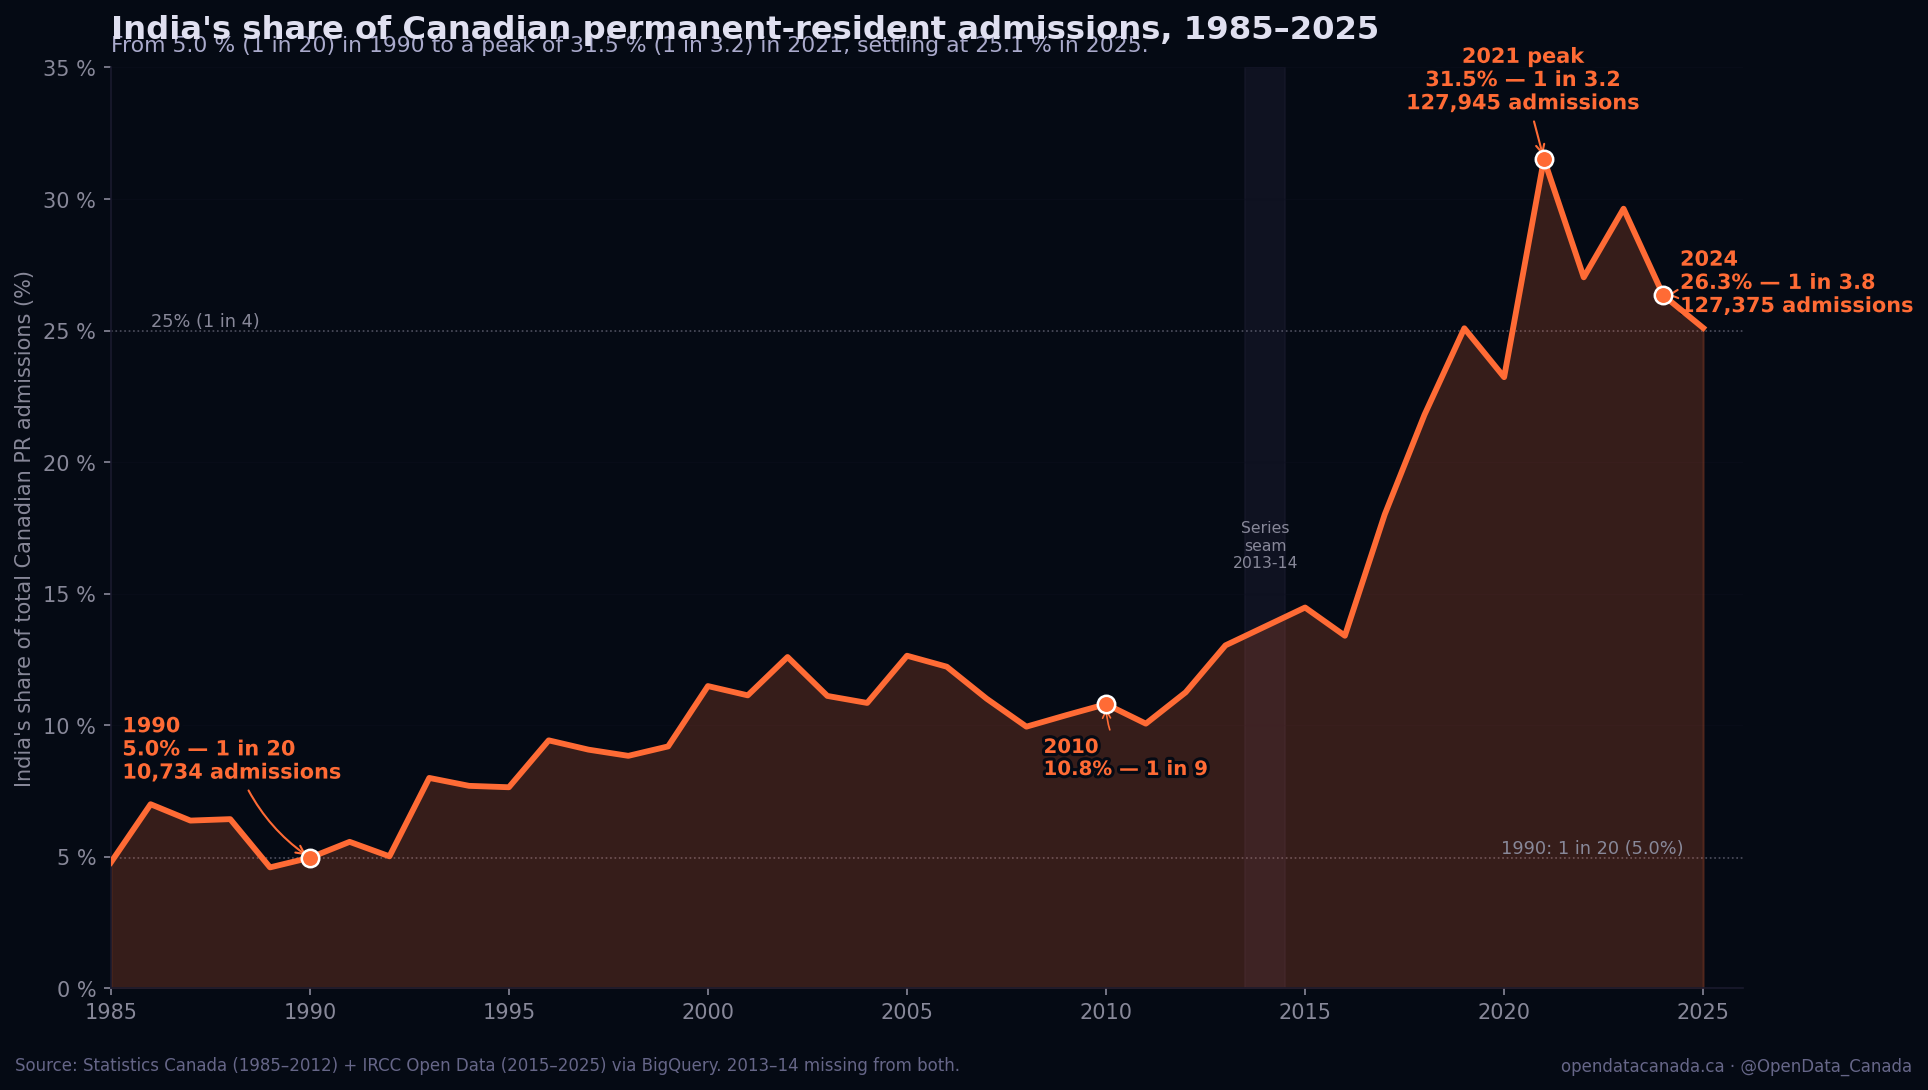
1 in 4 — how India became Canada's dominant immigration source
From 5 % of PR admissions in 1990 to a peak of 31.5 % in 2021 (1 in 3.2). Holding at 25 % in 2025 even as the total falls. Walks through the four mechanisms that produced the shift, including Express Entry's 2015 launch and the study-to-PR pathway.
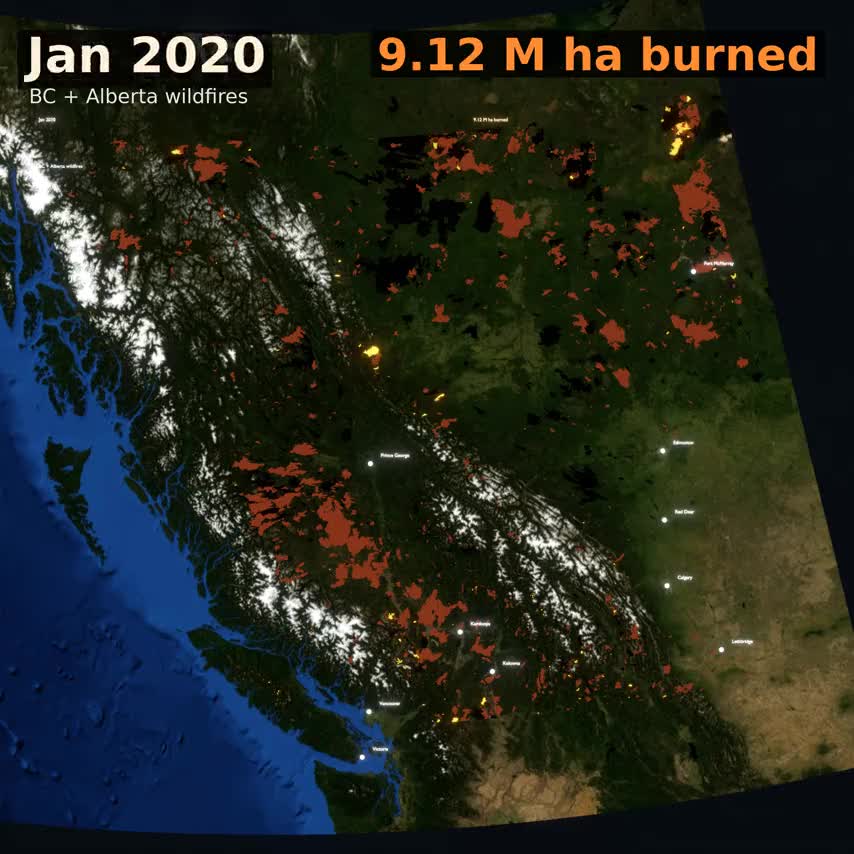
18.36 M hectares — what 25 years of BC and Alberta wildfires mean for forests, carbon, water, and insurance
Half of the 25-year cumulative burn happened in the last six years. The 2023 season alone was 4× the rolling 5-year average. Walks through 800 Mt cumulative CO₂, watersheds reburning every 14–20 years instead of every century, C$ 4.1 B in 2023 federal disaster payouts, and insurance withdrawal from BC interior communities.
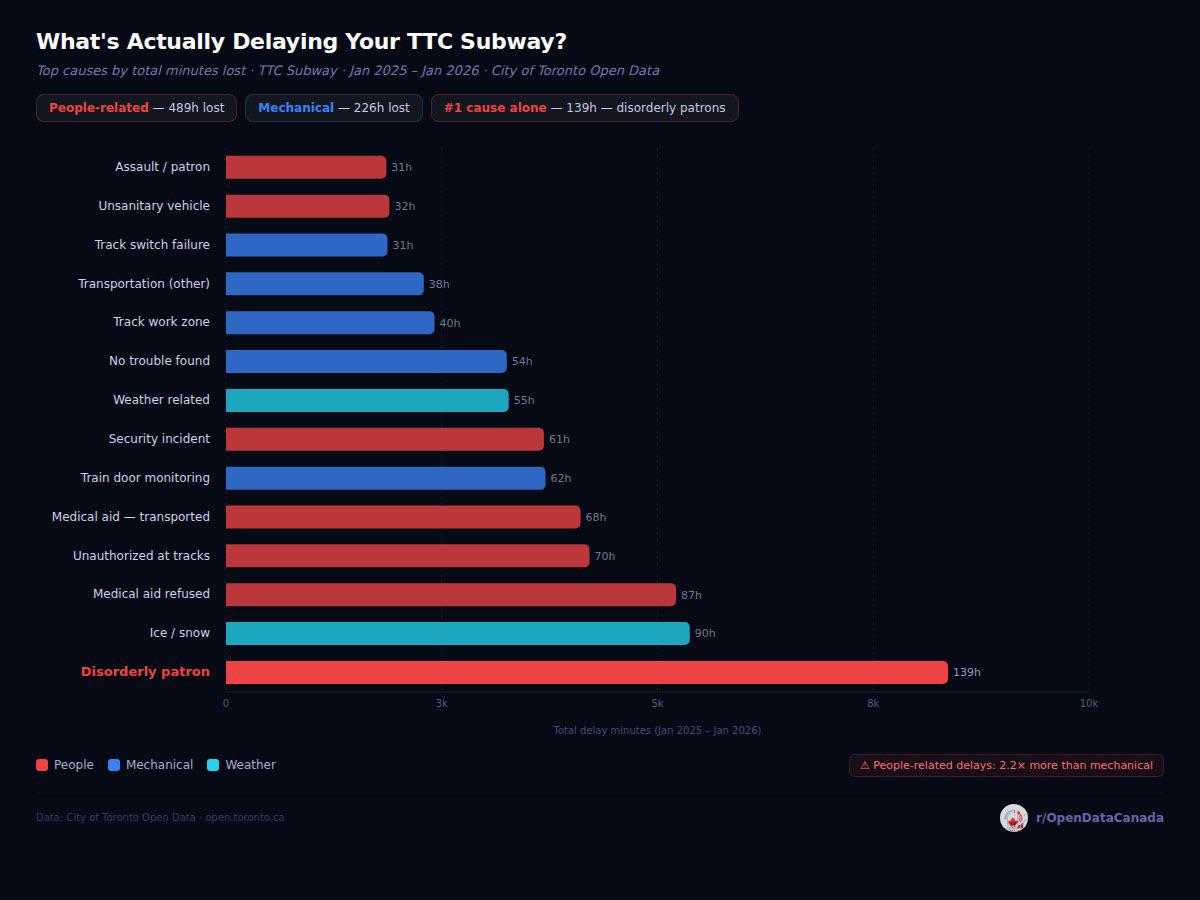
What's actually delaying the TTC subway — what the chart said, and the five layers underneath it
1,385 hours lost across 10,087 incidents. Disorderly patrons top the chart by total time but are middle-of-the-pack per incident. Line 1 carries 56% of all delay time. Disorderly-patron delays peak at 9 PM, not rush hour. Built from the 28,191-record open-data file directly.
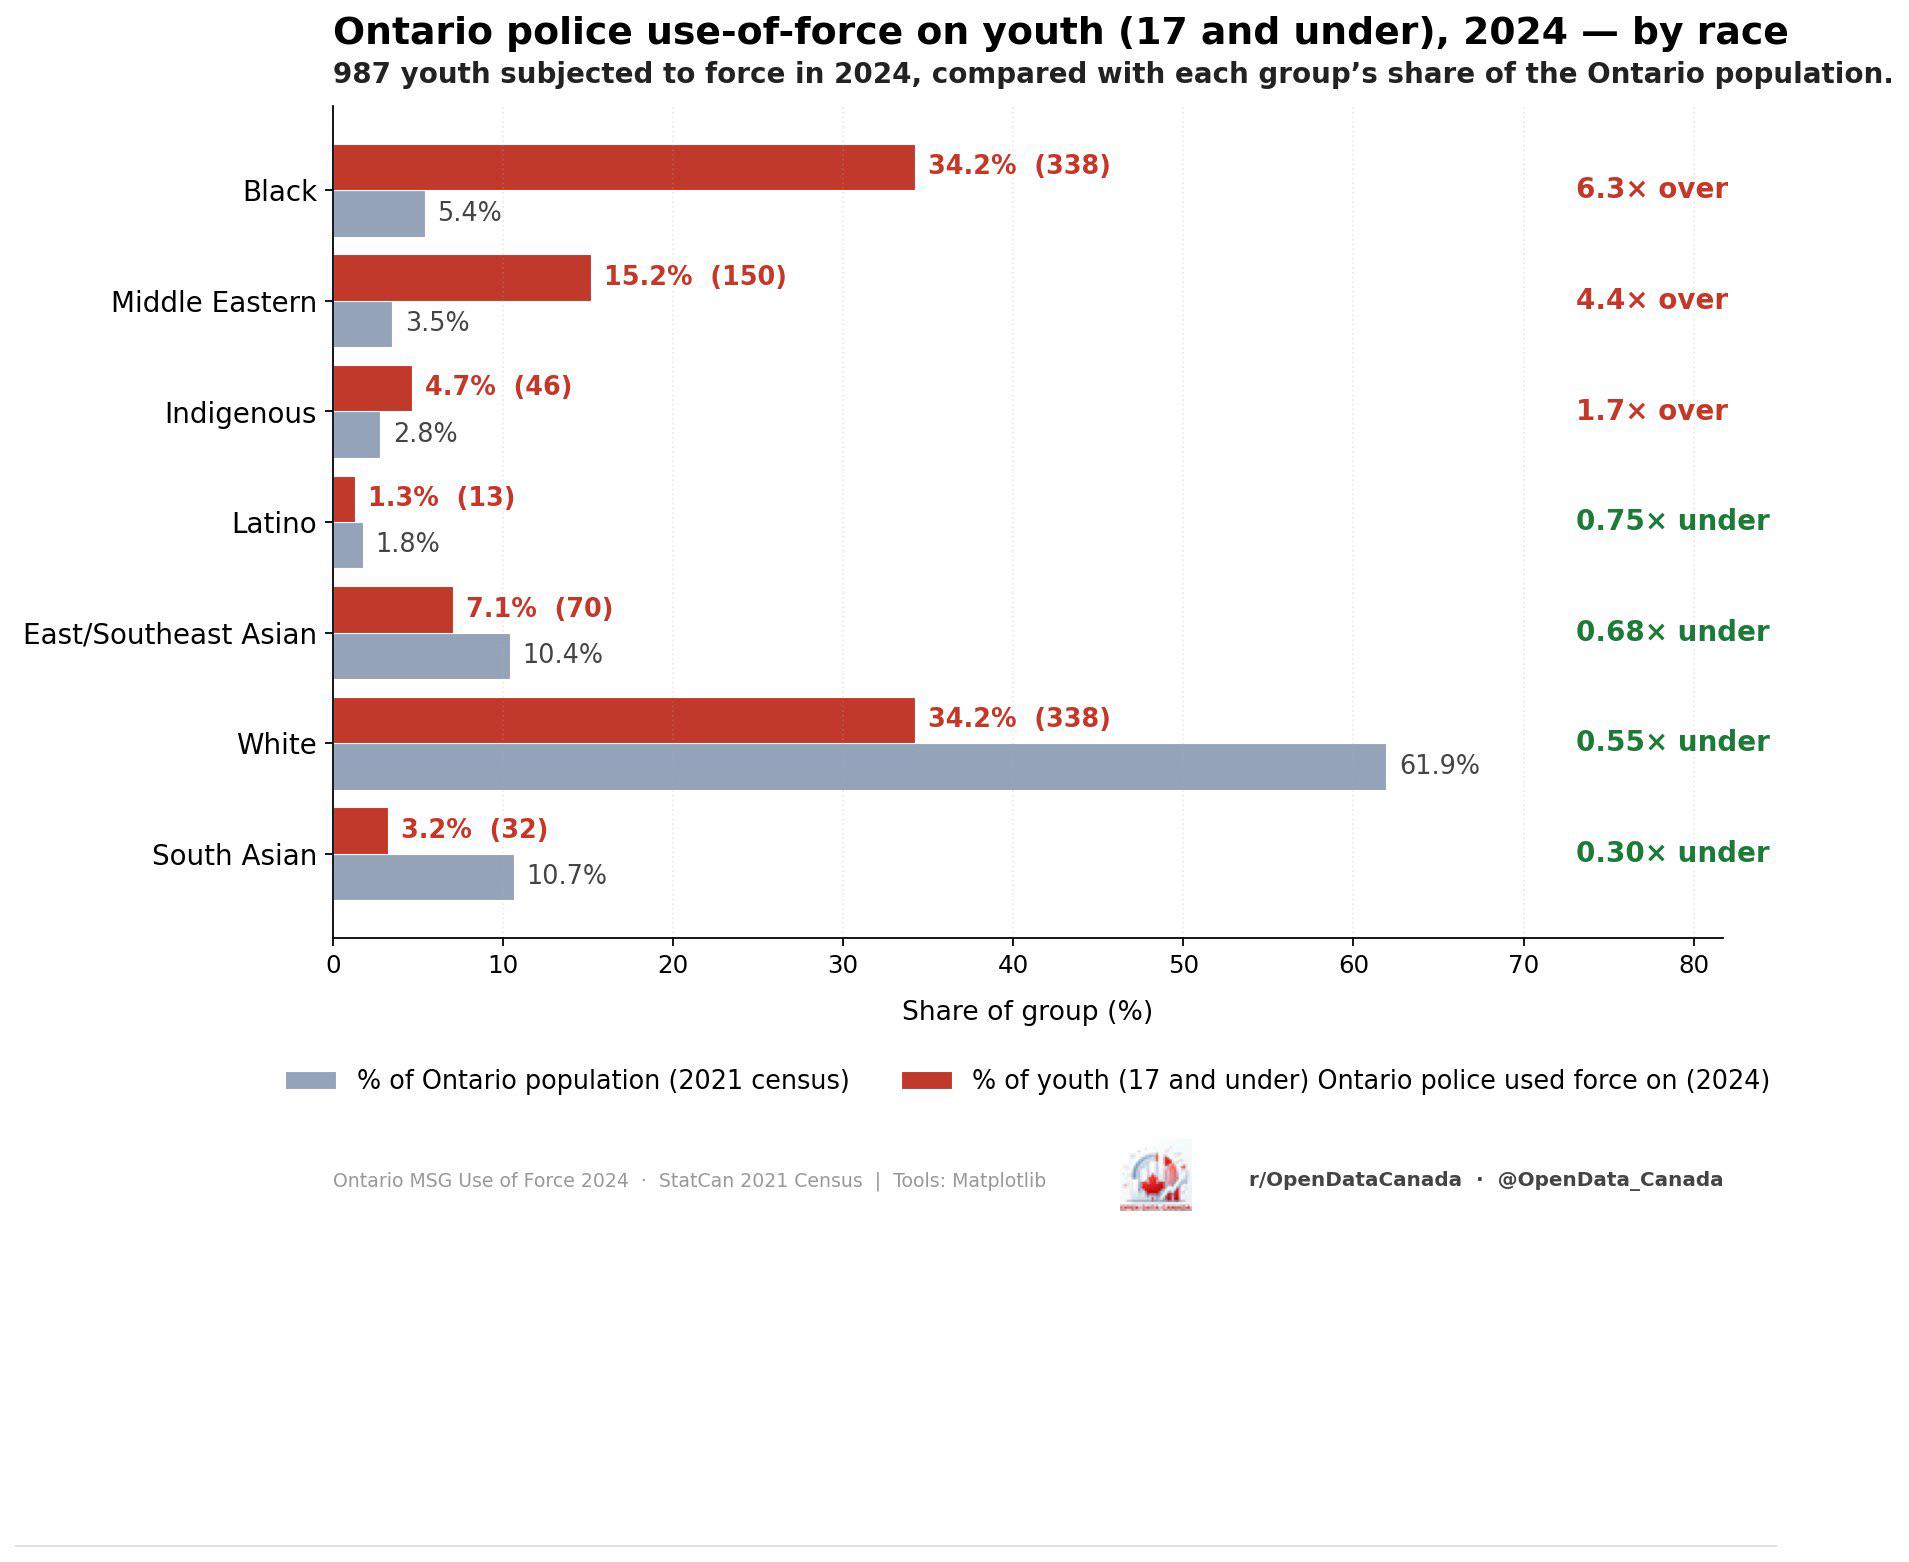
The 987 — what Ontario's 2024 police use-of-force data on youth says, and what it doesn't
Black youth 6.3× their population share. Middle Eastern 4.4×. Indigenous 1.7×. South Asian 0.30×. The four objections that survive scrutiny, and what the chart can and can't tell you about why.
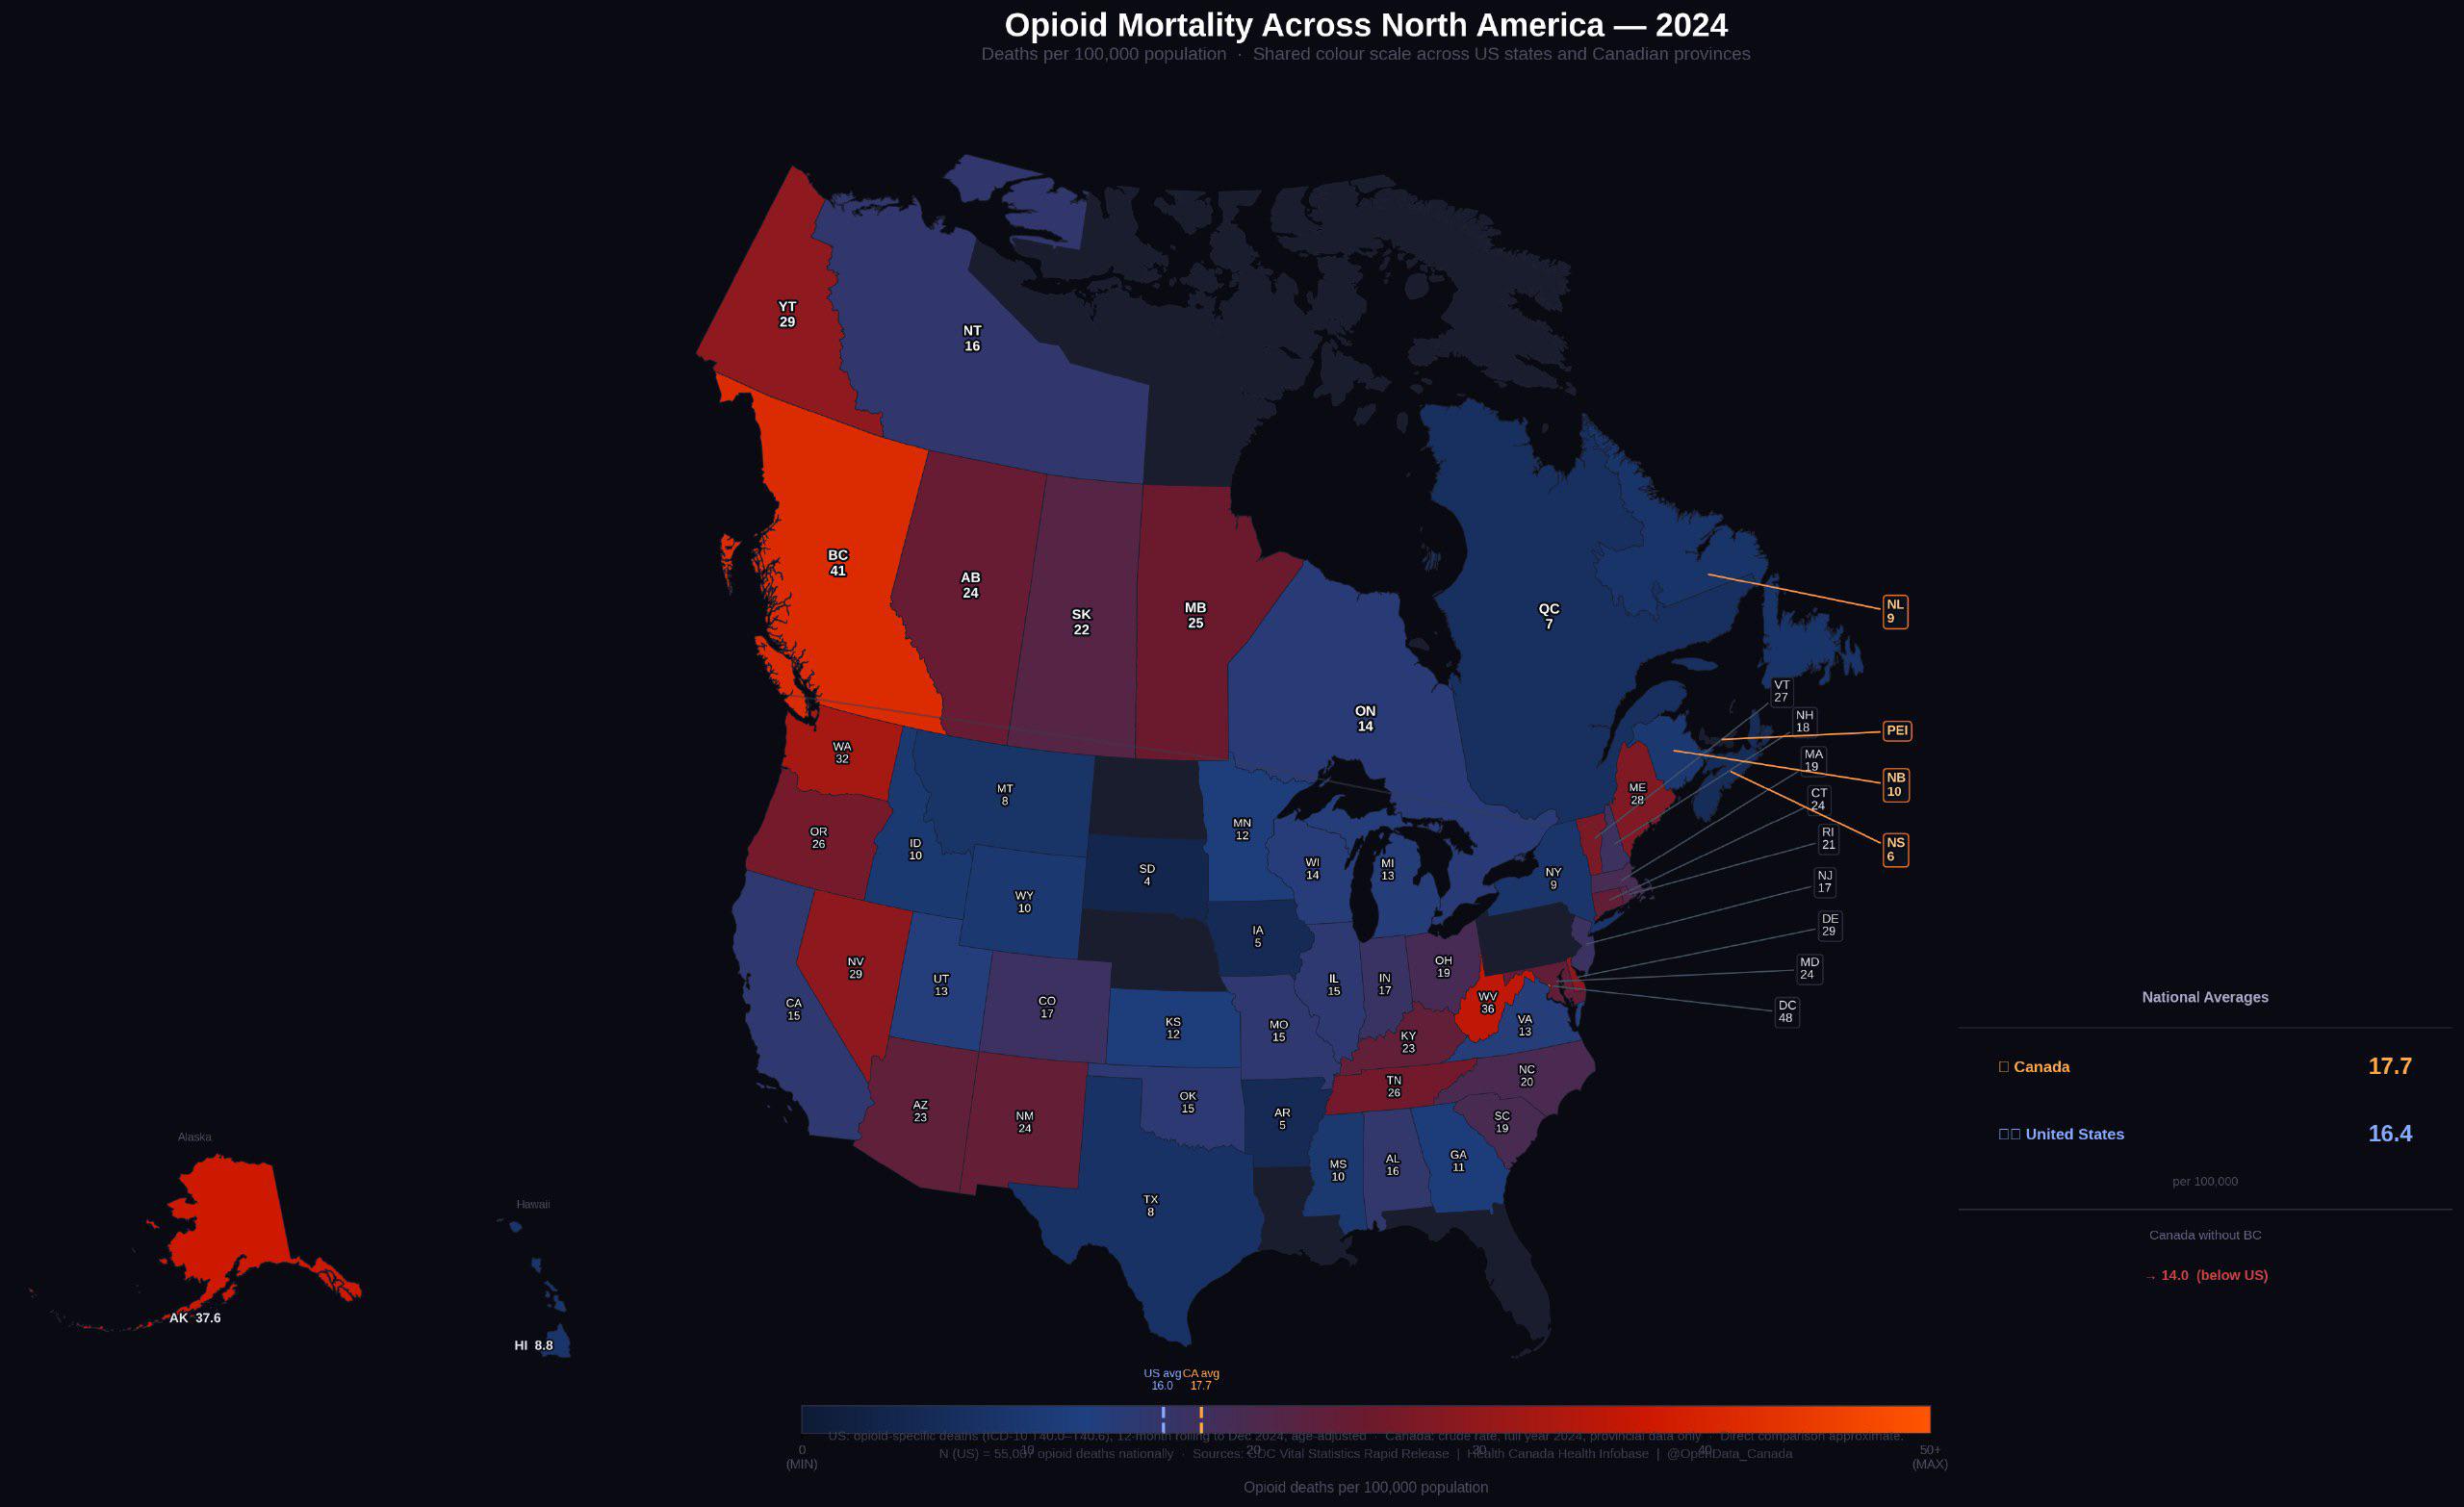
Why Canada's opioid death rate just passed the US — and why the headline misses the story
Canada at 17.7 per 100,000, the US at 16.4. Strip BC out of the Canadian total and Canada drops to 14.0, well below the US. The crisis is concentrated, not nationwide.
No articles in this topic yet — try another, or read everything.