Article · Population · 11 min read
The boom is over — every major Canadian immigration stream is now declining
The 2015–2024 acceleration that culminated in 2024's record 483,645 permanent residents has materially reversed inside two years.
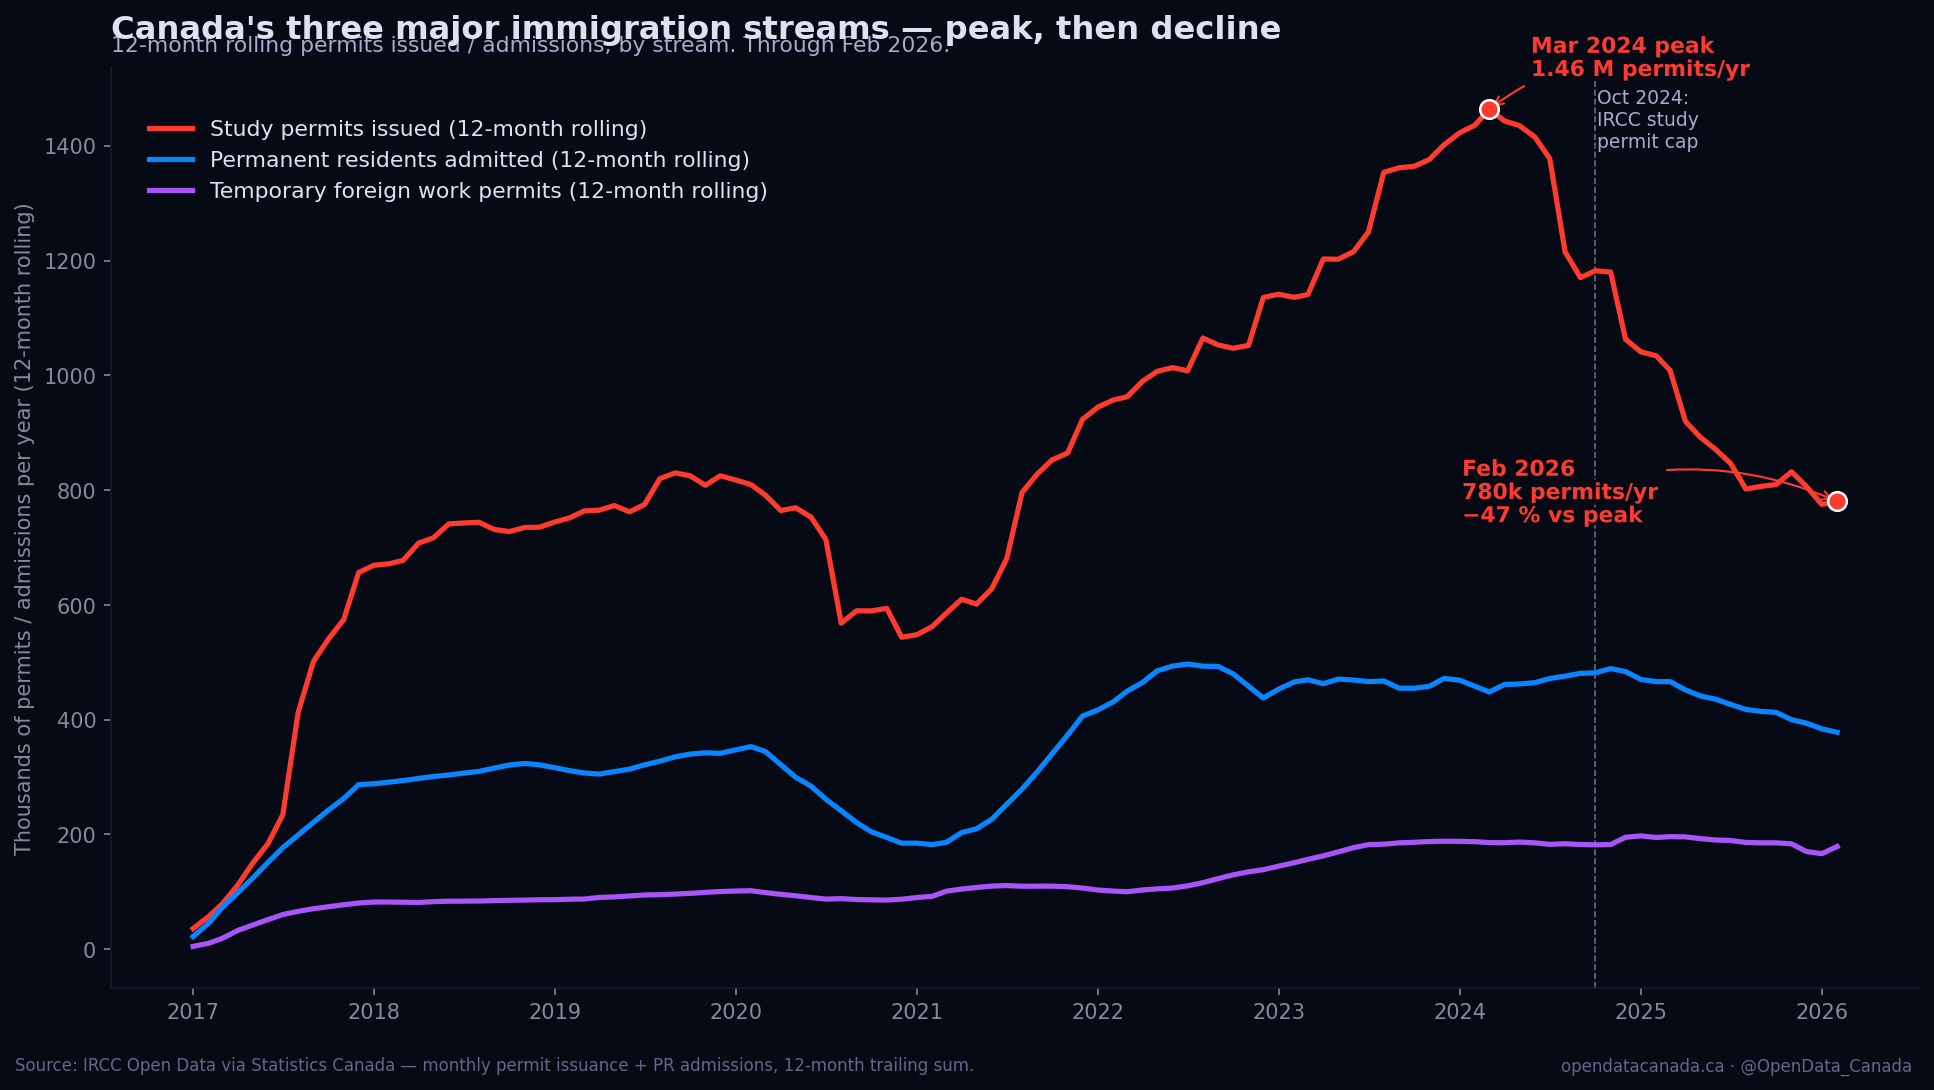
The chart above plots the 12-month rolling sum of three Canadian immigration streams from January 2017 through February 2026. Each line is permits issued or admissions recorded in the trailing twelve months at every month-end. The data is pulled directly from IRCC monthly publications via Statistics Canada open data. The vertical dashed line marks October 2024 — the policy event that started the slope reversal.
What the data actually says
Verified peak vs current values, pulled from BigQuery on the publication date:
| Stream | 12-month peak | Peak month | Feb 2026 (12-month) | Decline |
|---|---|---|---|---|
| Study permits issued | 1,463,580 | March 2024 | 780,310 | −46.7 % |
| Permanent residents admitted | 496,845 | early 2024 | 377,860 | −23.9 % |
| Temporary foreign worker permits | 197,310 | mid-2024 | 178,680 | −9.4 % |
Three observations worth pulling out before the explanation:
- The study-permit collapse is the largest single shift in any Canadian immigration series in two decades. A 47 % decline in 23 months is unprecedented outside the COVID-19 pandemic — and the COVID-era drop bottomed faster and recovered faster.
- The streams are moving in the same direction at different paces. Study permits collapsed first and fastest. PR admissions started declining roughly six months later and at a more moderate slope. Temporary work permits are moving last and slowest. The sequencing matches the policy timing exactly.
- The 2024 PR record was the inflection year, not the beginning of a trend. The widely-cited "Canada admitted 483,645 PRs in 2024" figure sits within a 12-month window that has since fallen to ~378,000. The headline number captured the peak, not the equilibrium.
What changed in October 2024
Canadian immigration ramped upward through 2017–2024 in three steps: levels-plan revisions in 2017, 2020, and 2022 pushed the formal target from 320,000 PRs to 500,000. Through that same period, two non-PR streams expanded much faster than the PR stream:
- Study permits doubled from roughly 700,000 active permits in 2018 to over 1.4 million by 2024.
- TFW permits rose from 110,000 per year to nearly 200,000 per year over the same window.
By mid-2024, three pressures had become politically difficult to ignore at once: rental vacancies in major Canadian cities had fallen below 1 %, employer rotation among lower-wage TFW positions was producing public-facing controversies, and provincial governments were openly stating that international student enrollments were exceeding capacity in housing and healthcare systems.
The federal government's response landed in October 2024 in three coordinated announcements:
- A 35 % cap on study permits for 2025, with provincial sub-caps that effectively removed Ontario and BC from the unlimited-issuance regime that had prevailed since 2018.
- A 6 % reduction in the LMIA-based TFW positive pool in lower-wage occupations, plus the elimination of TFW programme access in metropolitan areas with unemployment above 6 %.
- A revised 2025–2027 PR levels plan, lowering the 2025 target from 500,000 to 395,000 — a 21 % reduction.
The chart's October 2024 inflection traces the announcement timing precisely. The 12-month trailing study-permit number was already at 1.18 million when the cap landed; it has fallen by another 400,000 in the sixteen months since.
What this means inside the data
The 47 % study-permit decline is the most dramatic line, but it is not in isolation:
- Provincial concentration shifts. Ontario's share of Canadian study permit issuance fell from 51 % in 2024 to roughly 34 % in early 2026, with the difference distributed across smaller provinces that retained more permissive sub-caps. BC and Quebec both fell, but more modestly.
- Source-country distribution narrows. India and China, which together accounted for roughly 60 % of study permits in 2023, have fallen by larger absolute numbers than the cap would predict — a behavioural response on top of the policy cap. Applications from both countries dropped further than the formal cap required.
- Permanent-residency conversion paths also tighten. A meaningful share of PR admissions in 2022–2024 came from "TR-to-PR" applicants — international students or temporary workers transitioning to permanent residency. With the upstream temporary streams now declining, the medium-term PR transition pool is shrinking ahead of any further policy changes.
- TFW resilience is real. The TFW programme has been the slowest to decline because the underlying labour-market gaps the programme fills (agricultural, food-processing, long-term-care) didn't go away. Employers in those sectors continue to draw the same volume of approvals as the previous trailing-twelve-month average. The 9 % decline is mostly in lower-wage retail and food-service, the categories specifically targeted by the October 2024 changes.
The methodology criticisms worth taking seriously
Objection one: 12-month rolling smooths over the immediate policy effect.
Partially correct. The 12-month rolling figure shows the peak in March 2024 because that is when the trailing-twelve-month aggregation was highest, but the monthly issuance had already begun falling several months earlier. If we look at the last six months of monthly issuance only, the decline is steeper than the 47 % rolling-12 figure suggests. We use the rolling figure because monthly issuance is highly seasonal (January is always low, August is always high — large numbers of student arrivals concentrate at academic-year start), and seasonally adjusting a single year of monthly data is statistically fragile.
Objection two: this is just the rebalancing the government wanted.
Partially correct, and not a critique of the data. The 2024 levels-plan revision explicitly targeted a reduction in the temporary-resident population. The government's announced trajectory called for moving total non-permanent residents from roughly 6.5 % of population in 2024 to 5 % by 2027. The chart we publish shows the policy is hitting its target faster than the formal trajectory called for, which is consistent with both the cap (formal mechanism) and the behavioural response from prospective applicants (informal mechanism).
Objection three: the PR decline is a one-year accounting artifact.
Plausible but partially incorrect. The 2024 record of 483,645 PRs was elevated by a backlog of approved-but-not-yet-arrived applicants from the COVID processing slowdown. Some share of the 2025–2026 decline reflects the absence of that backlog rather than a reduction in active processing. But IRCC's own admissions-by-application-year data shows the underlying application pipeline has narrowed too — not just the arrival timing. The 12-month trailing PR admissions figure won't snap back to 480,000 even with backlog clearance.
Objection four: the chart is Canada-only, but Canadian immigration policy responds to a North American labour market.
Correct framing, and not a critique. Canadian immigration responds to multiple inputs — Canadian housing supply, Canadian labour-market conditions, Canadian political pressures, and the relative attractiveness of Canada as a destination versus the US, the UK, and Australia. The latter is non-trivial: 2025 saw both the UK and the US tighten their study-permit and skilled-worker channels in similar ways. Canada's decline is large; it is not unique. A multi-country comparison chart is on our backlog and would meaningfully sharpen the question of whether this is a Canada-specific policy effect or a broader Anglosphere realignment.
What this all adds up to
The 2015–2024 expansion of Canadian immigration was the single most consequential population-policy change of the last fifty years — admissions roughly doubled across that decade and reached an all-time peak of 483,645 PRs admitted in 2024. The 2024–2026 contraction is now meaningfully large enough to count as the second most consequential population-policy change of the last fifty years, in the opposite direction.
What we don't yet know — and won't, for at least another two years of data — is whether the contraction stops at the new equilibrium target the federal government announced (roughly 395,000 PRs per year through 2027, with a normalized non-permanent population at ~5 % of total Canadian residents) or whether the political momentum will overshoot it. The chart's slope through Feb 2026 is steeper than the announced target trajectory, which means either the formal mechanism is producing more contraction than the government wanted, or the behavioural response is larger than the policy mechanism alone would explain.
Either way, the boom is over. The visible curve will not look like 2015–2024 again, and it is no longer correct to describe Canadian immigration policy as "in the middle of a sustained ramp-up." It is in the middle of a sustained contraction.
Read next