Trade · Energy · Chart
95.6% — the share of Canadian crude oil exports that go to a single buyer
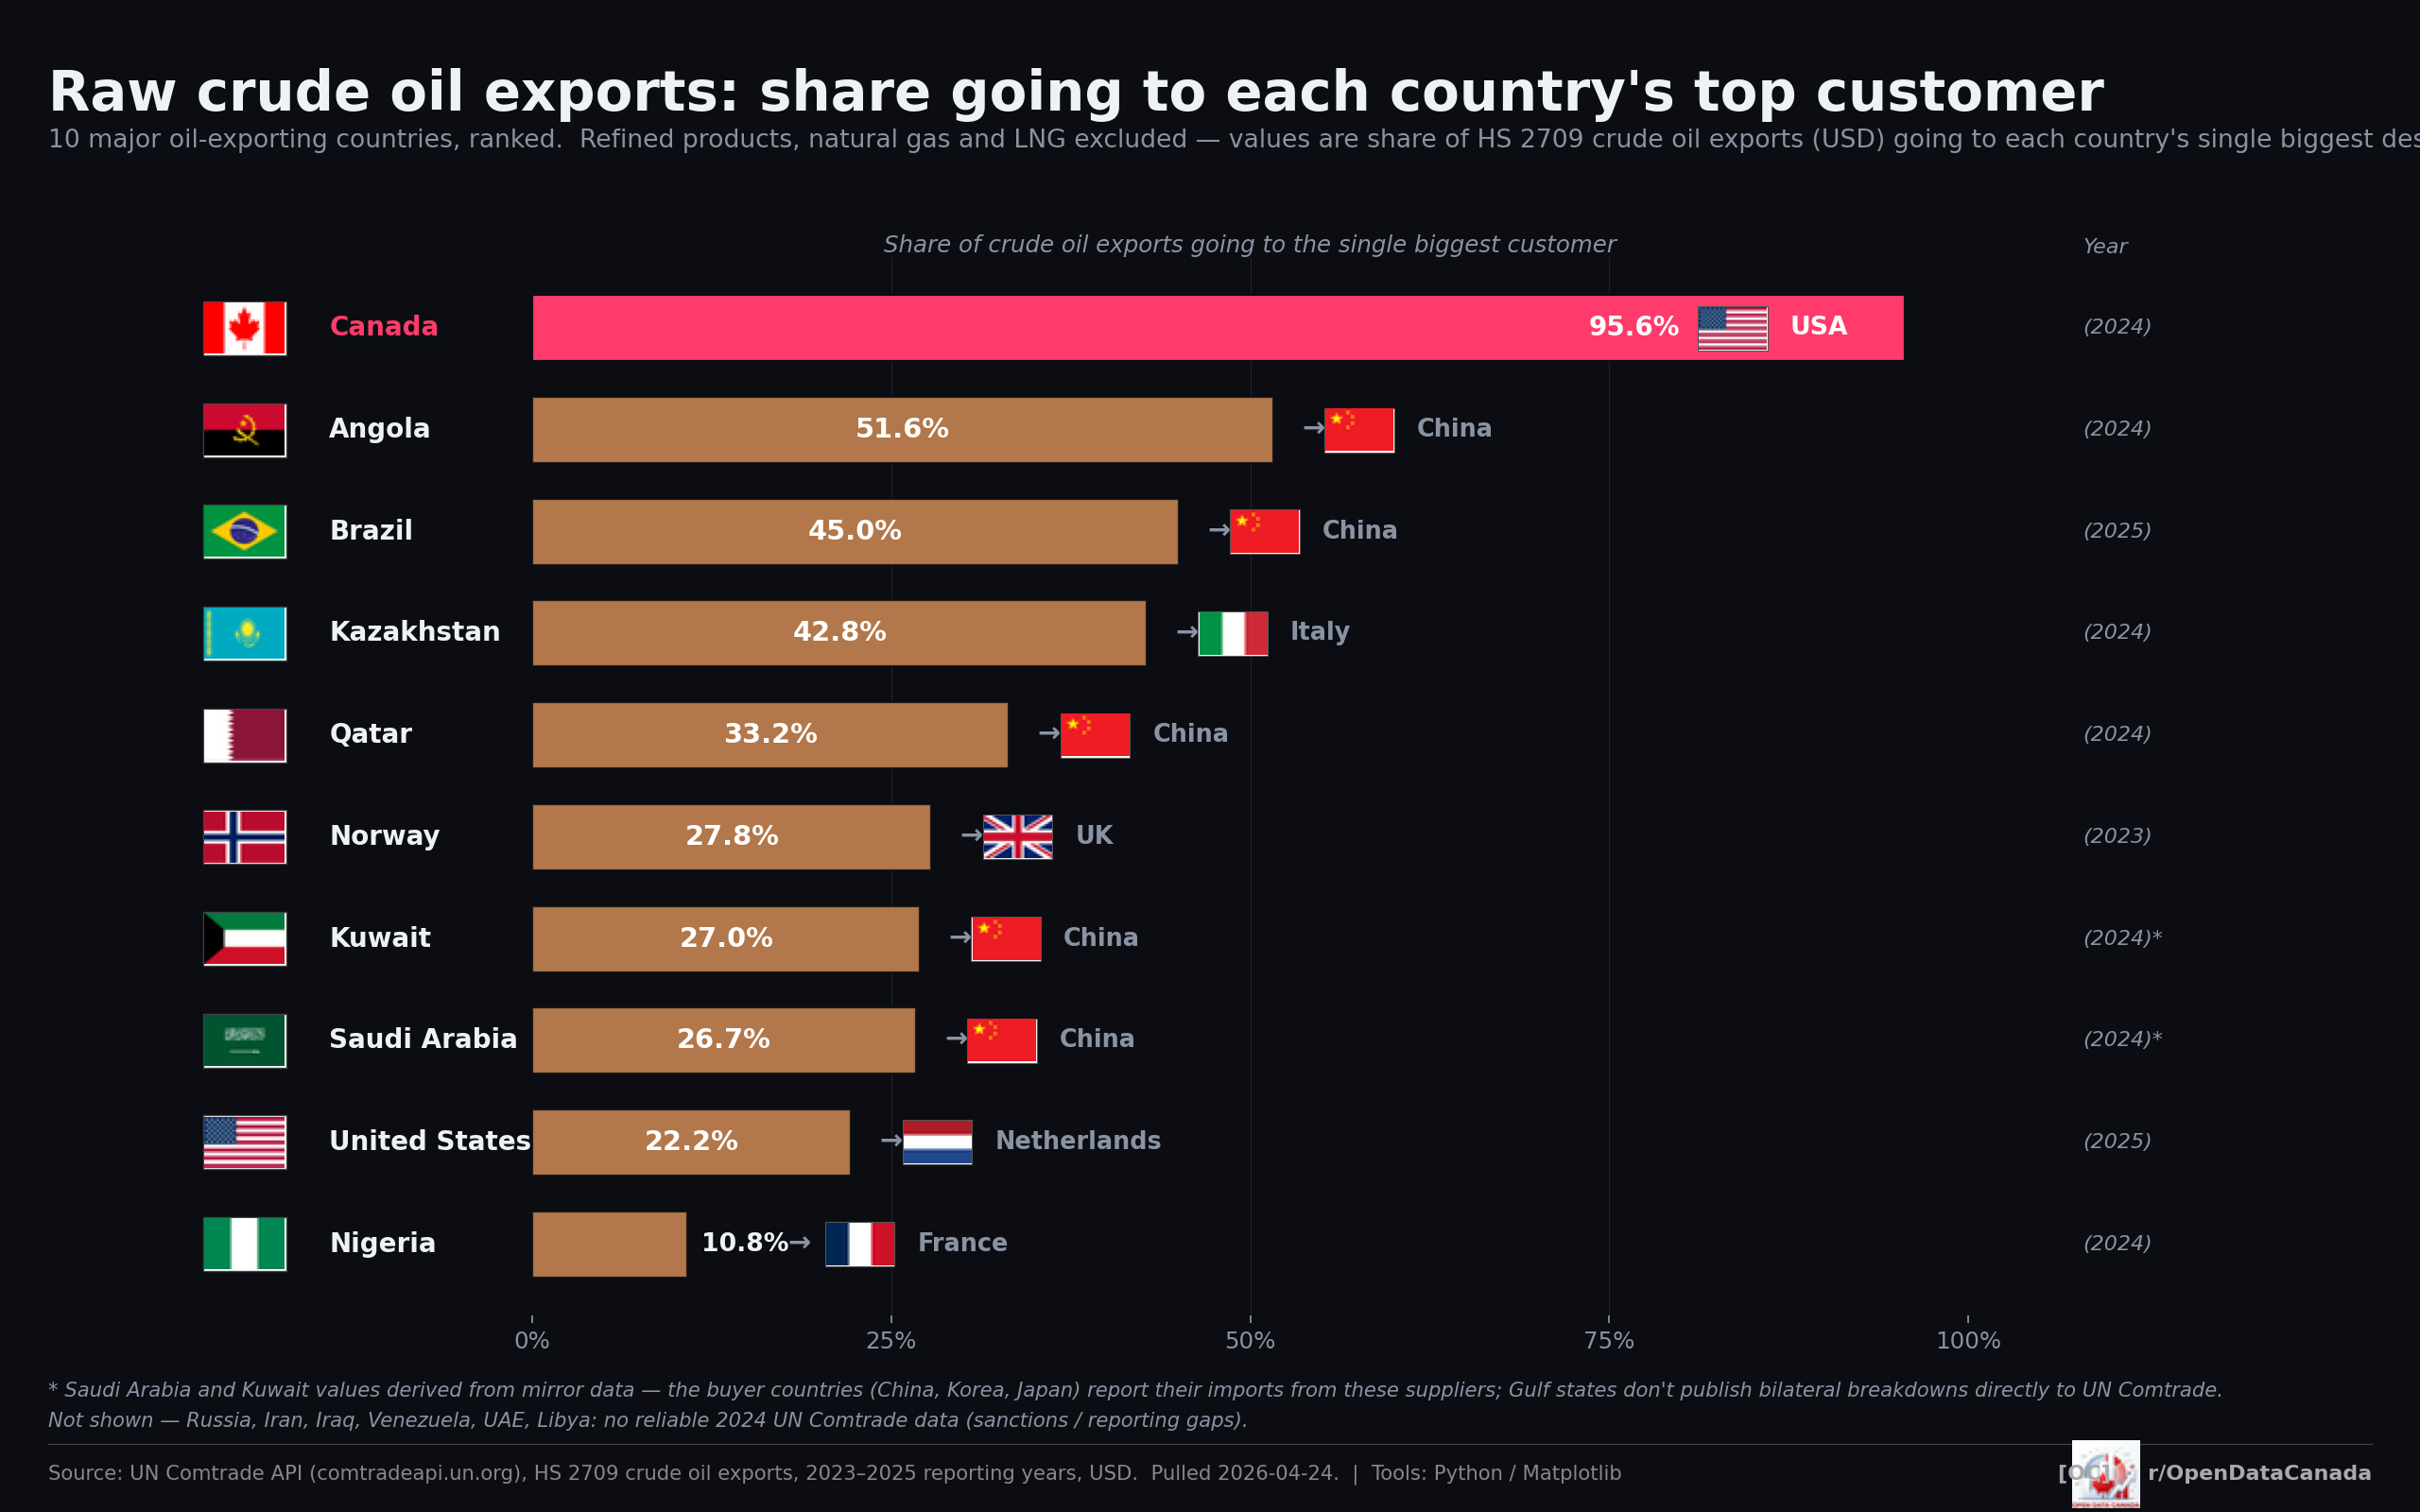
In 2024, 95.6 % of Canada's raw crude oil exports went to the United States. No other major oil-exporting country comes close. Angola and Brazil — the next-most-concentrated exporters — sit around 50 %. Norway, Saudi Arabia, and Kuwait sit in the high 20s.
What the chart shows
The chart ranks the ten largest oil-exporting countries by what share of their raw crude exports go to their single biggest customer. Refined products, natural gas, and LNG are excluded — this is HS code 2709 only, the unrefined-crude line.
| Exporter | Top customer | Share to top customer |
|---|---|---|
| Canada | USA | 95.6 % (2024) |
| Angola | China | 51.6 % (2024) |
| Brazil | China | 45.0 % (2025) |
| Kazakhstan | Italy | 42.8 % (2024) |
| Qatar | China | 33.2 % (2024) |
| Norway | UK | 27.8 % (2023) |
| Kuwait | China | 27.0 % (2024 ★) |
| Saudi Arabia | China | 26.7 % (2024 ★) |
| United States | Netherlands | 22.2 % (2025) |
| Nigeria | France | 10.8 % (2024) |
The Canadian figure is roughly twice the second-most-concentrated exporter. It is roughly nine times the Nigerian figure at the bottom of the table. There is no other major exporter whose dependence on a single customer is meaningfully comparable.
Why this matters
The 95.6 % is structural, not commercial. Canadian crude reaches the United States primarily by pipeline — Enbridge Mainline, Keystone, the southern leg of TC Energy's network — built over decades to a refining complex that is calibrated for heavy Canadian grades. Selling the same barrel to a non-US buyer requires either tanker capacity from Canadian coastal terminals (which the Trans Mountain Expansion partially addressed in May 2024) or a pipeline route that does not currently exist (Energy East was cancelled in 2017; Northern Gateway was cancelled in 2016). The dependence is not a marketing failure; it is the consequence of a one-direction physical network.
The May 2024 commissioning of the Trans Mountain Expansion is the first material change to this picture in two decades. It tripled Pacific oil capacity and moved Canada's Asia share from roughly 0 % to roughly 10 % of total crude exports — a meaningful diversification, but not enough to materially shift the headline 95.6 % to the United States.
What the chart can't tell you
The chart shows current dependence; it does not show the elasticity of that dependence to a tariff, an embargo, or a price war. Two things are unanswerable from this single image:
- How much of the 95.6 % could practically be redirected within 12–24 months. The Trans Mountain Expansion adds 590,000 barrels per day of westbound capacity; current Asian flows are roughly 453,000 barrels per day. The remaining capacity is meaningful but not transformational on the share denominator.
- What the real US price discount is for Canadian crude. Western Canadian Select trades at a structural discount to West Texas Intermediate, partly because of pipeline congestion, partly because of grade differences, partly because the buyer concentration shifts pricing power. The chart does not separate those three factors.
A follow-up explainer on each of those is on the methodology backlog.
Read next