Category
Justice
Crime rates, policing, courts, incarceration. The data with the methodology caveats stated up front, because the numbers in this category are easy to misread.

Fraud used to be solved like a violent crime. Now it almost never is.
In 1998, Canadian police cleared 60% of reported frauds — on par with how often they cleared a sexual assault that year. By 2025, that number is 10.3%, the largest decline of any offence among the 17 major categories we examined. It's happening against a backdrop of its own: the national violent-crime clearance rate bottomed at a 28-year low in 2023 and has only partly recovered since.
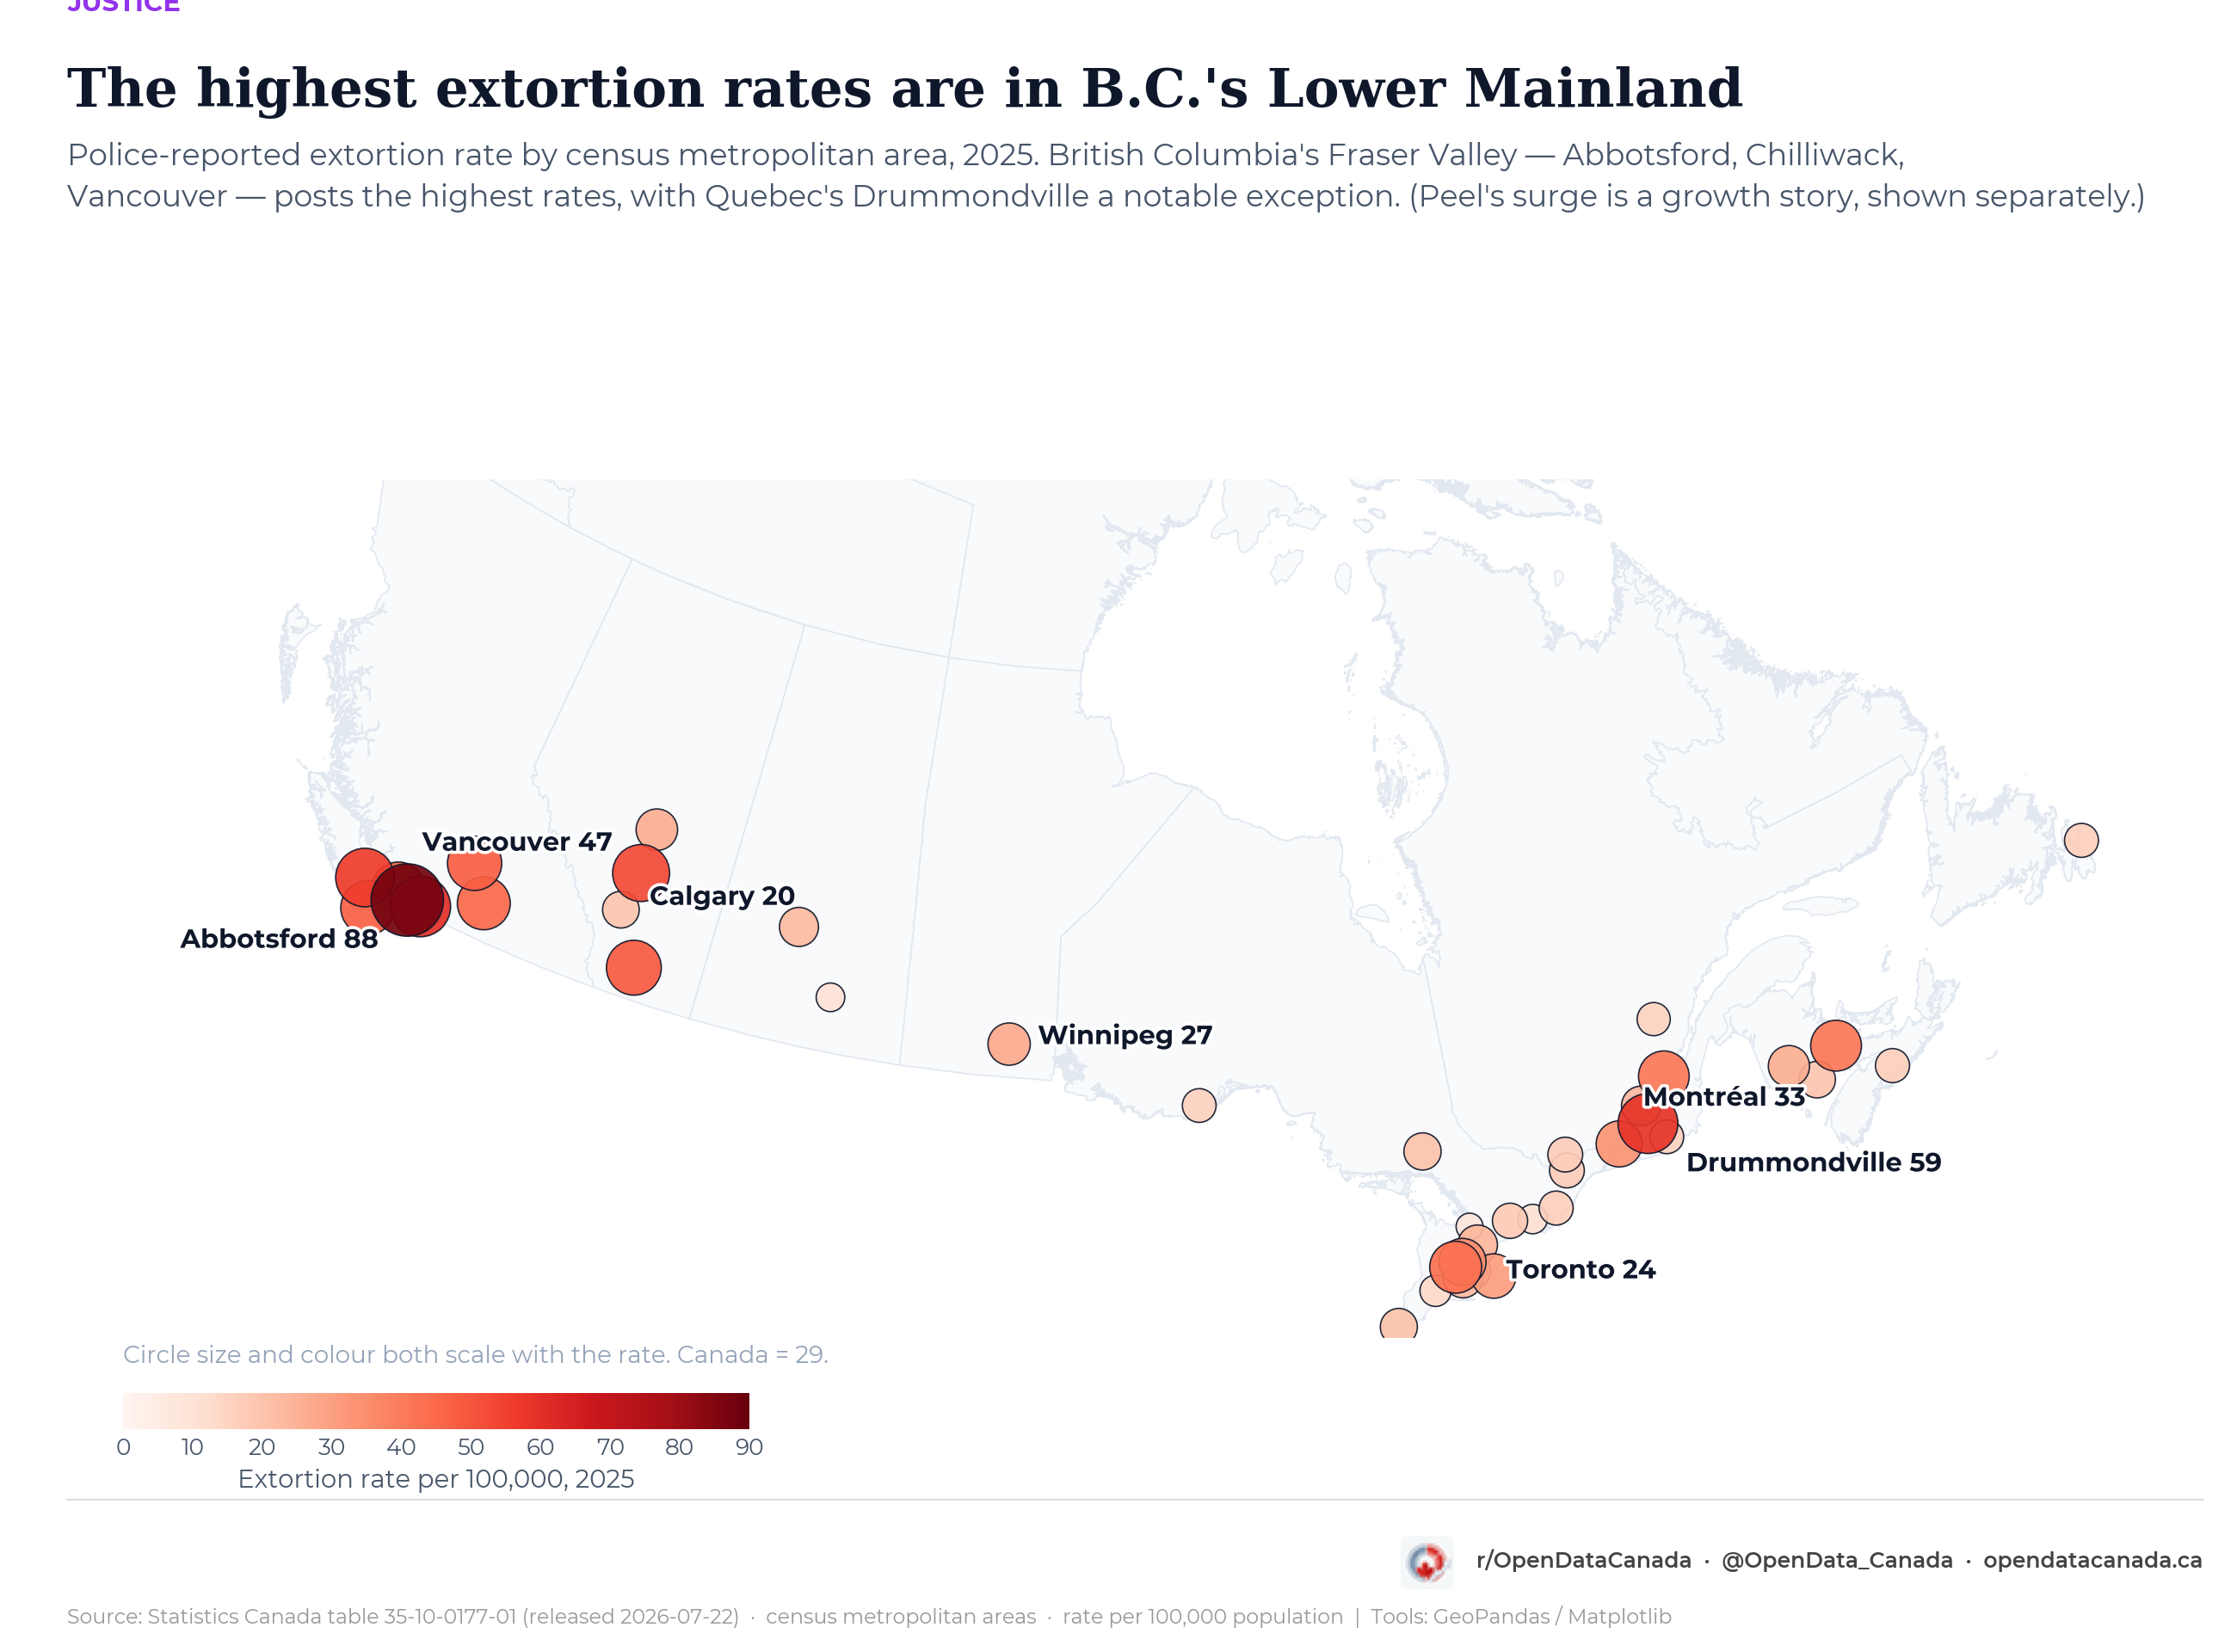
Extortion has more than quadrupled in Canada since 2000 — and in Peel it has risen tenfold
Robbery has been halved and attempted murder sits at a 28-year low, but extortion has quadrupled in a generation. It has come off its 2023 national peak, yet stays concentrated in B.C.'s Fraser Valley and in Peel, where it is still climbing.
More cops, less crime? Not in Canadian cities.
Calgary spends roughly a third less per resident on policing than Montréal, and has less violent crime to show for it. Across 29 major Canadian metropolitan areas, the correlation between officers per 100,000 residents and the violent Crime Severity Index is essentially zero. Built from the 2025 Police Administration Survey, released Wednesday.
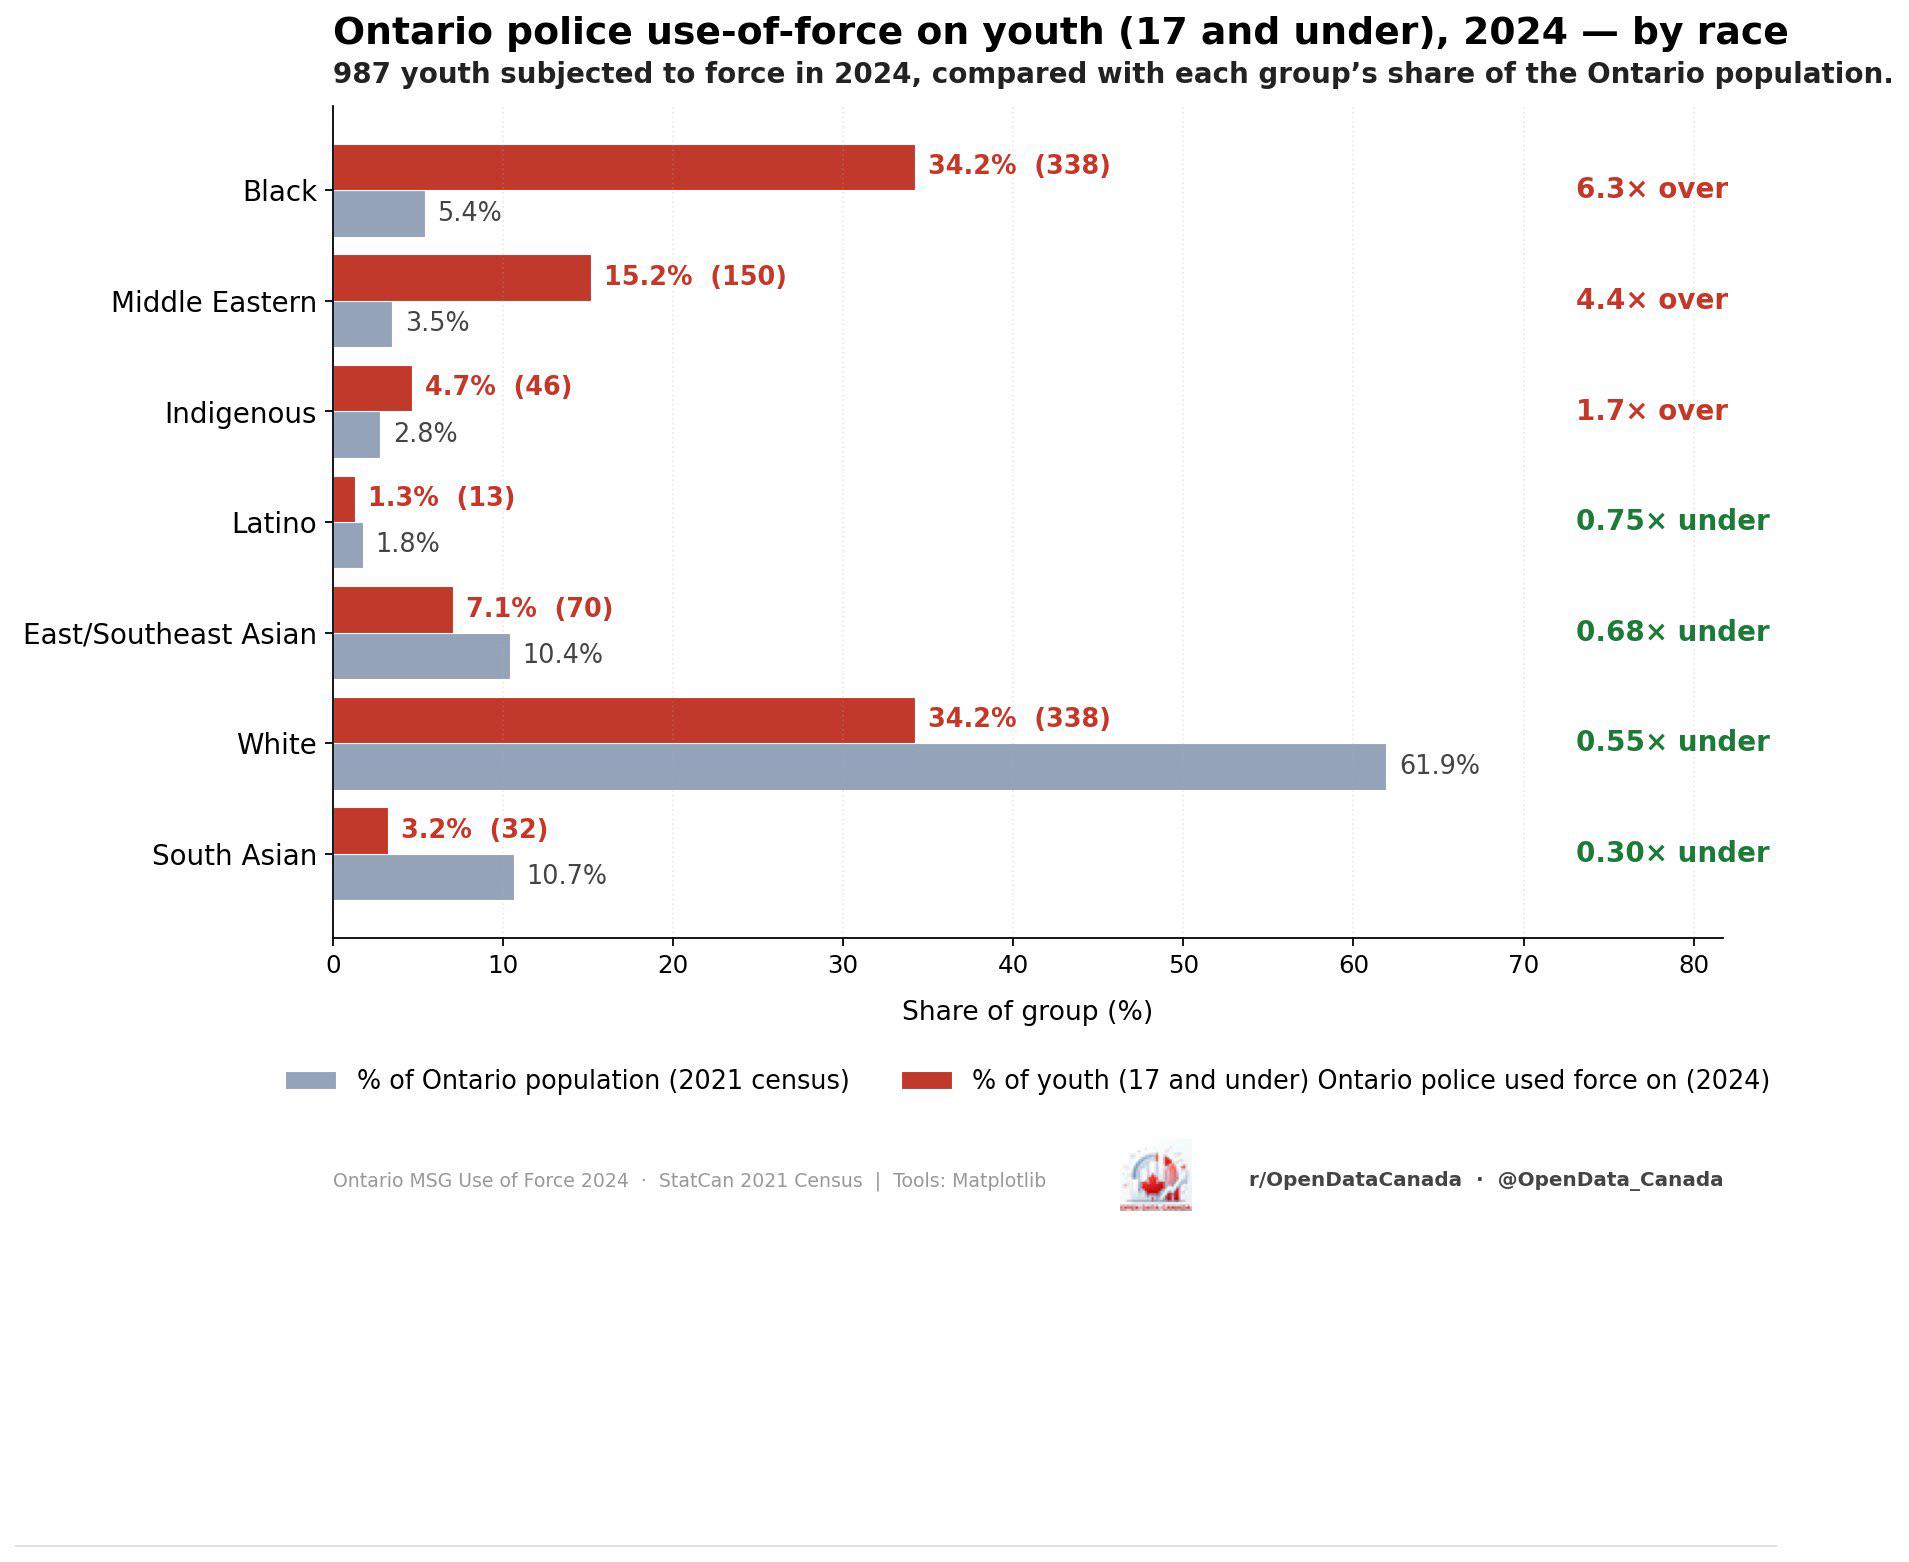
The 987 — what Ontario's 2024 police use-of-force data on youth says
Black youth 6.3× their population share. Middle Eastern 4.4×. Indigenous 1.7×. The four objections that survive scrutiny, and what the chart can and can't tell you.
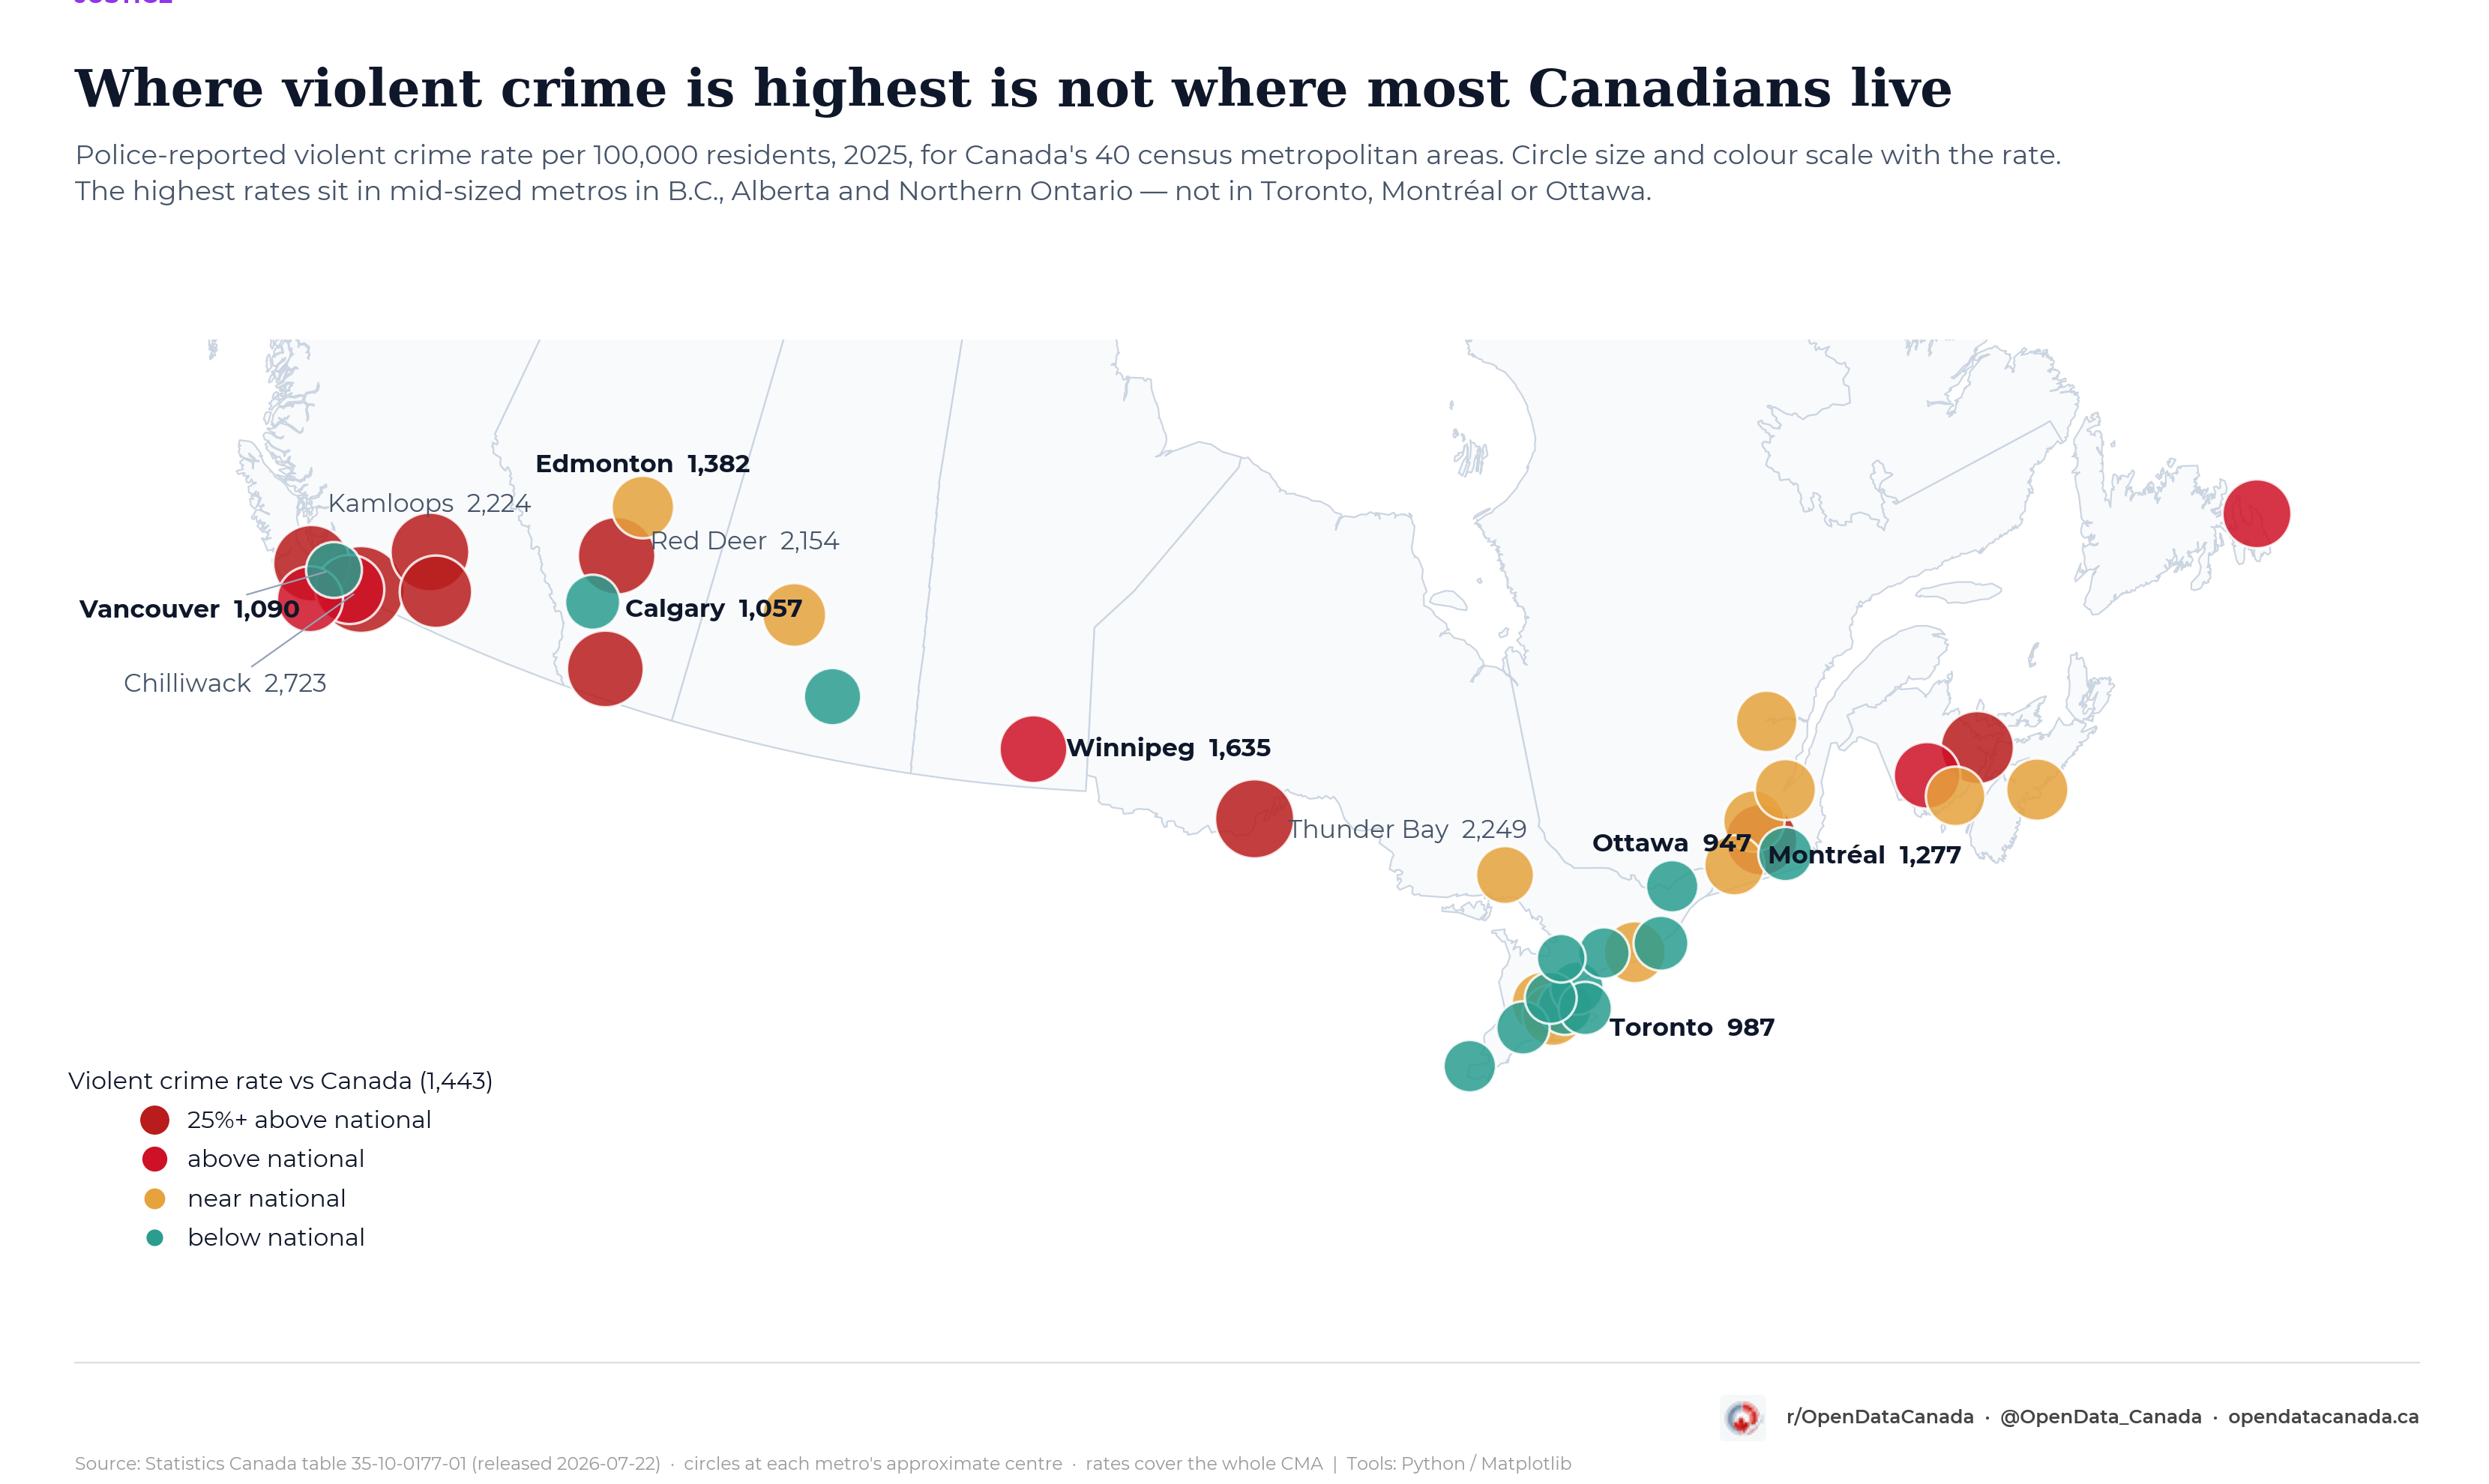
Canada's most violent cities are not its biggest ones
Chilliwack, Thunder Bay and Kamloops top the list; Toronto ranks 33rd of 40, Ottawa-Gatineau 37th. Property crime has fallen in every metro with a full record, even where violent crime has climbed back. Search and sort all 40 metros. From table 35-10-0177-01, released 22 July 2026.