
Category
Transit
How Canadians actually get around, measured from the operators' own records. Delay logs, project schedules, and ridership counts — the open-data files behind the commute.
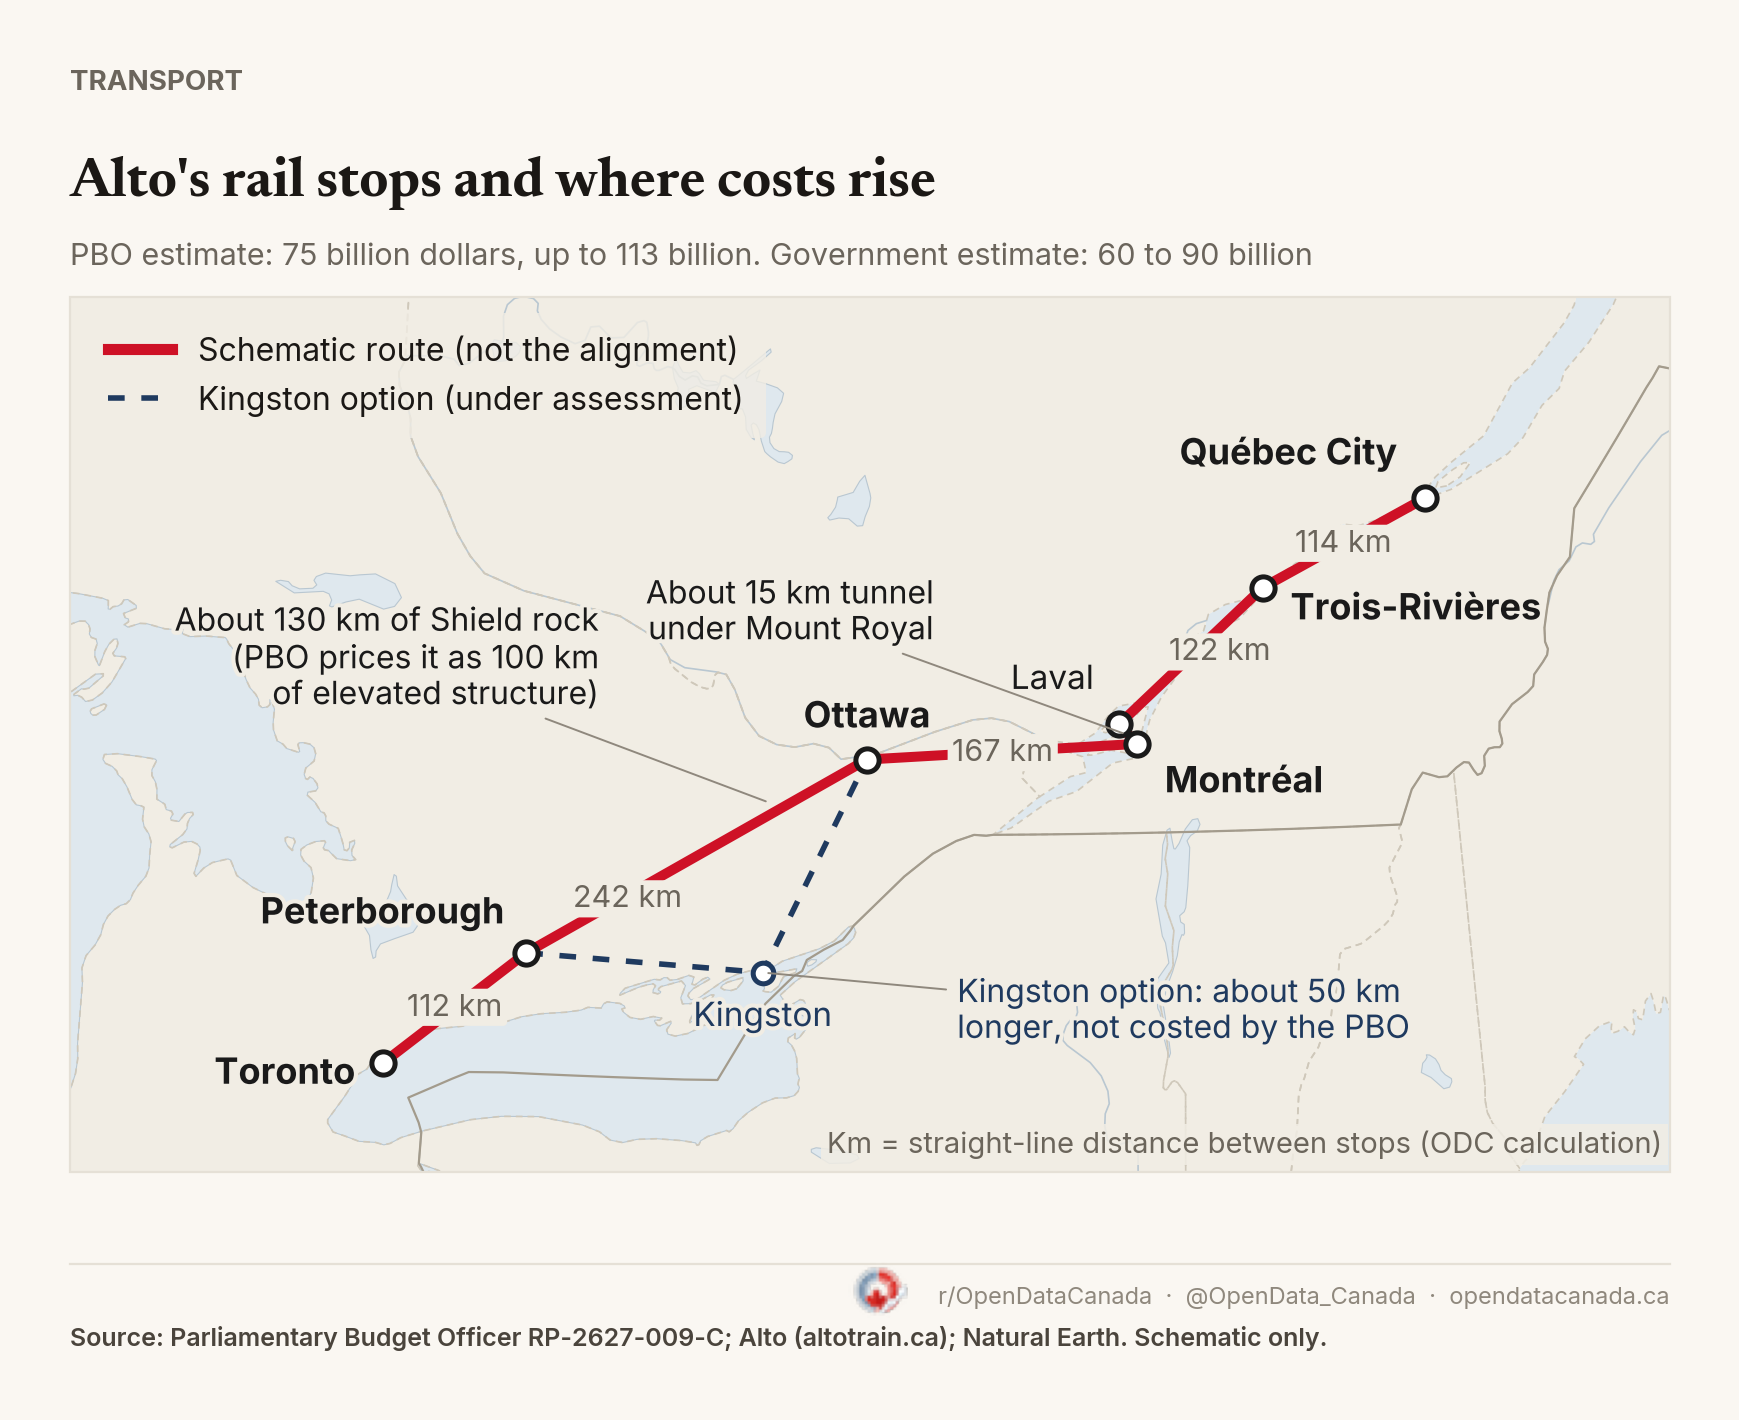
Alto's High-Speed Rail Map: Seven Stops, a 15-km Tunnel and 130 km of Canadian Shield
Alto plans a Toronto to Québec City line with seven stops, but has not published an alignment. The Parliamentary Budget Officer's cost estimate of 75 to 113 billion dollars names the two stretches it treats as cost drivers: a tunnel under Mount Royal and the Canadian Shield.
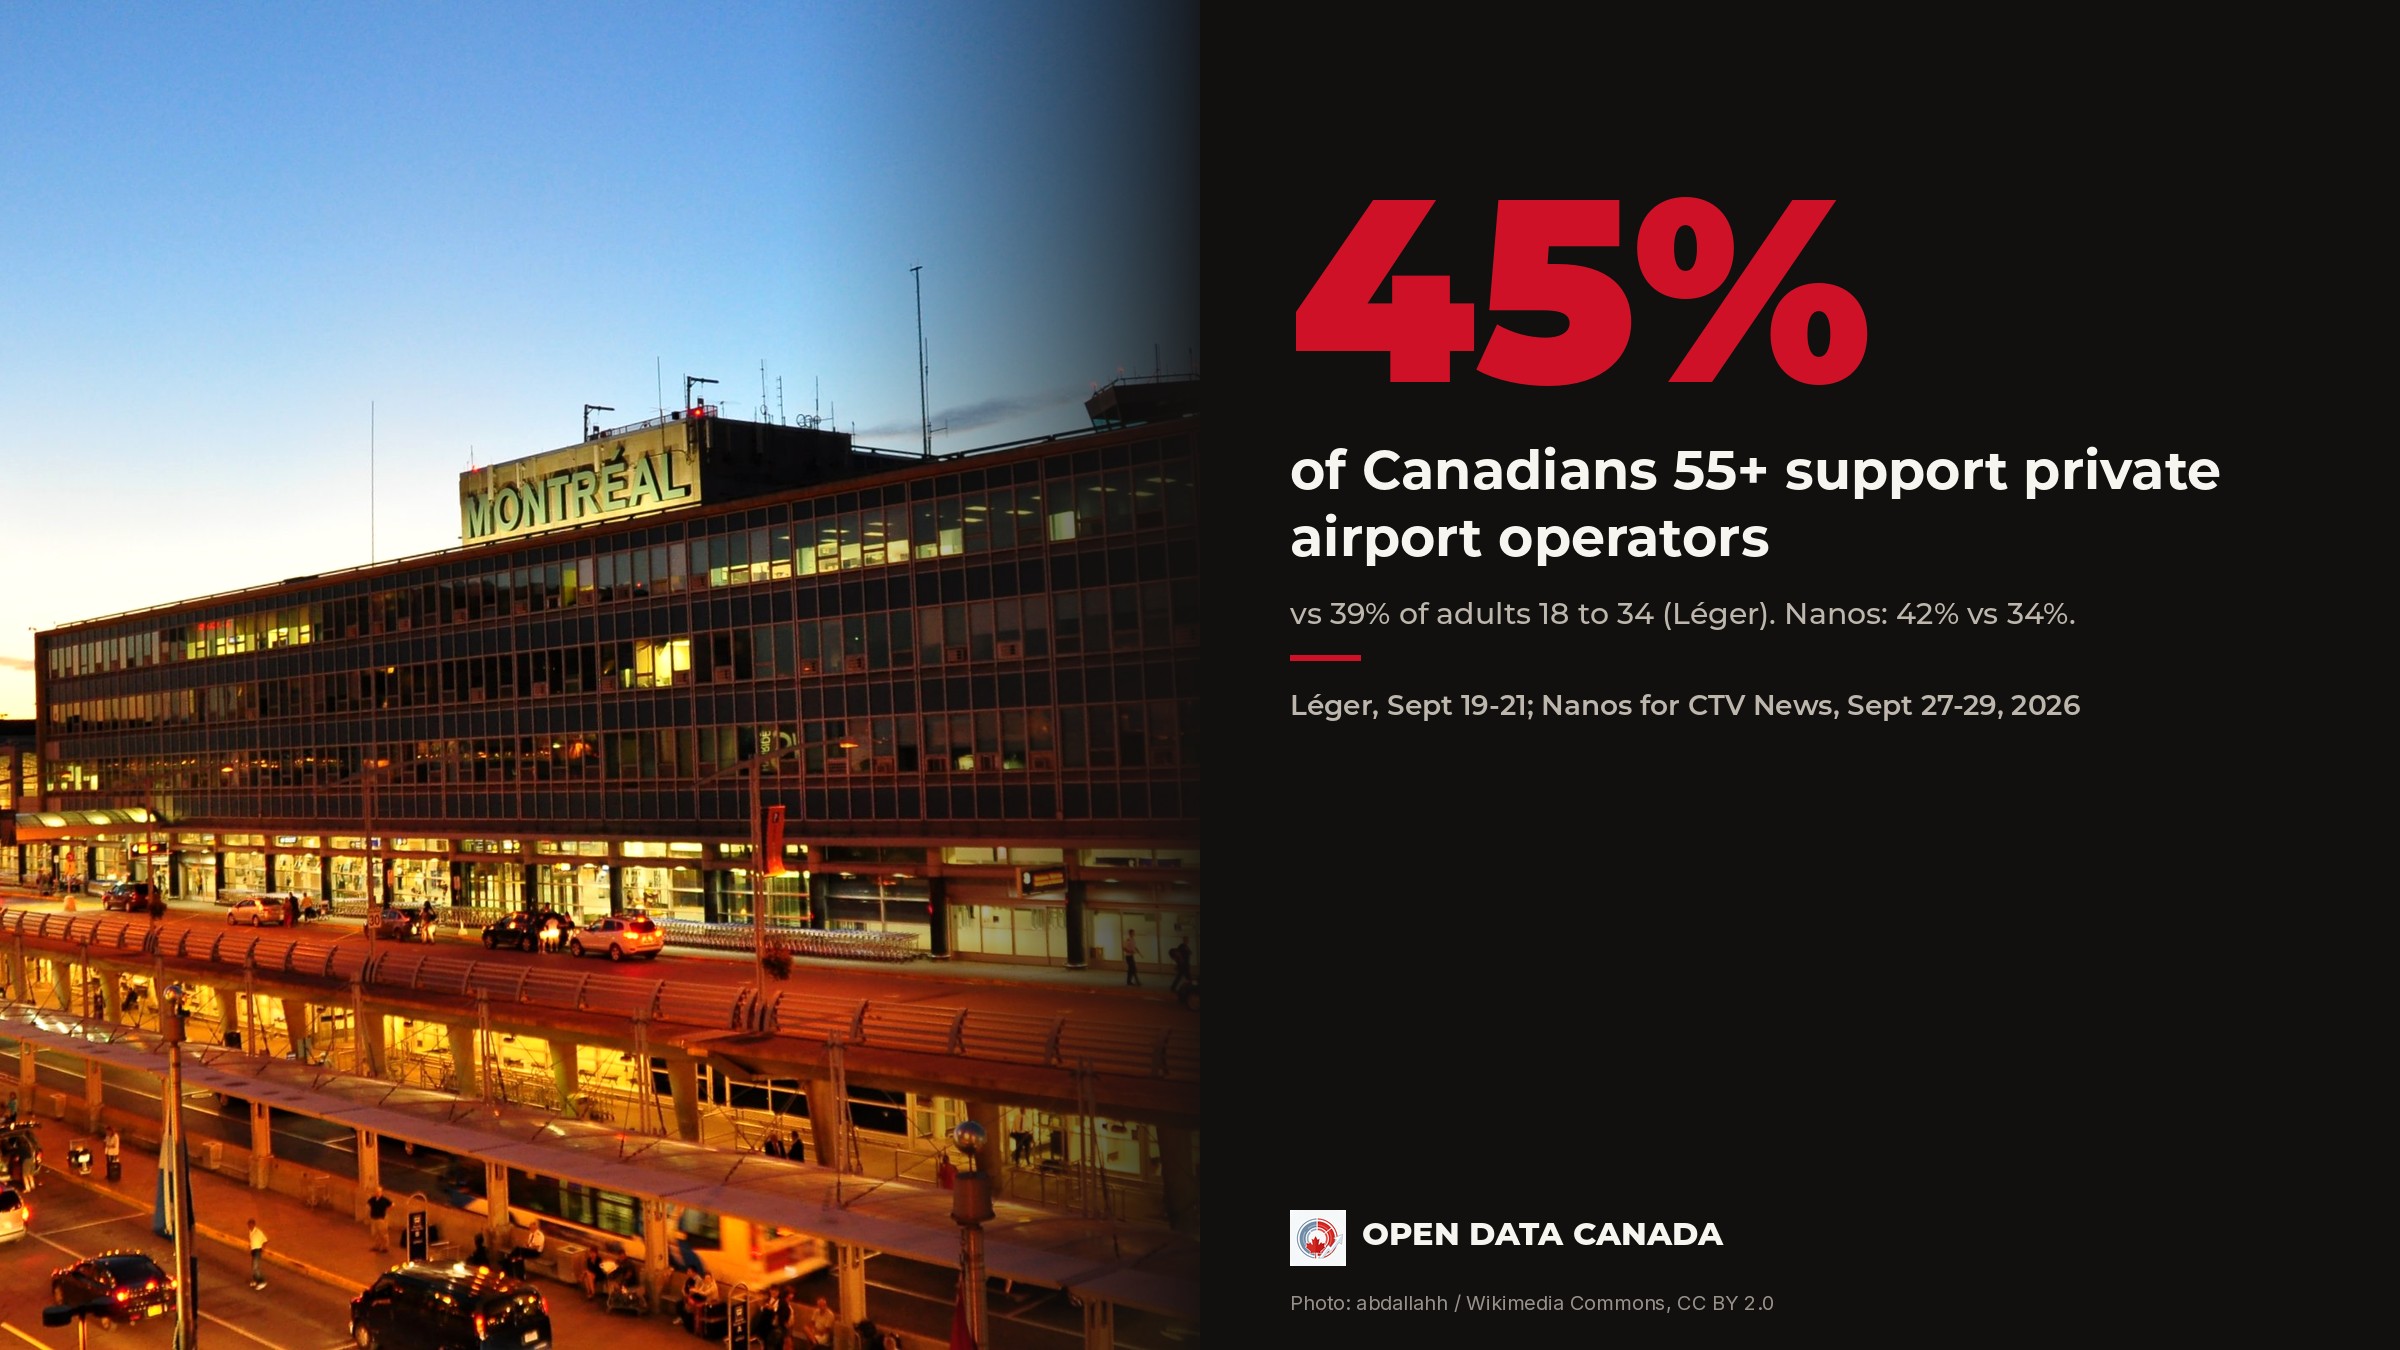
Older Canadians more likely to support airport privatization
Two September polls found the same age pattern in how Canadians view the plan to bring private operators into the country's four biggest airports. Older Canadians were more likely to support it in both.
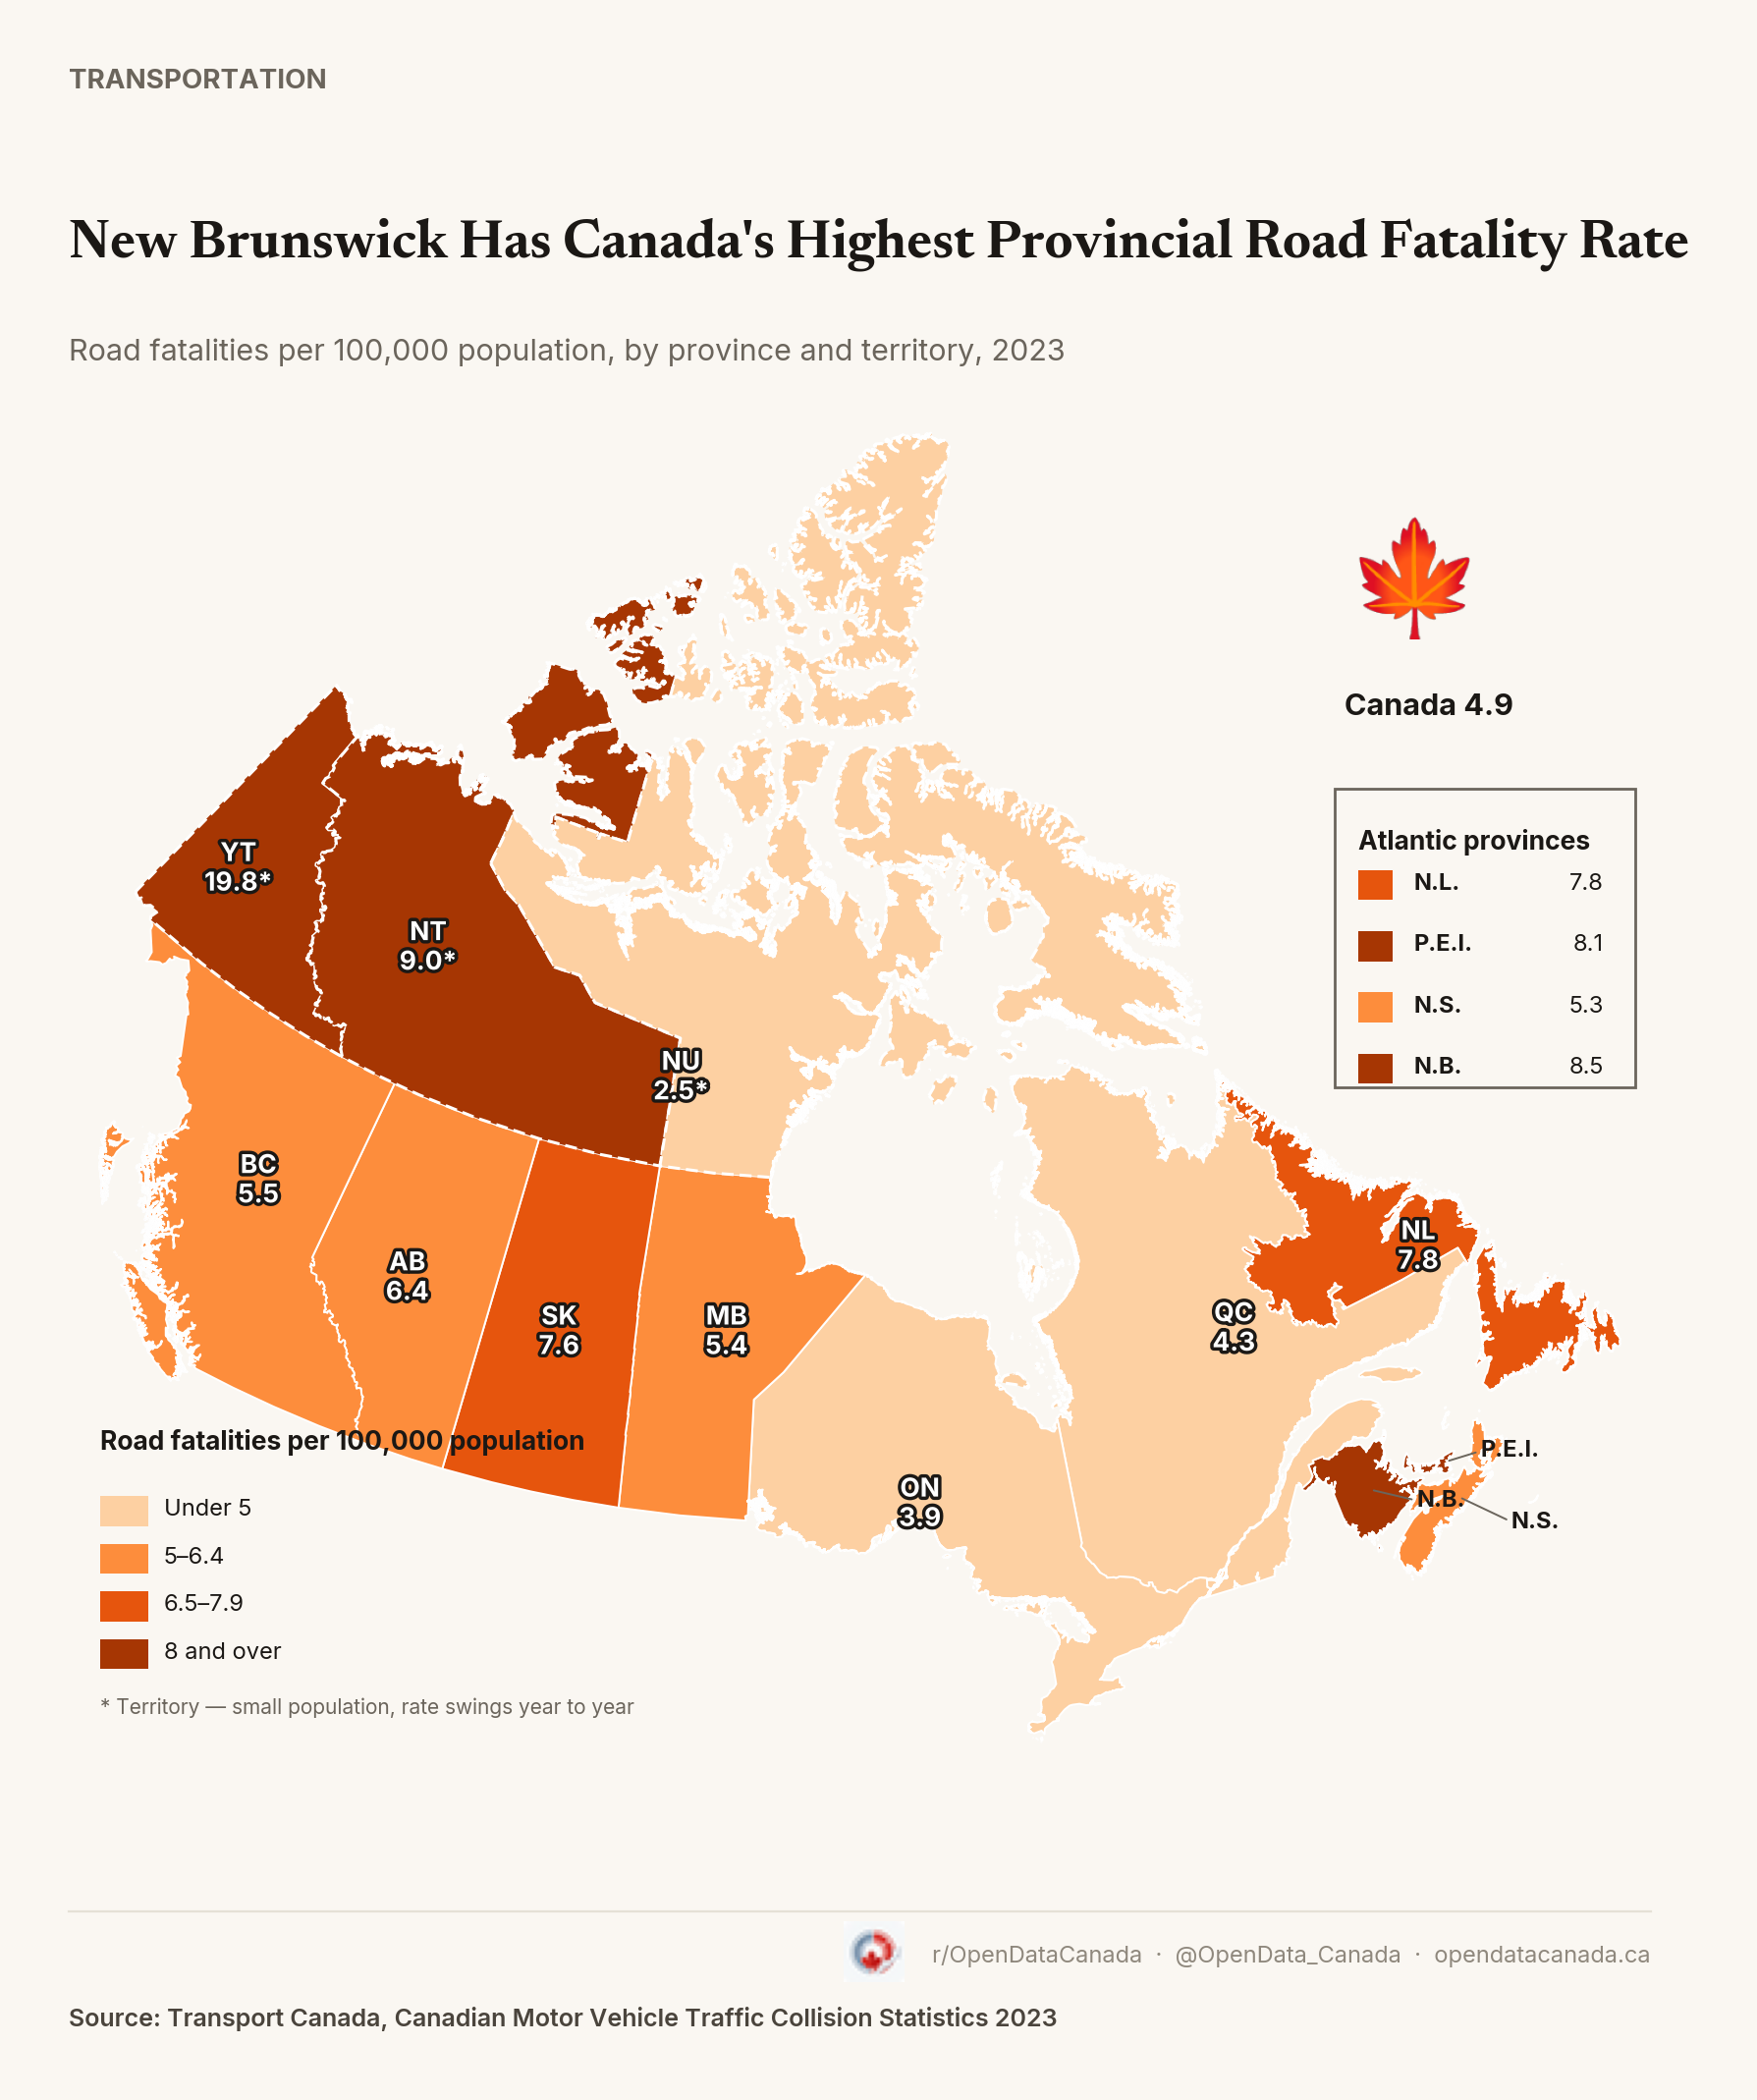
New Brunswick Has Canada's Highest Road Fatality Rate — But the Ranking Changes When You Count Driving
New Brunswick had Canada's highest road fatality rate in 2023, 8.5 deaths per 100,000 people, more than double Ontario's 3.9. Switch to fatalities per kilometre actually driven and Atlantic Canada is still worst, but the order inside it shifts, and a couple of provinces move a lot: Alberta looks mid-table by population and drops close to the national average once its driving distances are counted. Nova Scotia moves the same way.
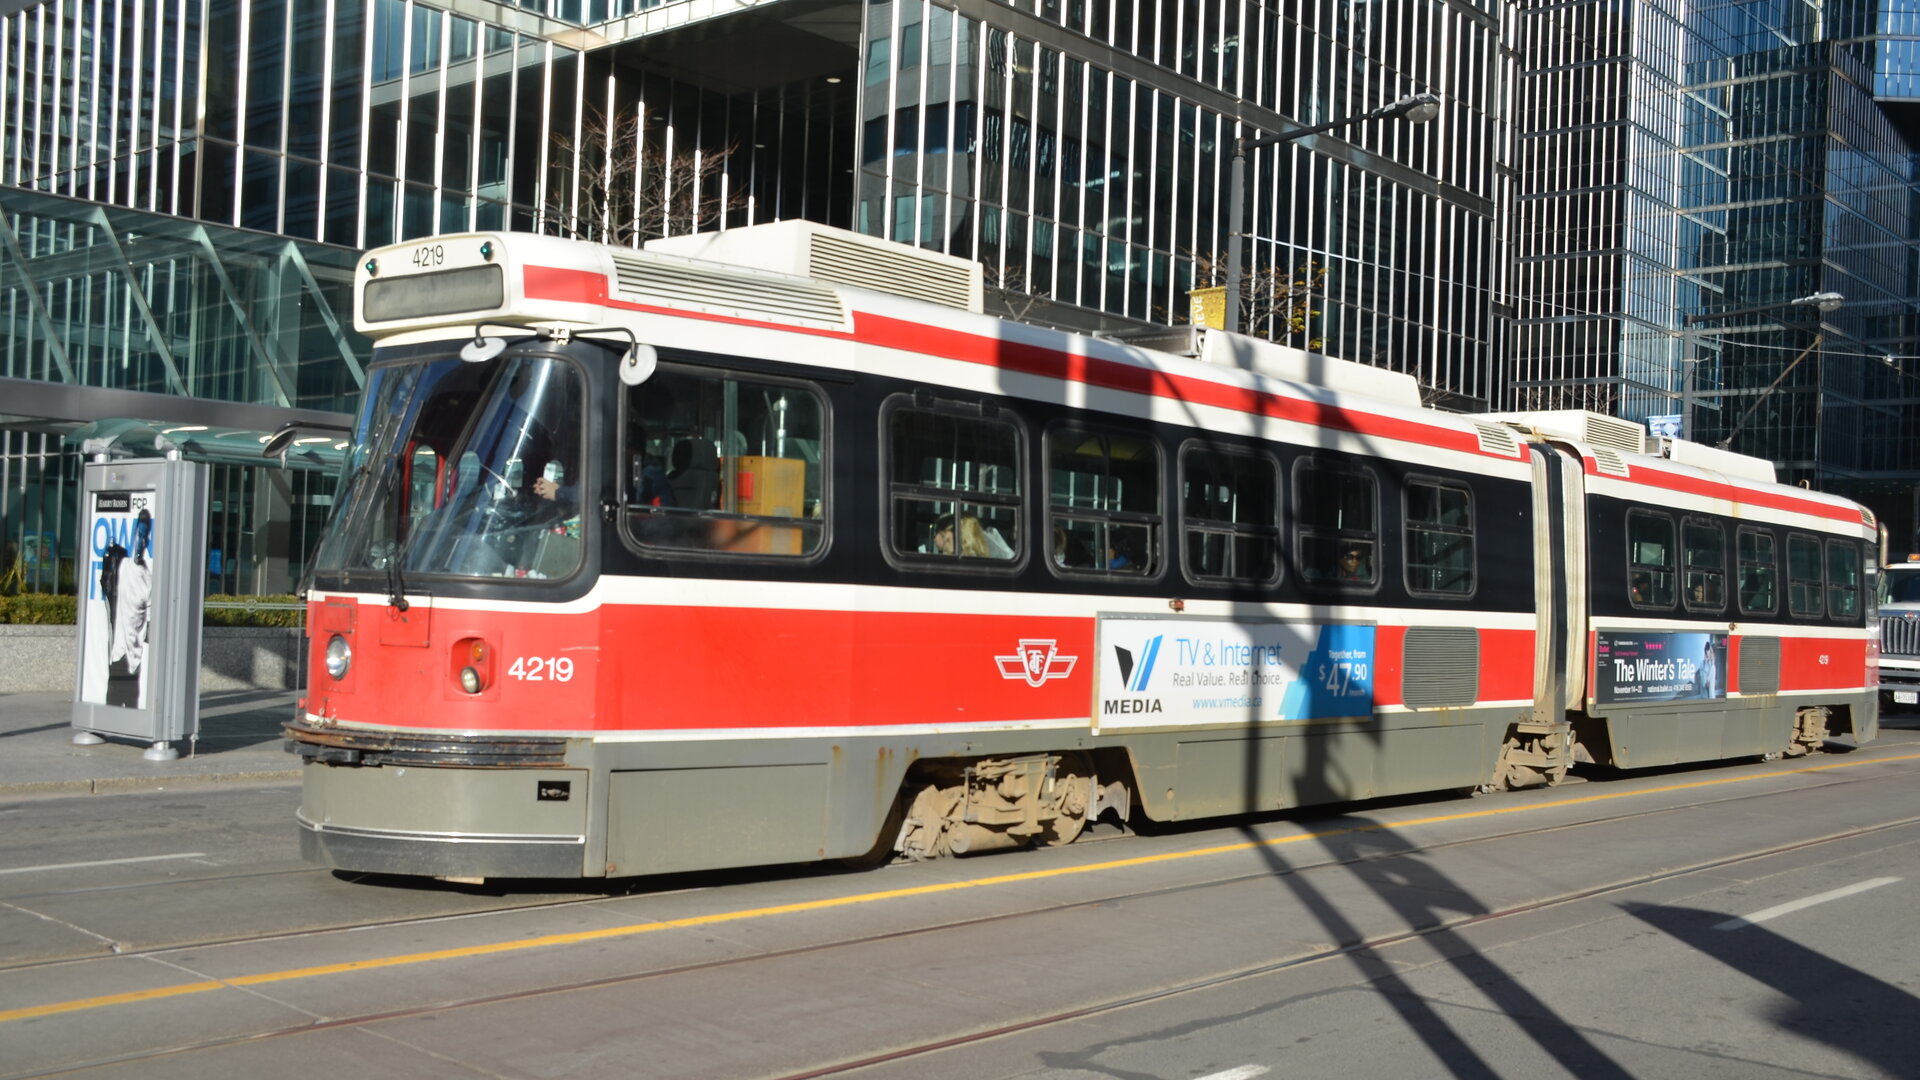
What's actually delaying Toronto's streetcars
Diversions and cars parked on the rail account for 35 percent of all streetcar delay-minutes since the start of 2025, far more than mechanical failure. Crews and cars in the way combined explain six in ten delay-minutes across the full 2024-2026 period.
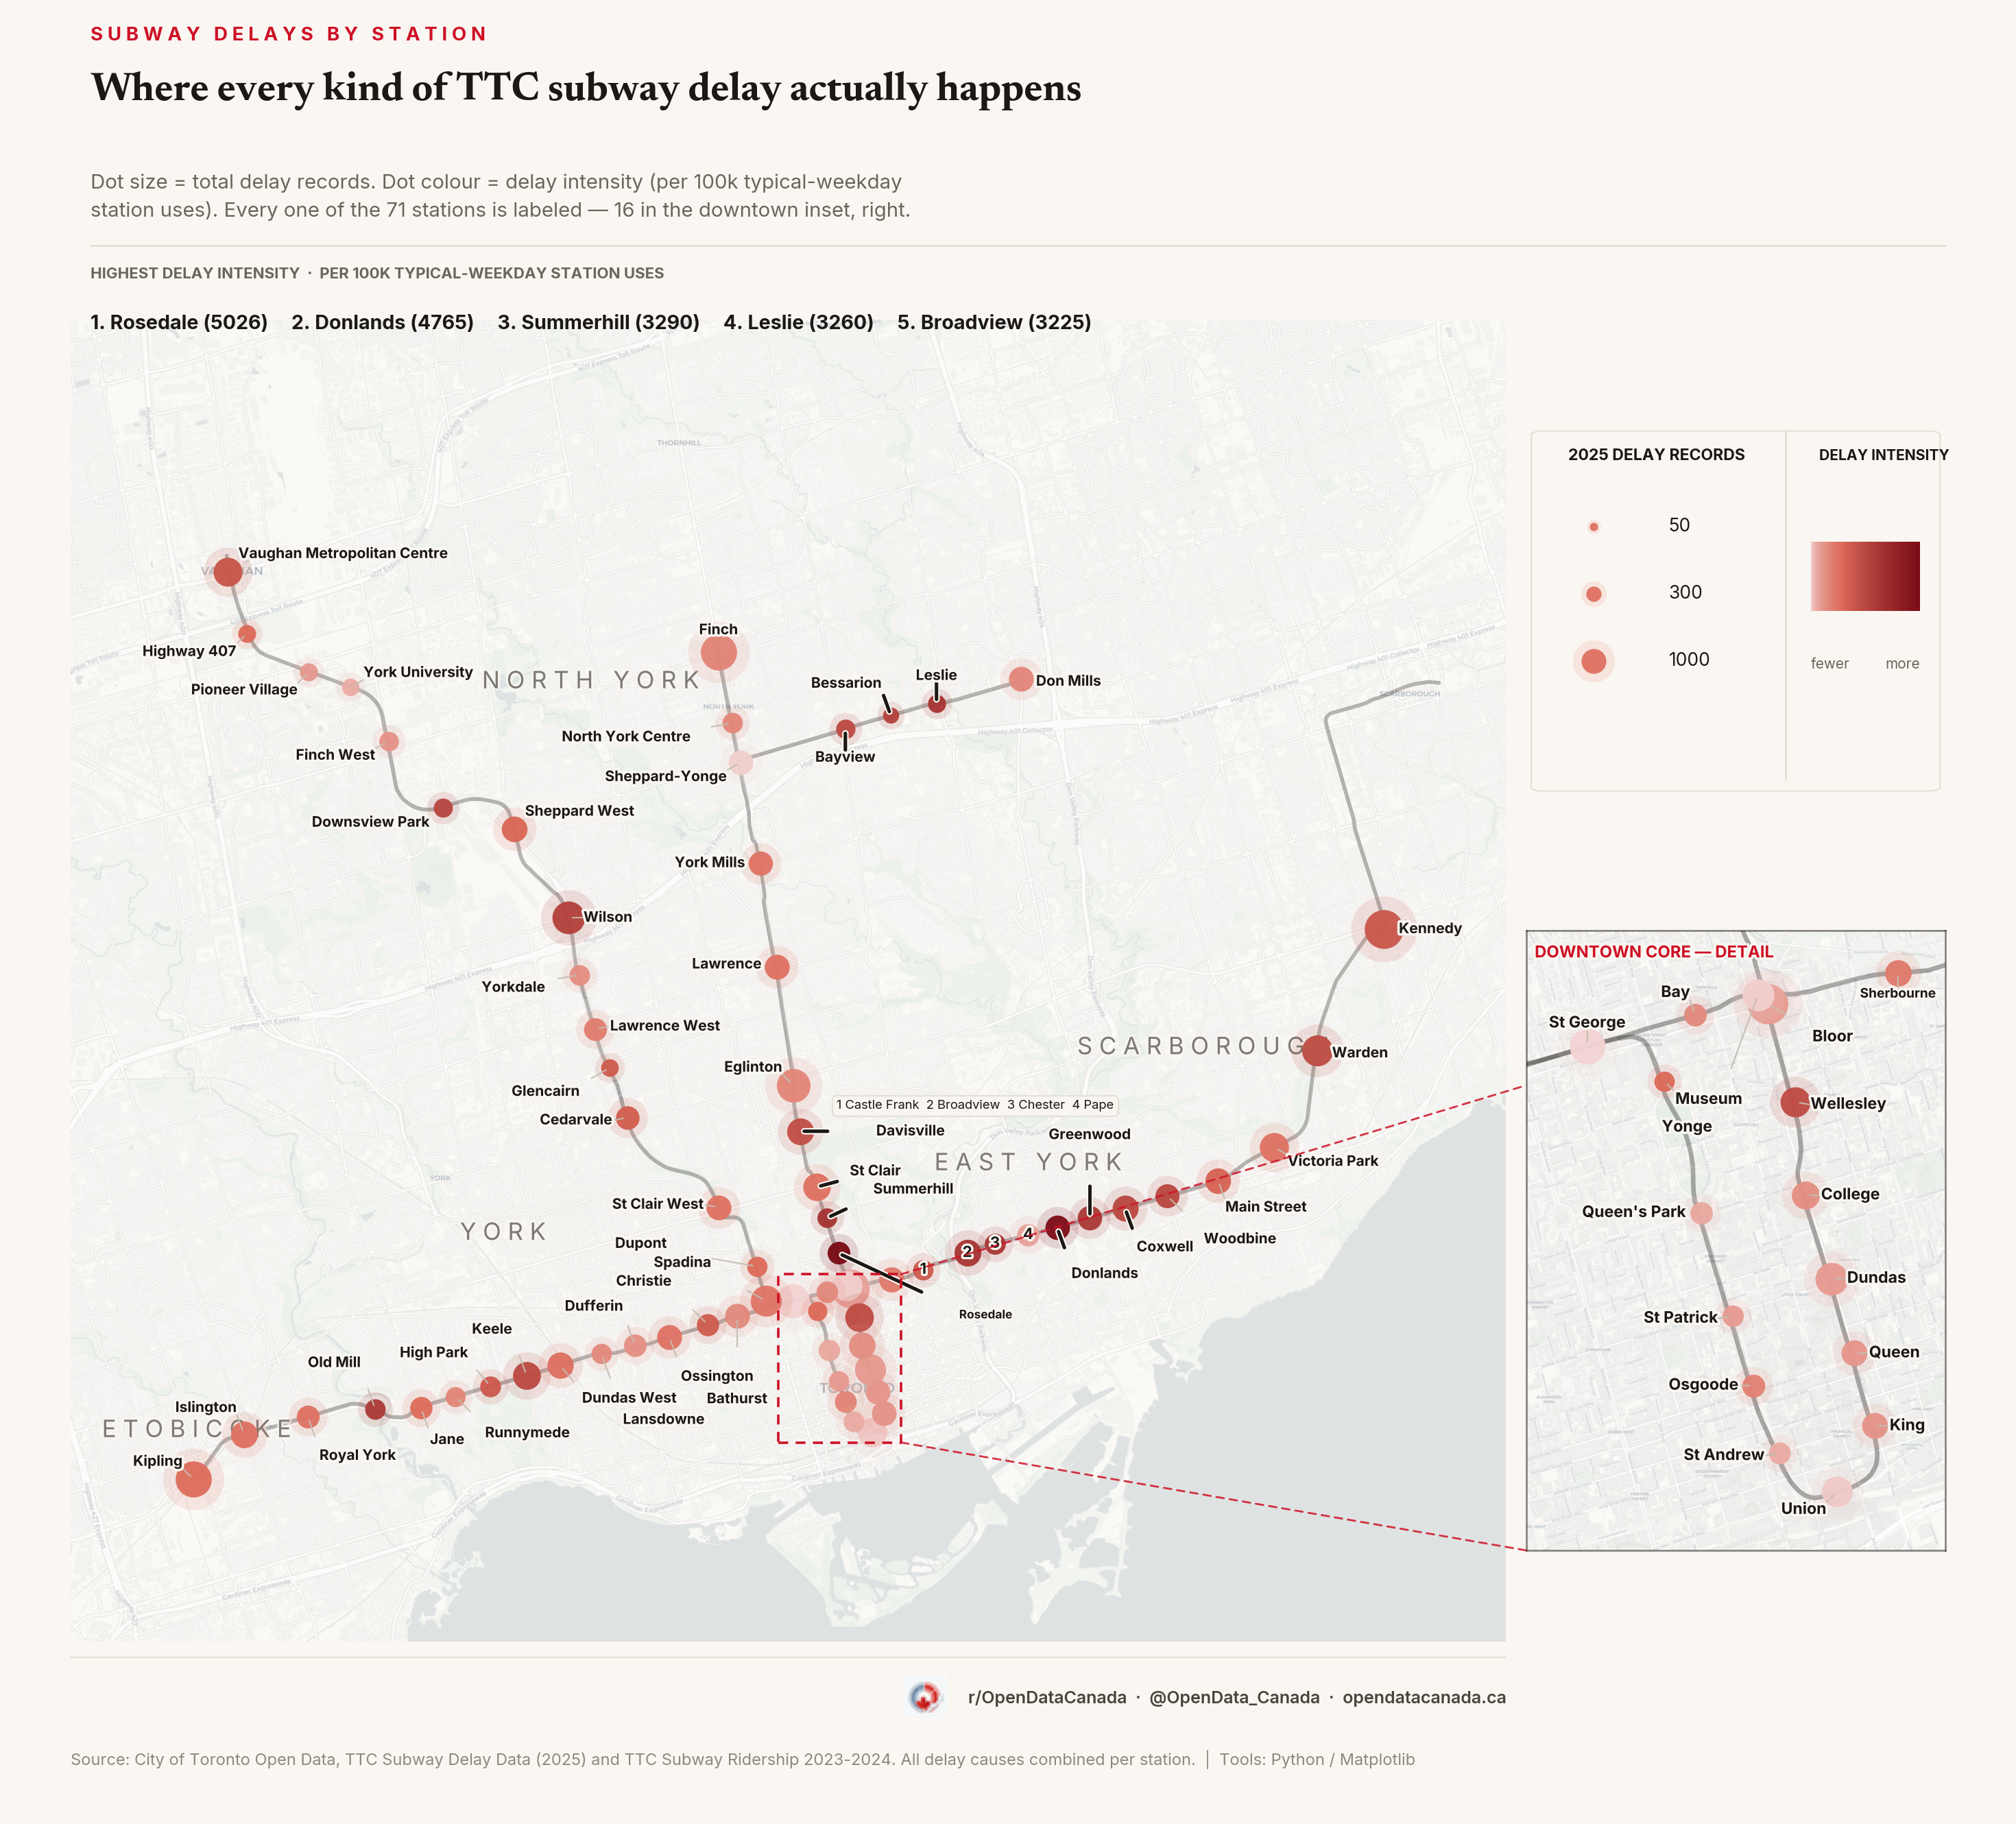
The TTC stations with the highest delay intensity aren't the busiest ones
Adjusting 2025 delay records for typical-weekday station activity produces a completely different ranking than the raw count. Twelve of the top twenty stations by this measure never show up in the raw top twenty at all.
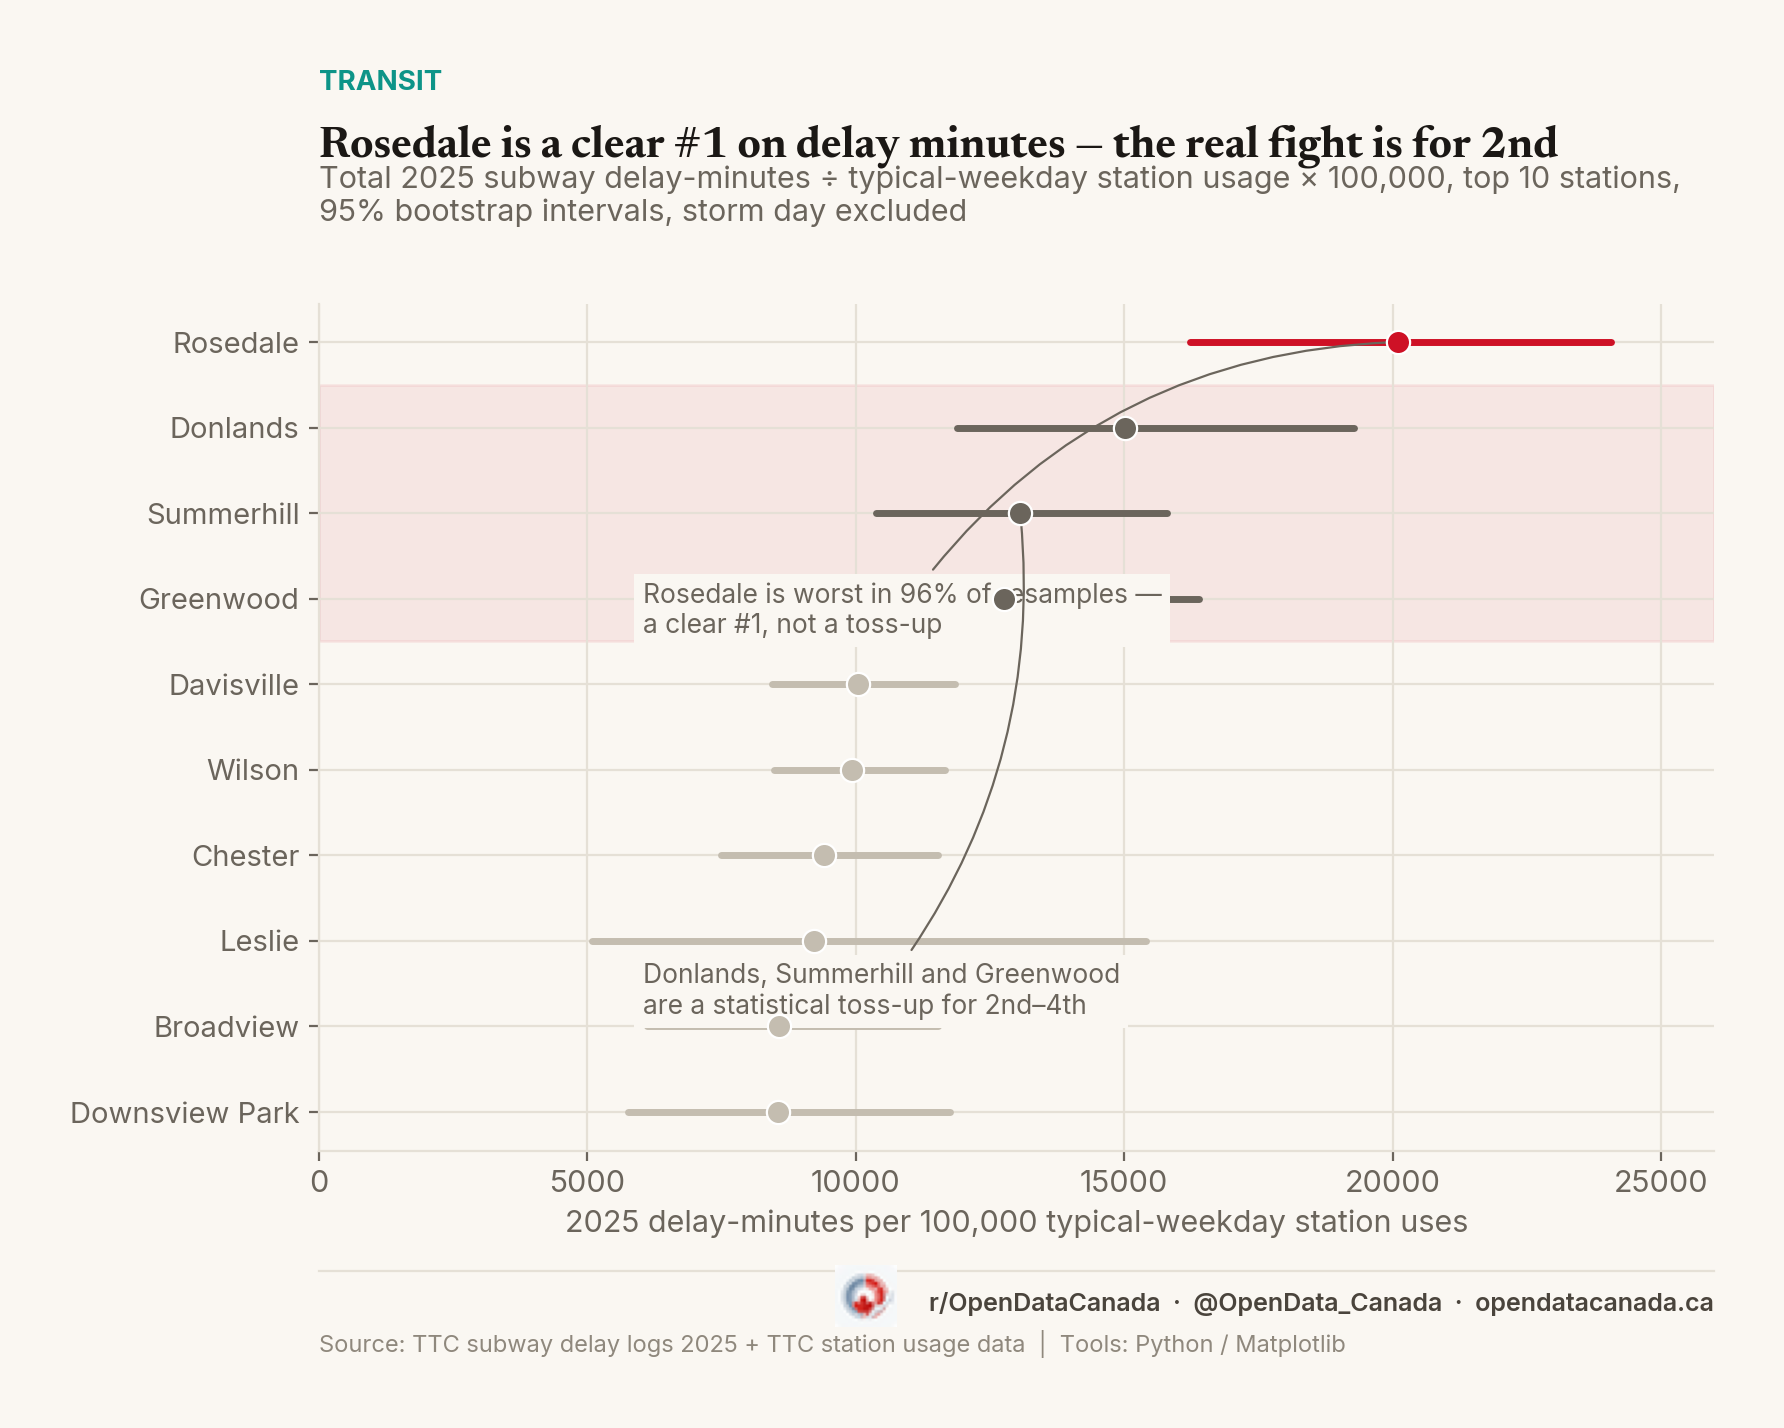
Rosedale Tops TTC Subway Delay Intensity. The Rest Is Much Less Certain
We ranked TTC stations by 2025 delay-record counts weighted for station usage. This time we ranked them by actual delay minutes instead, and ran a tougher statistical test on top of it. Rosedale, Donlands, Summerhill and Greenwood all lock in a top-five spot. The fifth is a genuine toss-up among five stations.
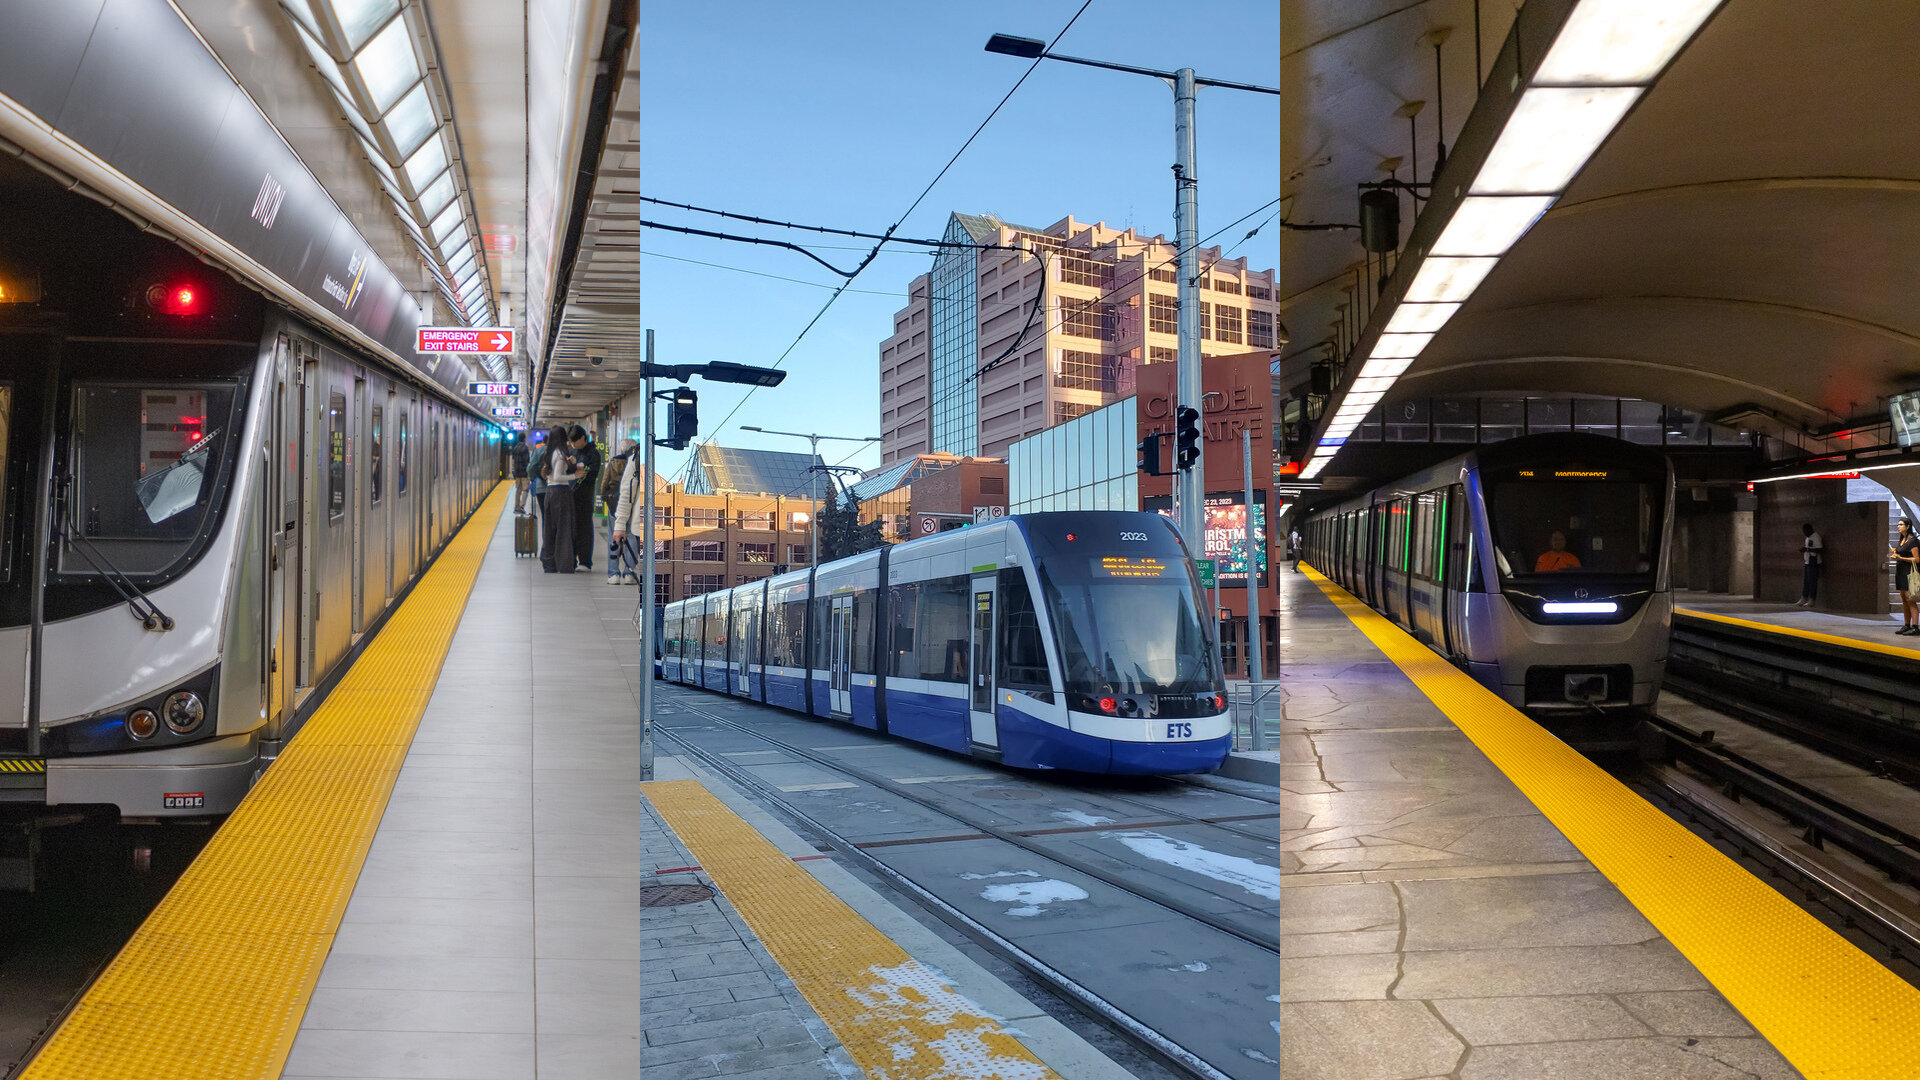
Every big Canadian city is losing transit riders again — and only Edmonton ever beat its pre-pandemic level
Six years of ridership data from the agencies' own records show one Canadian city carrying more riders than before the pandemic. Then, in 2026, every city we can measure turned down at once.
Every major Metrolinx transit line is opening years behind schedule
Measured against the opening date first committed for each project, every major transit line in the Greater Toronto Area is landing three to five years late. Two have finally opened. Three are still under construction, and their targets keep moving.
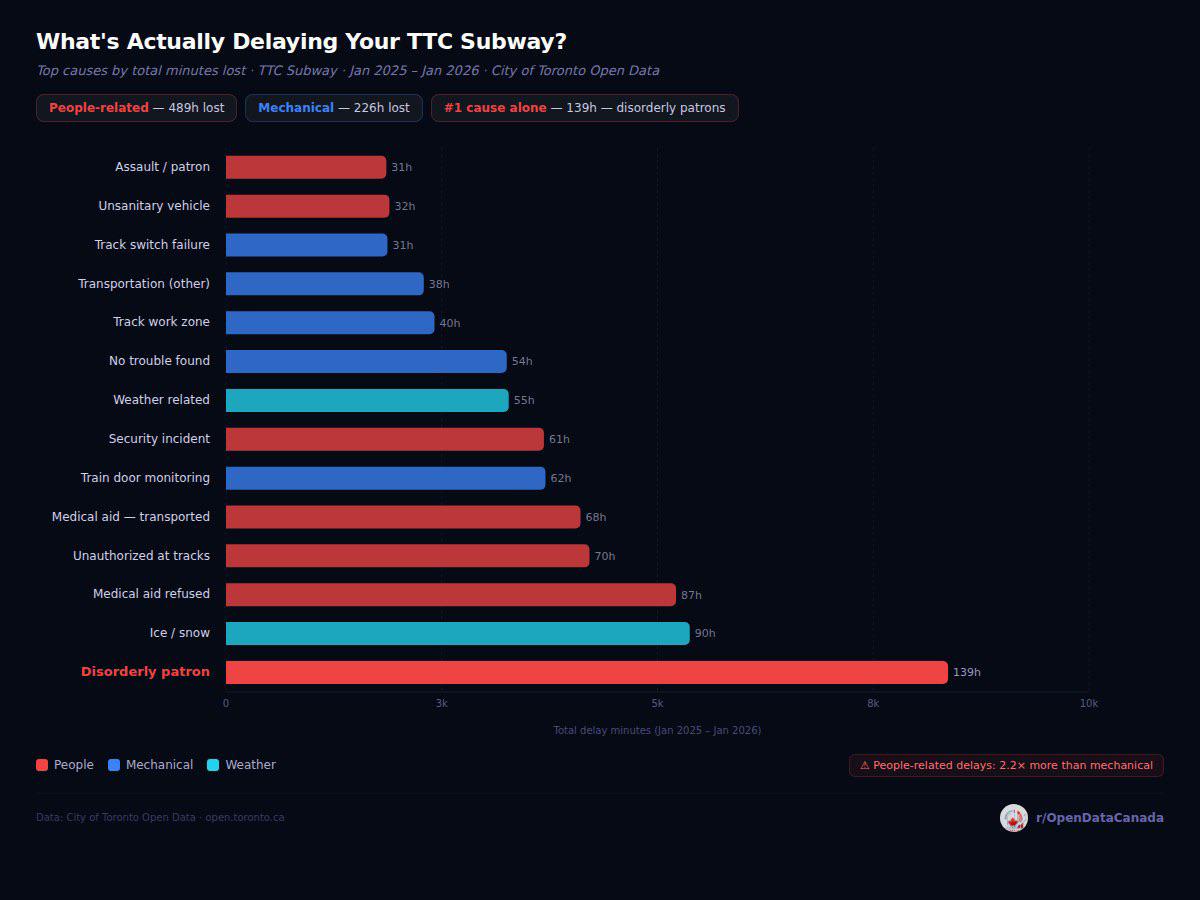
What's actually delaying the TTC subway
1,385 hours lost across 10,087 incidents. Disorderly patrons top the chart by total time but Line 1 carries 56 % of all delay. Built directly from the open-data file.