
Article · Transit · 4 min read
Traffic causes more Toronto streetcar delay time than mechanical failure.
TTC has a delay code for a surprisingly ordinary problem: a car parked or stuck on the streetcar tracks. The code is called Auto Foul Rail. Add diversions around blocked track, and those two causes account for 35 percent of all streetcar delay-minutes logged since the start of 2025. Mechanical failures account for about 5 percent over the same period.
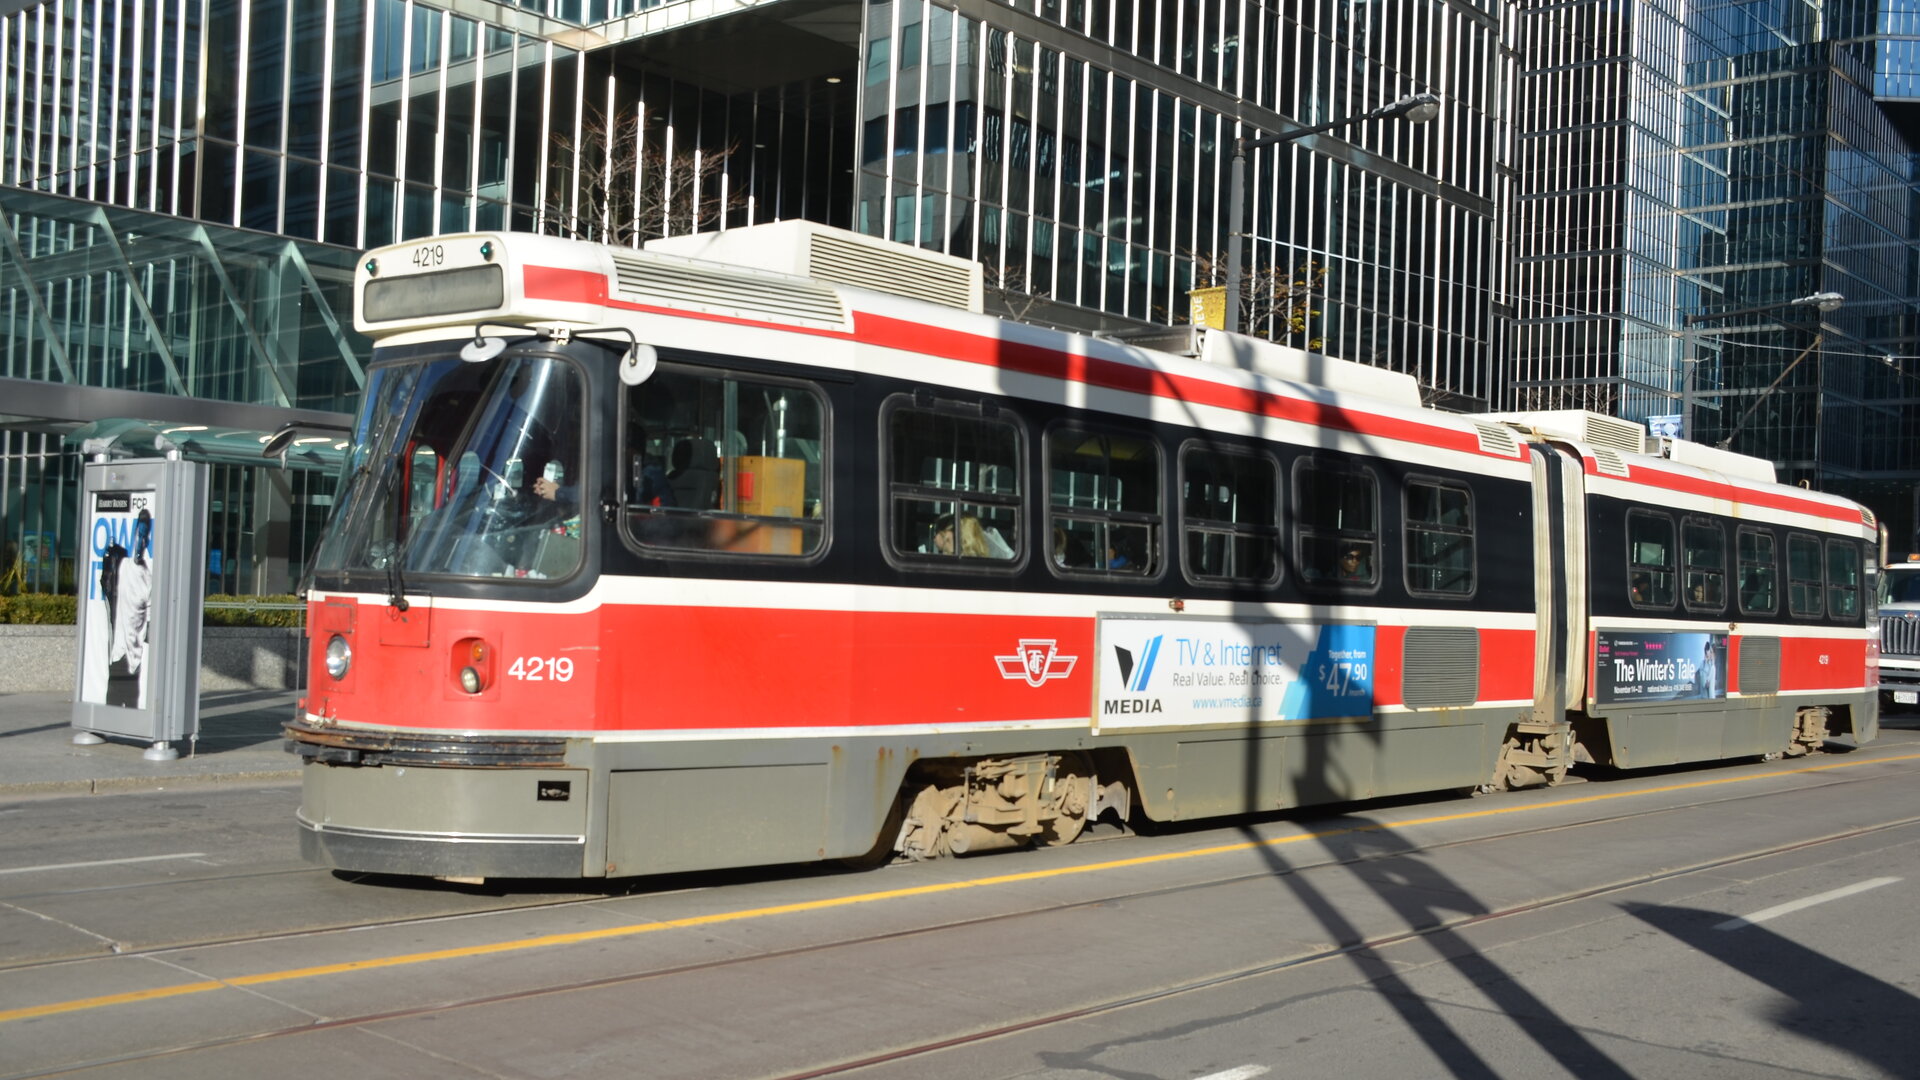
The difference between the two systems is straightforward: TTC's subway is largely grade-separated, while many streetcars run in mixed traffic, sharing lanes and turns with everyone else on the road. The delay data reflects that difference.
We pulled the TTC Streetcar Delay Data from City of Toronto Open Data — the 2024 file plus the granular code file covering January 2025 through June 2026 — and rebuilt every number below from scratch. We filtered to routes 501 through 512 and grouped every delay into seven cause categories. The detailed cause breakdown below uses the January 2025–June 2026 window, when TTC's more granular delay codes are available.
TTC's delay codes
TTC delay data gets coded by Transit Control the moment an incident happens. Since 2025 it's used roughly 139 alphanumeric codes; the 2024 file worked off a coarser, plain-language scheme with 13 categories. Two of the granular codes matter most for this piece: MTDV, On Diversion, and MTAFR, Auto Foul Rail — TTC's own term for a car sitting on the streetcar right-of-way.
When we group the individual codes into seven broader categories, Operations/Crew — diversions, held vehicles, crew-side delays — accounts for 60% of all delay-minutes across the full 2024 to 2026 period, more than double the next-largest category (Emergency/Medical, at 9%). Mechanical failure, the one most riders probably assume dominates, is just 6%.
Cars, not equipment
Look only at the period since January 2025, when TTC's granular codes let us isolate individual causes. On Diversion accounts for 88,927 delay-minutes across 2,151 incidents; Auto Foul Rail adds another 37,989 minutes across 1,266 incidents. Together, the two traffic-related codes account for 126,916 minutes — 35% of all streetcar delay-minutes in that 18-month window. Both are officially documented in TTC's code lookup table, unlike the 12% of 2025-plus codes that fall outside it.
Every streetcar delay cause, ranked by total minutes lost · Jan 2025 – Jun 2026
Only the 2025+ code scheme breaks Operations/Crew into individual causes, so this window differs from the full 2024–2026 figures elsewhere in this piece.
On Diversion and Auto Foul Rail also take longer to clear. They average 41 and 30 minutes respectively, compared with 17.5 minutes for all incidents.
Streetcars and subways fail differently
Our earlier subway delay analysis found a different culprit: disorderly patrons, medical emergencies, security incidents and assault together accounted for 489 of the subway's 1,385 delay-hours in the year to January 2026 — 35% of the total, the largest single category but not a majority.
Streetcars break down differently. Operations/Crew accounts for 60% of all streetcar delay-minutes across the full 2024–2026 period, with diversions and vehicles blocking the right-of-way making up much of that category. Two systems, run by the same agency and coded by the same control centre, fail in different ways.
What this dataset doesn't tell you
The 2024 and 2025-plus files use different code schemes, and there's no official crosswalk between them. We built one by hand for this piece, so treat any year-over-year comparison as approximate.
The raw 2025-plus Line field is also messy — contaminated with overnight bus-route labels and a handful of placeholder values (999, 500), which we filtered out. That's 6.5% of the raw rows gone before we even started counting. About 20% of what's left logs zero minutes of delay: an incident happened, but nothing measurable was lost. That affects incident counts, not the minute totals above.
One row in the combined file logs exactly 999 minutes — almost certainly a data-entry cap, not a real 16-hour delay. Drop it, along with every row over 300 minutes (96 rows, 0.3% of the data), and the finding barely moves: Operations/Crew still sits at 58% of all delay-minutes, and Diversion-plus-Auto-Foul-Rail at 33% of the 2025-plus total.
One thing we couldn't build: streetcar ridership is only published at the route level, not by stop, so a per-stop delay-intensity map isn't possible from public data yet.
Read next