
Theme
Cost of living
Groceries, rent, gas and pay: is your paycheque keeping up? Updated every month from Statistics Canada, with every story we have written on it.
Pay vs prices
Over the past five years, the average hourly wage rose 21.6%. Prices overall rose 19.1%. Rent, groceries and gasoline rose faster than pay. In the past 12 months, prices rose 3.0% and the average wage 2.0%. Prices are outpacing pay.
Change from Aug 2021 to Aug 2026. Prices are Statistics Canada's consumer price index. Wages are average hourly earnings from the Labour Force Survey.
The past 12 months
Change from Aug 2025 to Aug 2026. The lines trace the past five years.
Data as of 5 October 2026. Updated after each Statistics Canada release.
Cost of living stories
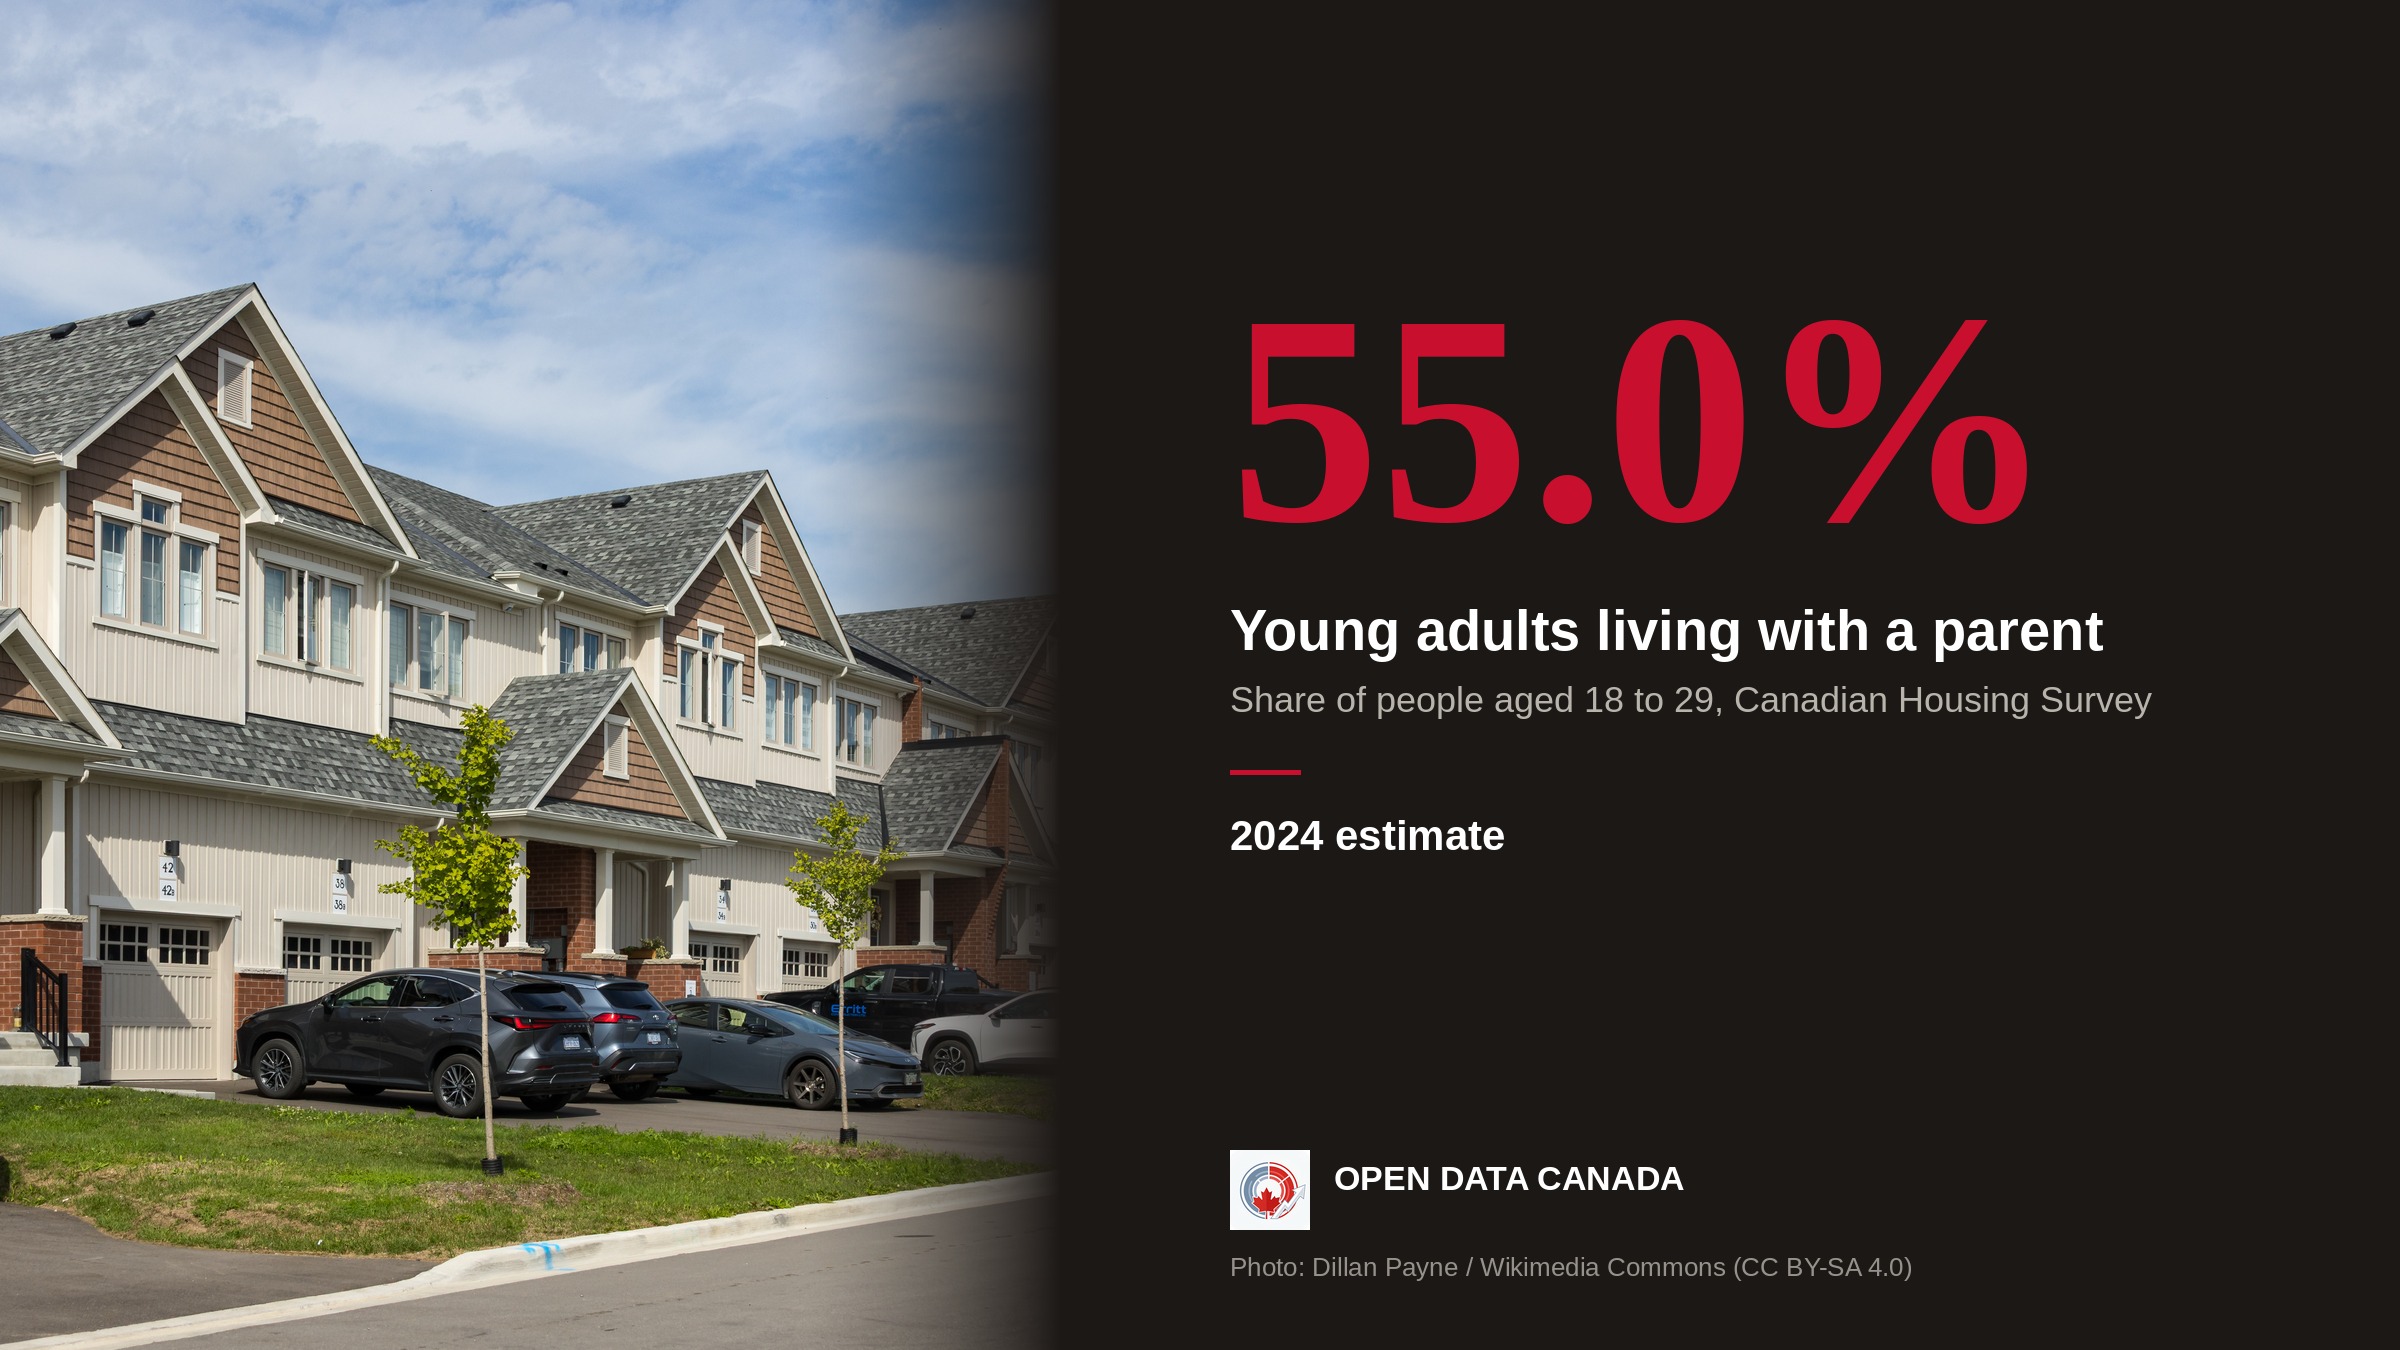
In 1981, 27% of young adults in Canada lived with their parents. The latest housing survey puts it at 55%.
Census data show the share climbing to 42% by 2011. Statistics Canada's 2024 housing survey puts it at 55%, up from 51% in 2022, about 3.5 million people.
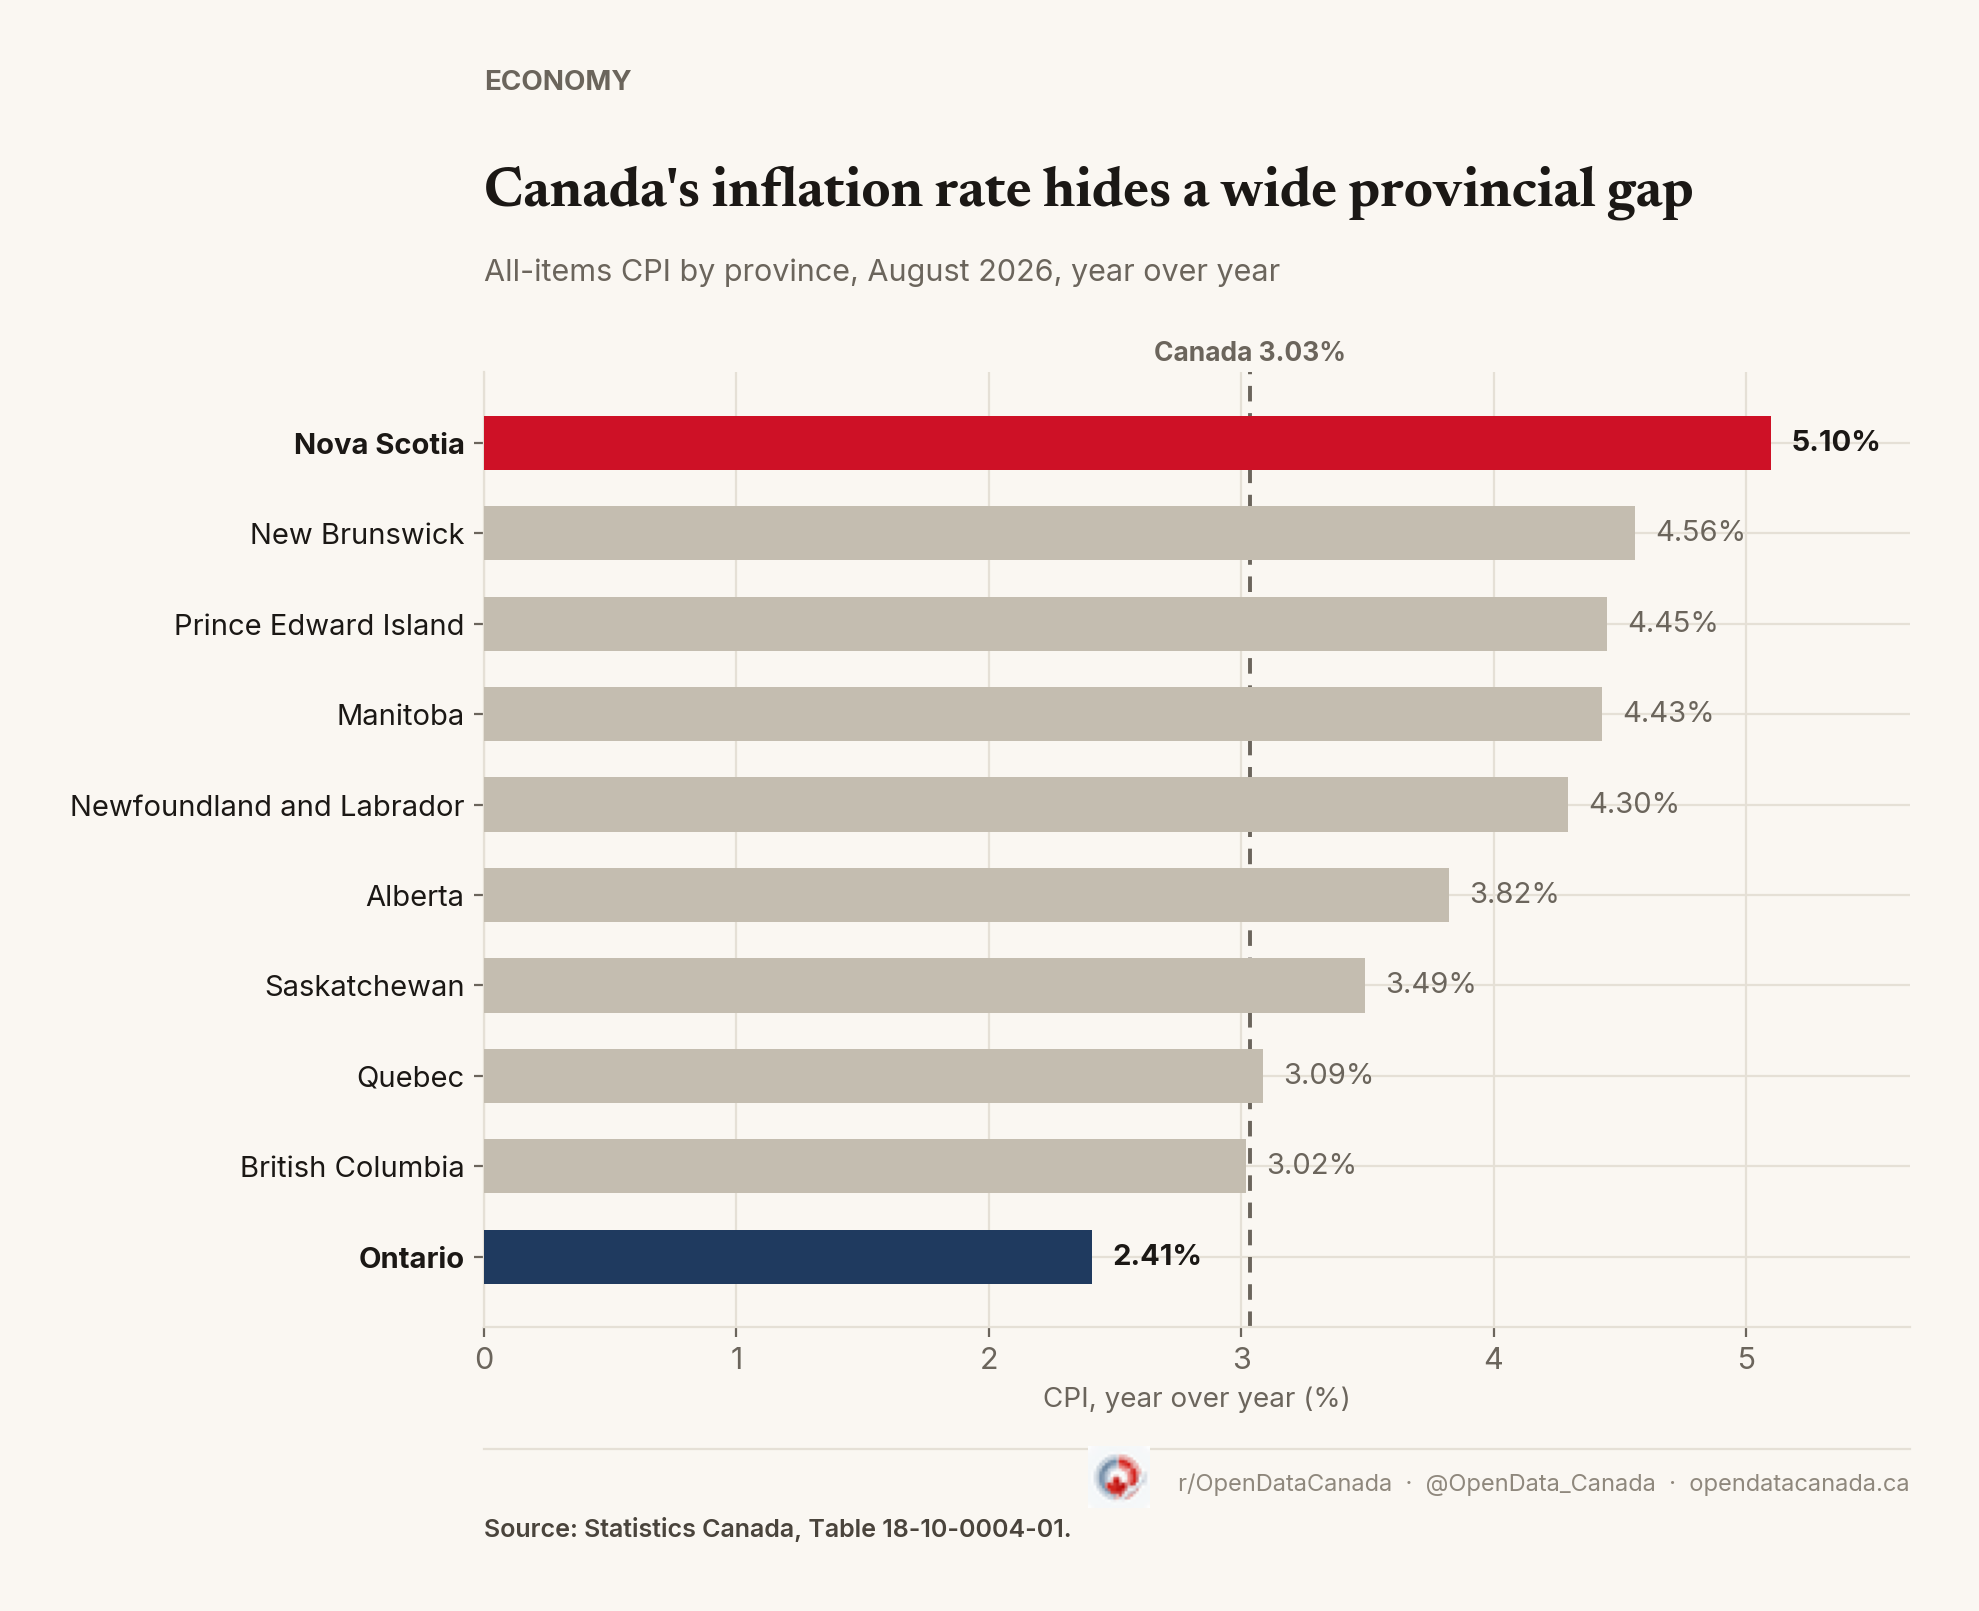
Canada's 3% inflation rate masks a much wider provincial split
From 2.41% in Ontario to 5.10% in Nova Scotia — Statistics Canada's August 2026 CPI release shows one of the widest provincial inflation gaps of the past year, and it traces back almost entirely to a single category: shelter.

Canada's mobile prices remain among the priciest in the G7 — and they're rising again.
Ottawa spent two years tracking wireless prices down and declared victory in January 2022. A federal price-comparison study shows Canada has stayed among the three most expensive places for a basic mobile plan among G7 countries plus Australia, at every plan size tracked, and by late 2025 the prices that did fall were climbing again.
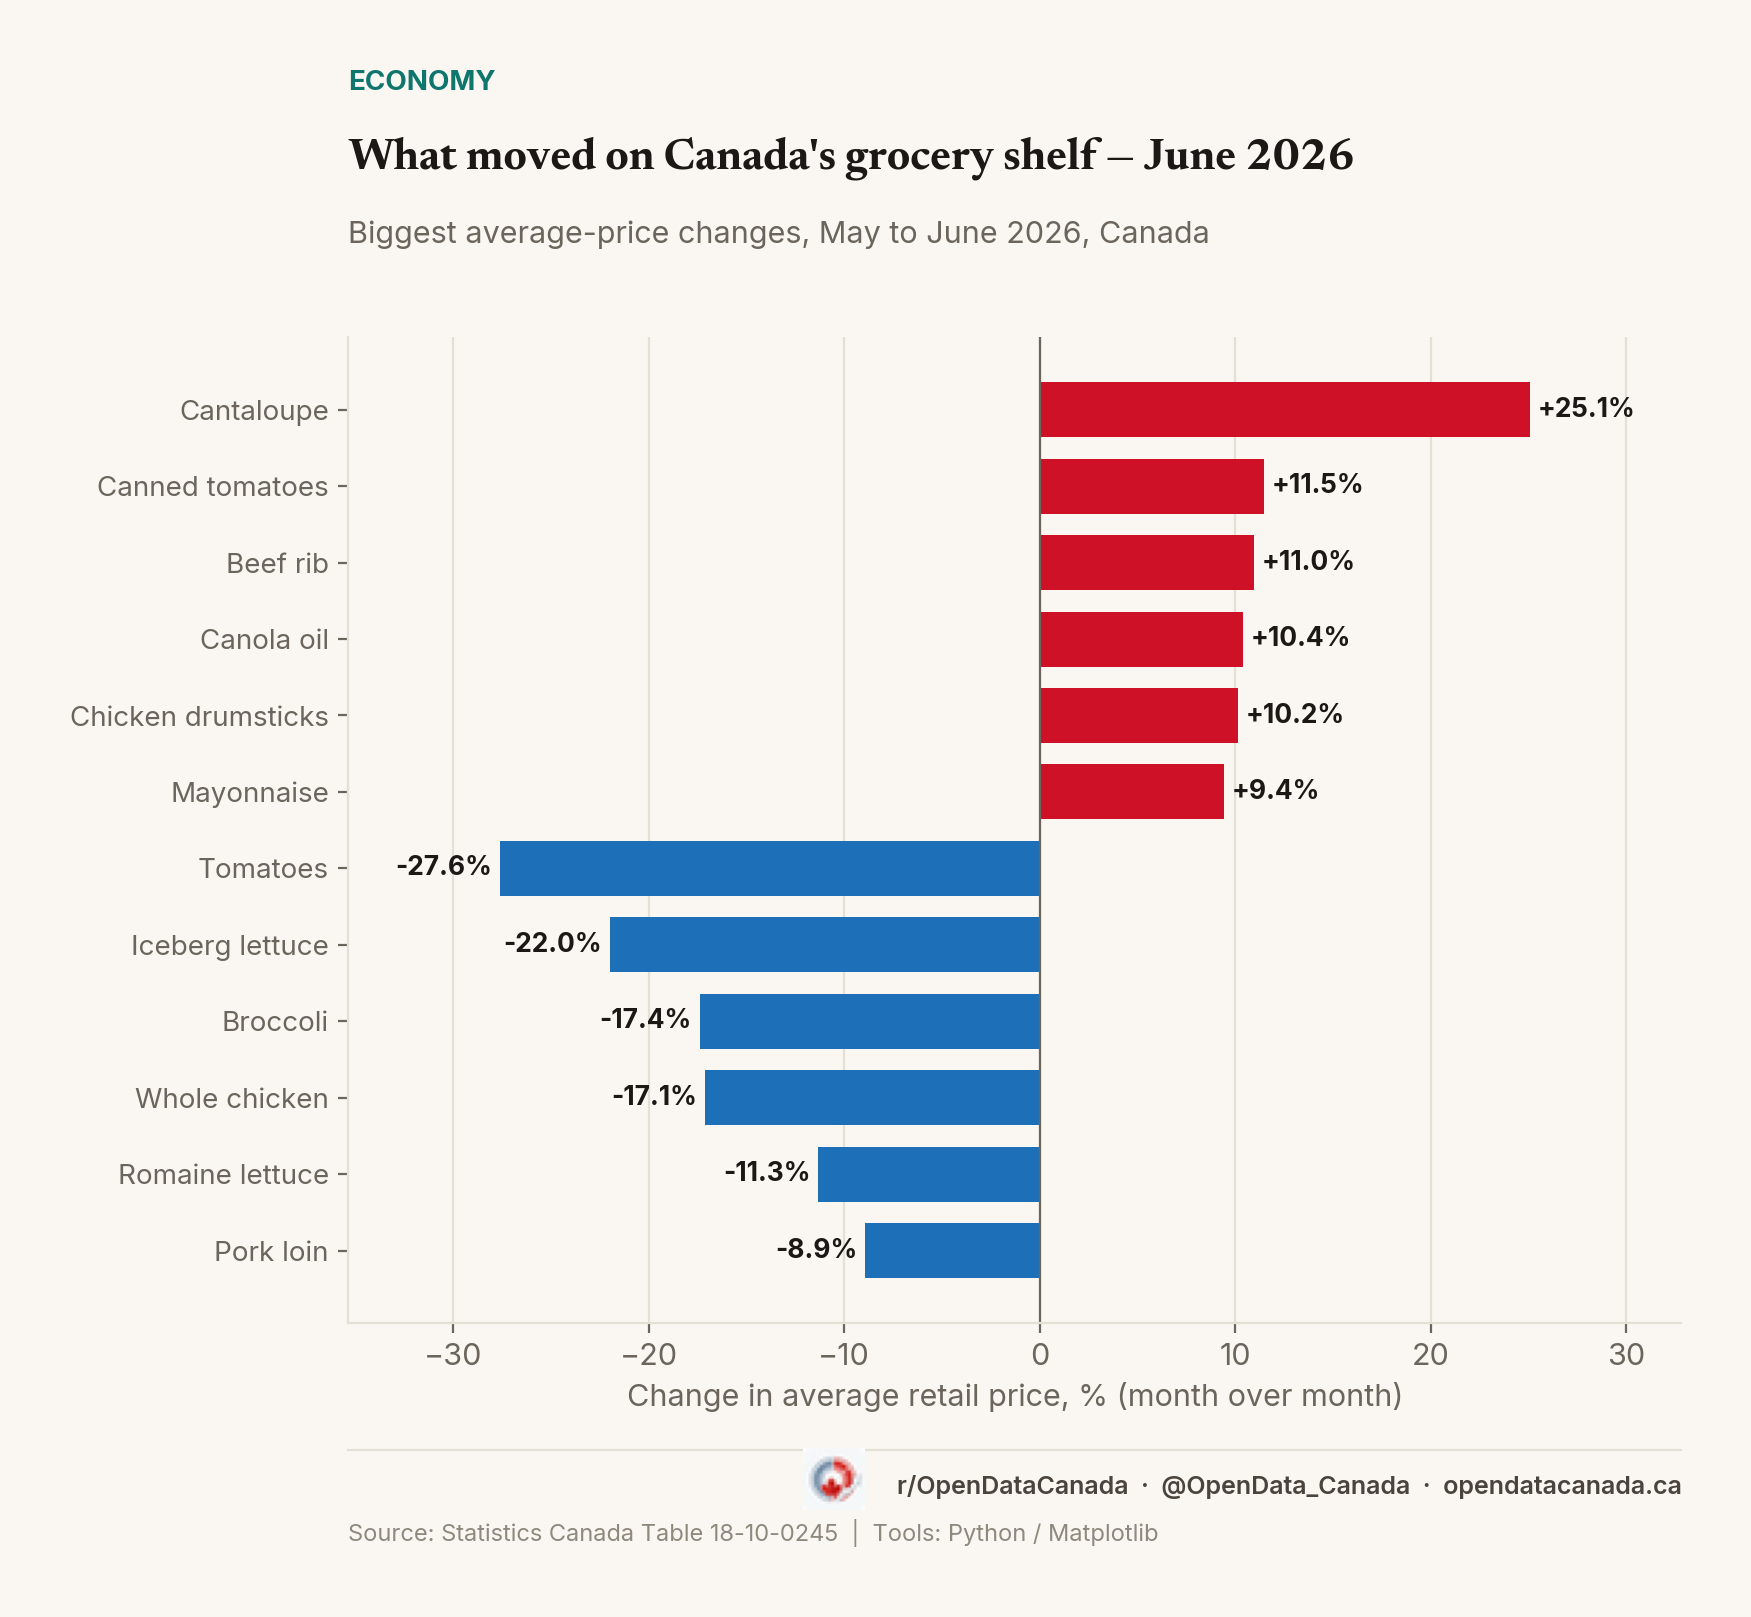
Vegetable oil is up 138% since 2020 — Canada grocery movers, June 2026
Vegetable oil has climbed 138% since January 2020, the steepest sustained increase among items StatCan tracks. Beef striploin is up 89.5% over that same stretch and 46% in the past year alone. Month to month, cantaloupe jumped 25.1% in June even as broccoli and tomatoes both got cheaper. The swings show how uneven grocery inflation remains from one item to the next.
43 of 44 Canadian Social Assistance Scenarios Fell Below the Poverty Line in 2025
Across every province, Maytree modelled 44 household scenarios against Canada's official poverty line in 2025. Forty-three came in below what the basics cost. The one exception, in Quebec, reaches just 3 percent of the province's social assistance caseload.
Asking rents fell. The rent people pay went up.
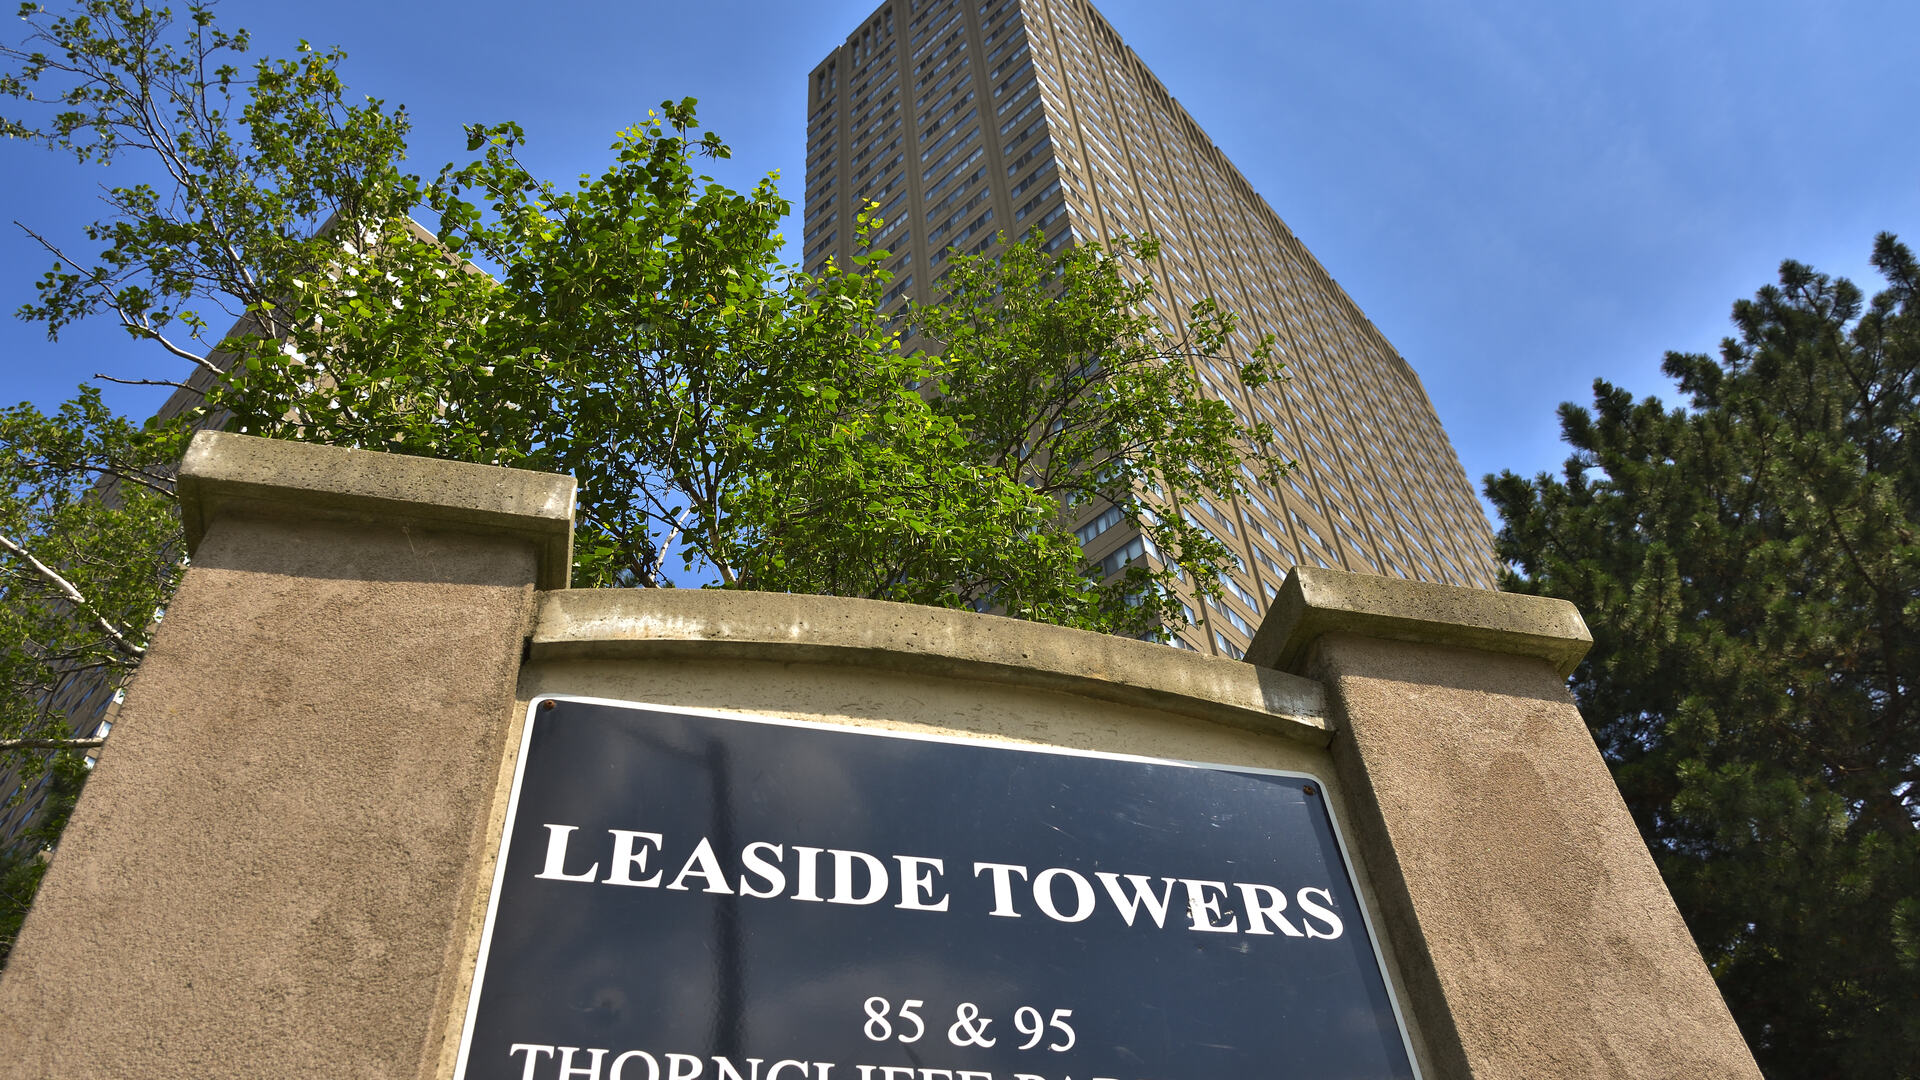
Statistics Canada says asking rents fell over the past year. It also says rents rose almost four per cent. Both are correct. One number prices the apartment you would move into, the other the one you already live in, and the difference explains most of the confusion.
Canadian millennials are twice as likely to live with their parents as boomers were
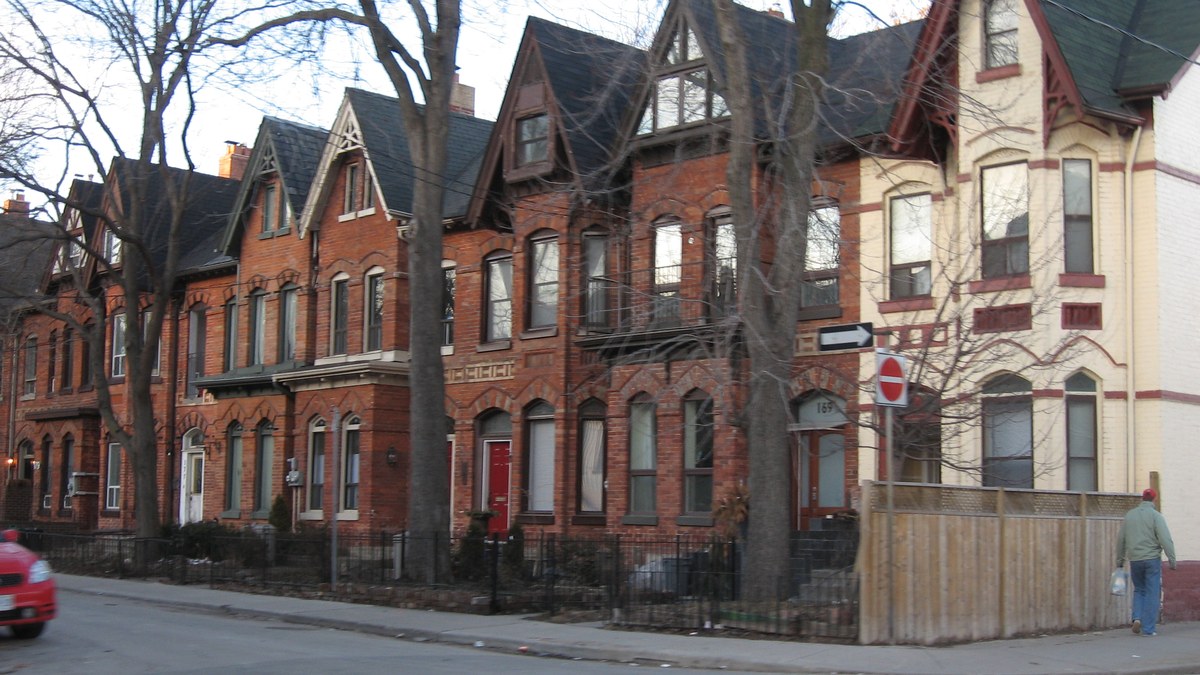
16.3 percent of millennials aged 25 to 39 lived with at least one parent in 2021. Boomers at the same age in 1991 — 8.2 percent. The rate has roughly doubled, and the figure is from the last census, before mortgage rates and rents climbed further.
How these numbers work. Price changes come from Statistics Canada's consumer price index (table 18-10-0004), which tracks what the same basket of goods and services costs from month to month. "Groceries" is food bought in stores. "Rent" is what tenants pay, not the asking rent on new listings. Wages are average hourly earnings for all employees from the Labour Force Survey (table 14-10-0063). They are not seasonally adjusted, so we compare each month with the same month in earlier years. An average wage can rise because low-paid jobs disappear, not only because people get raises, so it is a guide, not a measure of any one household.