Labour · 6 min read
A 20-year job is getting rarer in Canada, even in the public sector
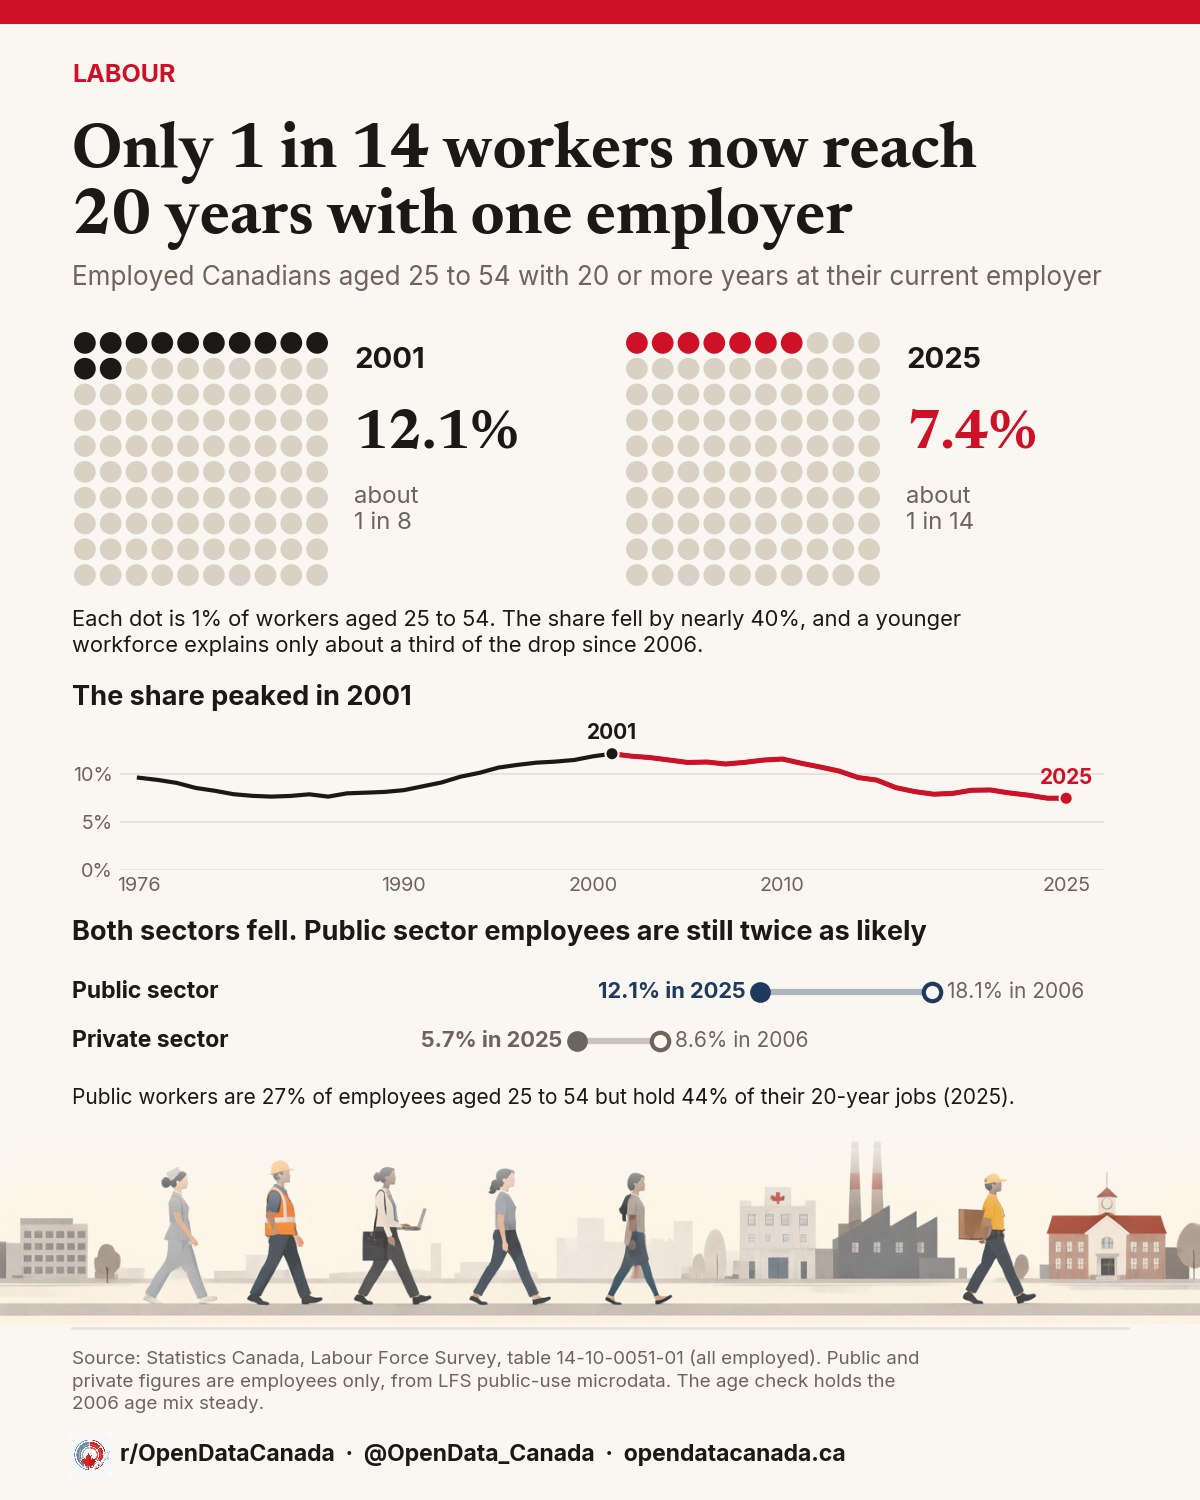
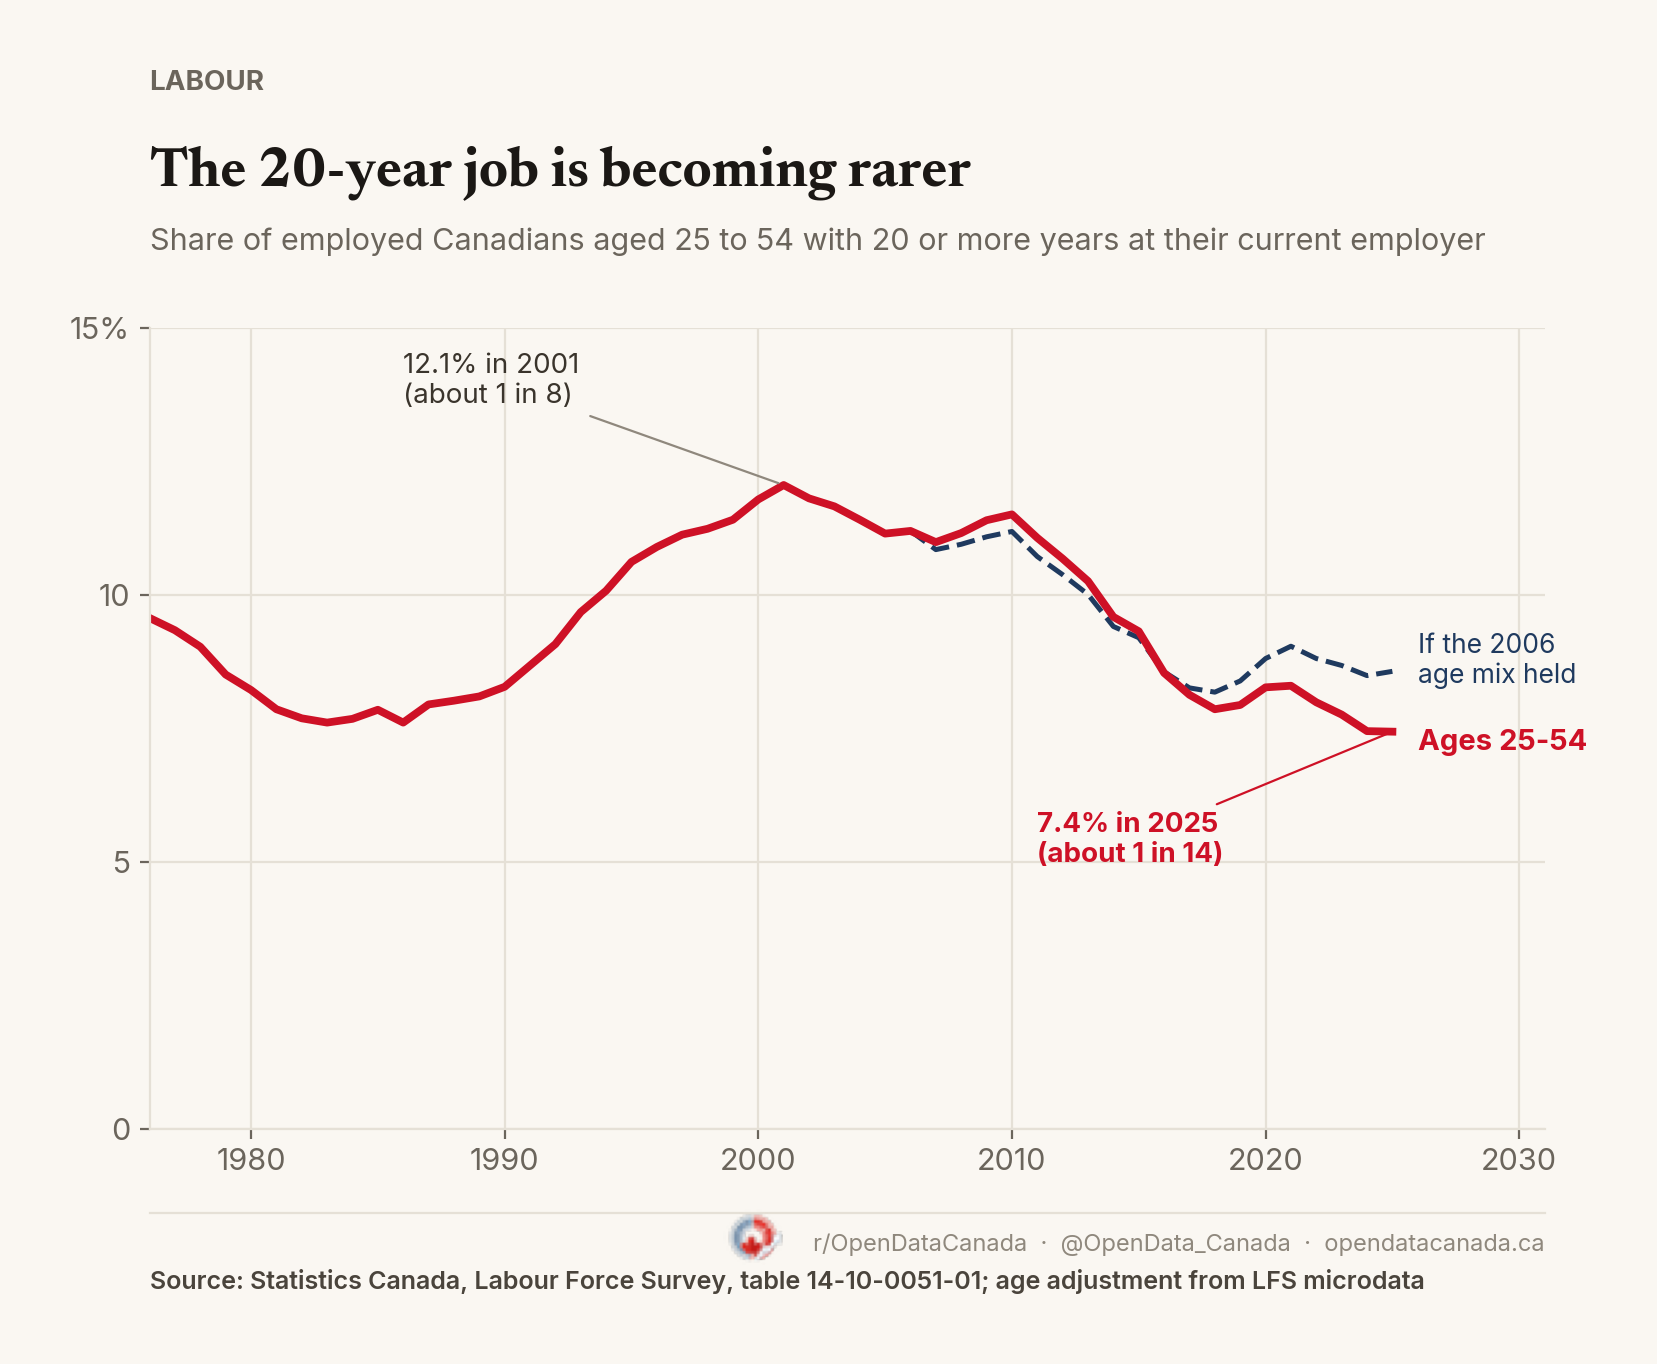
In 2001, about 1 in 8 employed Canadians aged 25 to 54 had spent 20 years or more with their current employer or in their current business. By 2025 it was about 1 in 14. Public sector employees are still twice as likely as private sector employees to have a job that long.
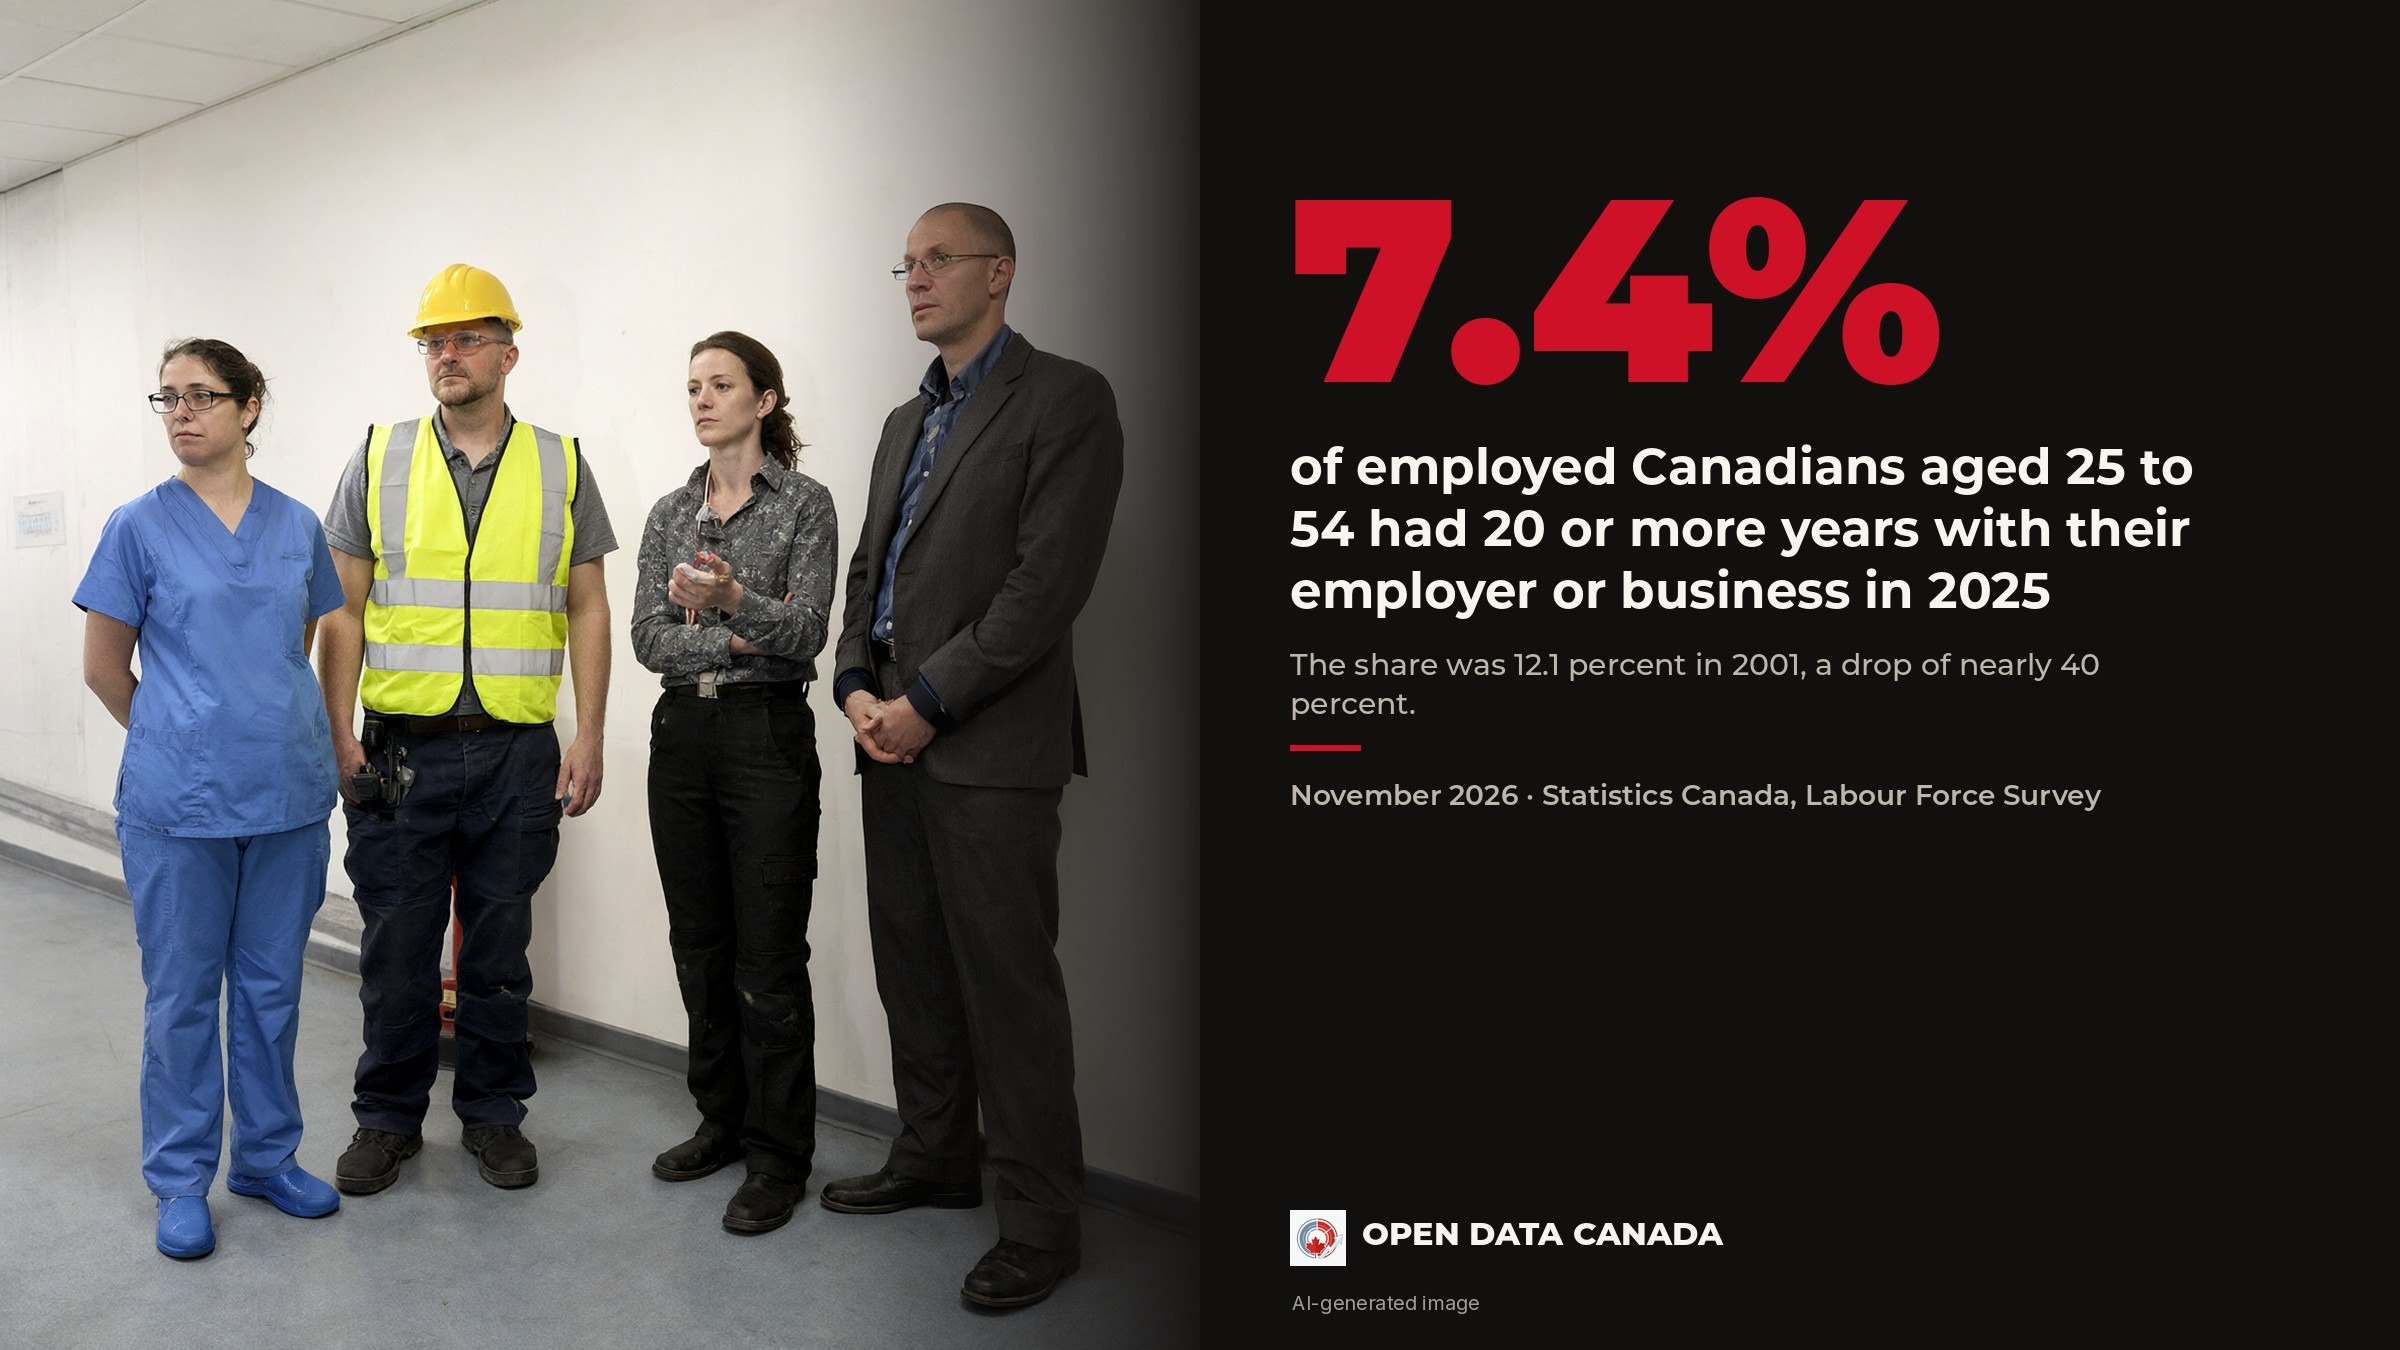
In 2001, about 1 in 8 employed Canadians aged 25 to 54 had spent at least 20 years with their current employer or in their current business. By 2025, about 1 in 14 had. The share dropped from 12.1 percent to 7.4 percent, a fall of nearly 40 percent.
Why the headline number hides it
Across all employed Canadians aged 15 and over, the share with 20 or more years at one employer is about 12 percent, nearly where it was in 2001. Older workers, who built their long jobs decades ago, hold that figure up. Looking only at people aged 25 to 54 shows what is happening to the workers who are still building a career.
Part of the fall comes from who is in that age group. Among the microdata, the 25 to 54 group got younger between 2006 and 2025: the share aged 25 to 39 rose from 46 percent to 53 percent, and younger workers have had less time to reach 20 years. Reweighting the five-year age groups to either their 2006 or 2025 proportions still leaves a fall of 2.3 to 2.6 percentage points, compared with the observed 3.8-point fall. Roughly two-thirds of the decline remains after accounting for the changing age mix.
The decline sped up after 2011. The share was 11.1 percent that year, 9.3 percent in 2015 and 7.9 percent in 2018. It has hovered between about 7.4 and 8.3 percent since.
Public sector jobs last longer
Public sector employees aged 25 to 54 (see also public sector work from home) are about twice as likely as private sector employees to have 20 or more years with their employer: 12.1 percent against 5.7 percent in 2025. The ratio was the same in 2006, at 18.1 percent against 8.6 percent. The gap is not new, but both sides have fallen.
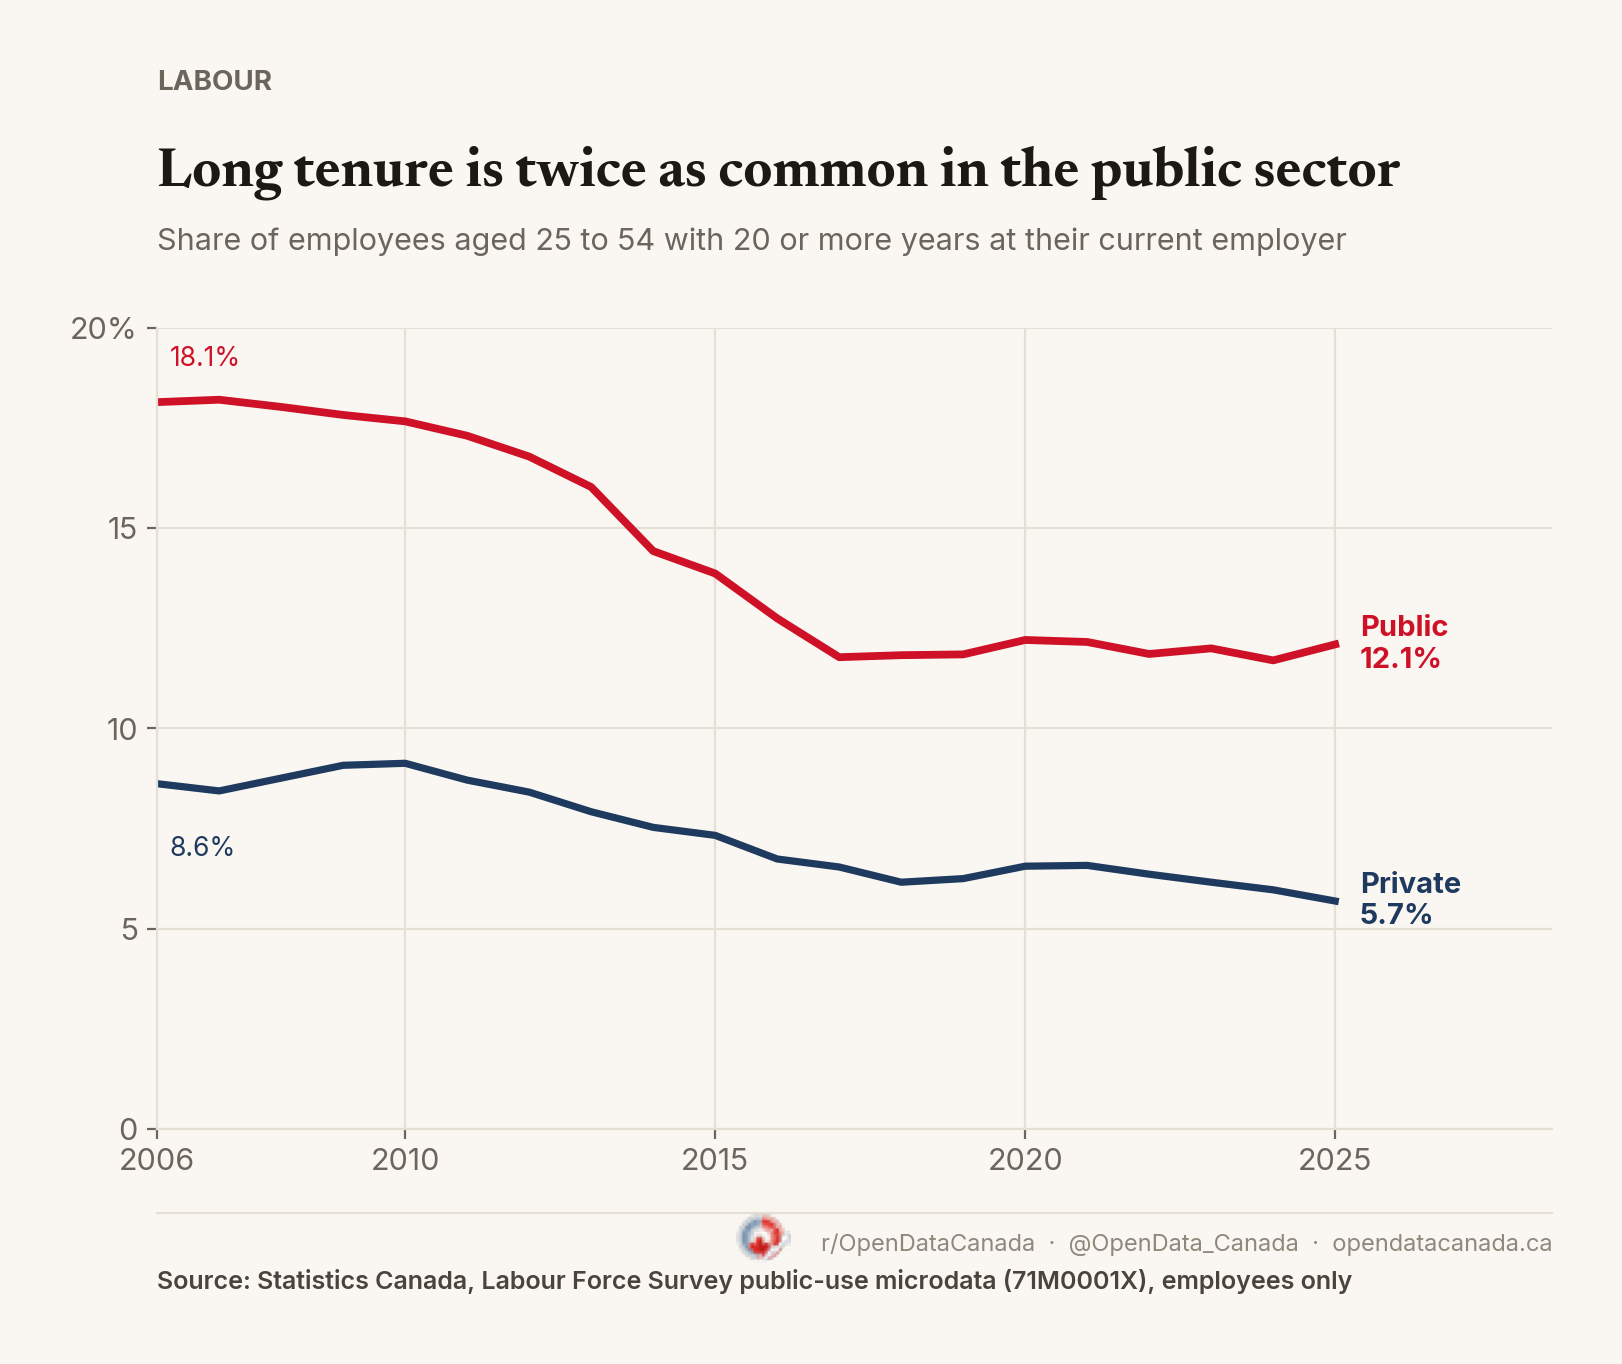
Public sector workers make up 27 percent of employees aged 25 to 54, yet they account for 44 percent of the employees in that age group who have 20 or more years of tenure. Differences in education do not explain the gap. Even among workers of the same age and education level, public sector employees were about 1.8 times as likely to have 20 years or more. That is an association. The data cannot say whether public employment itself, or differences in occupation, pensions or union contracts, produces the longer tenure.
The decline extends across the workforce
The microdata, which start in 2006, show the decline across several different groups of workers. Between 2006 and 2025, among people aged 25 to 54:
- Born in Canada: 12.7 to 9.1 percent
- Union members: 18.9 to 11.6 percent (see union coverage in Alberta and Ontario)
- Not in a union: 6.8 to 5.4 percent
- Full-time: 12.0 to 7.9 percent
- Part-time: 6.5 to 4.2 percent
- Permanent jobs: 11.9 to 8.0 percent
Part-time work did not grow as a share of employment over that period (11.6 to 10.6 percent), so a shift toward part-time jobs does not explain it either.
What the numbers do not say
Job tenure measures how long someone has been with their current employer or in their current business, including the self-employed. It does not measure how long they have worked, and it does not show whether jobs are more or less secure. Someone who changed employers by choice counts as a short tenure. The data also cannot say why the share fell. It shows when the fall happened, who it covers and where it has not happened, and it shows that a changing age mix explains only part of the fall.
Across all employed Canadians aged 15 and over, the figure barely moved. Among workers aged 25 to 54, it fell by nearly 40 percent.