
Charts & Maps
Charts & Maps
Every chart and map on the site, in one place — no article required. Each one is built from a named public dataset, with the method and caveats on the page.
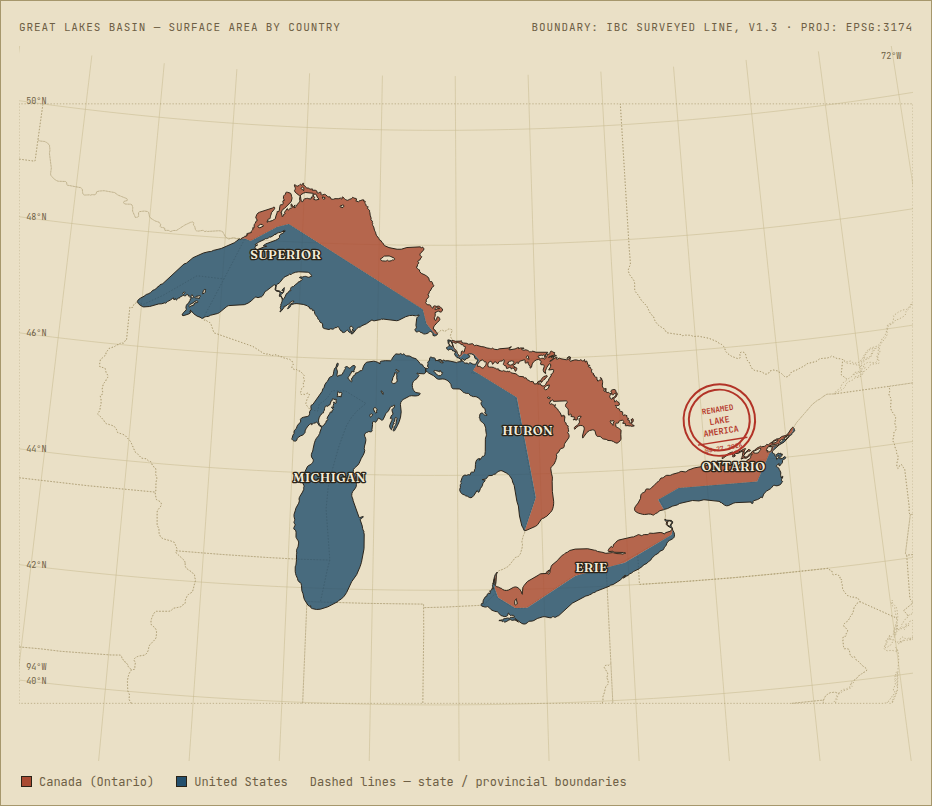
Lake Ontario is 55% Canadian water — Trump just renamed it "Lake America"
Splitting each Great Lake along the International Boundary Commission's own surveyed treaty line shows Canada holds more than a third of all five lakes combined.
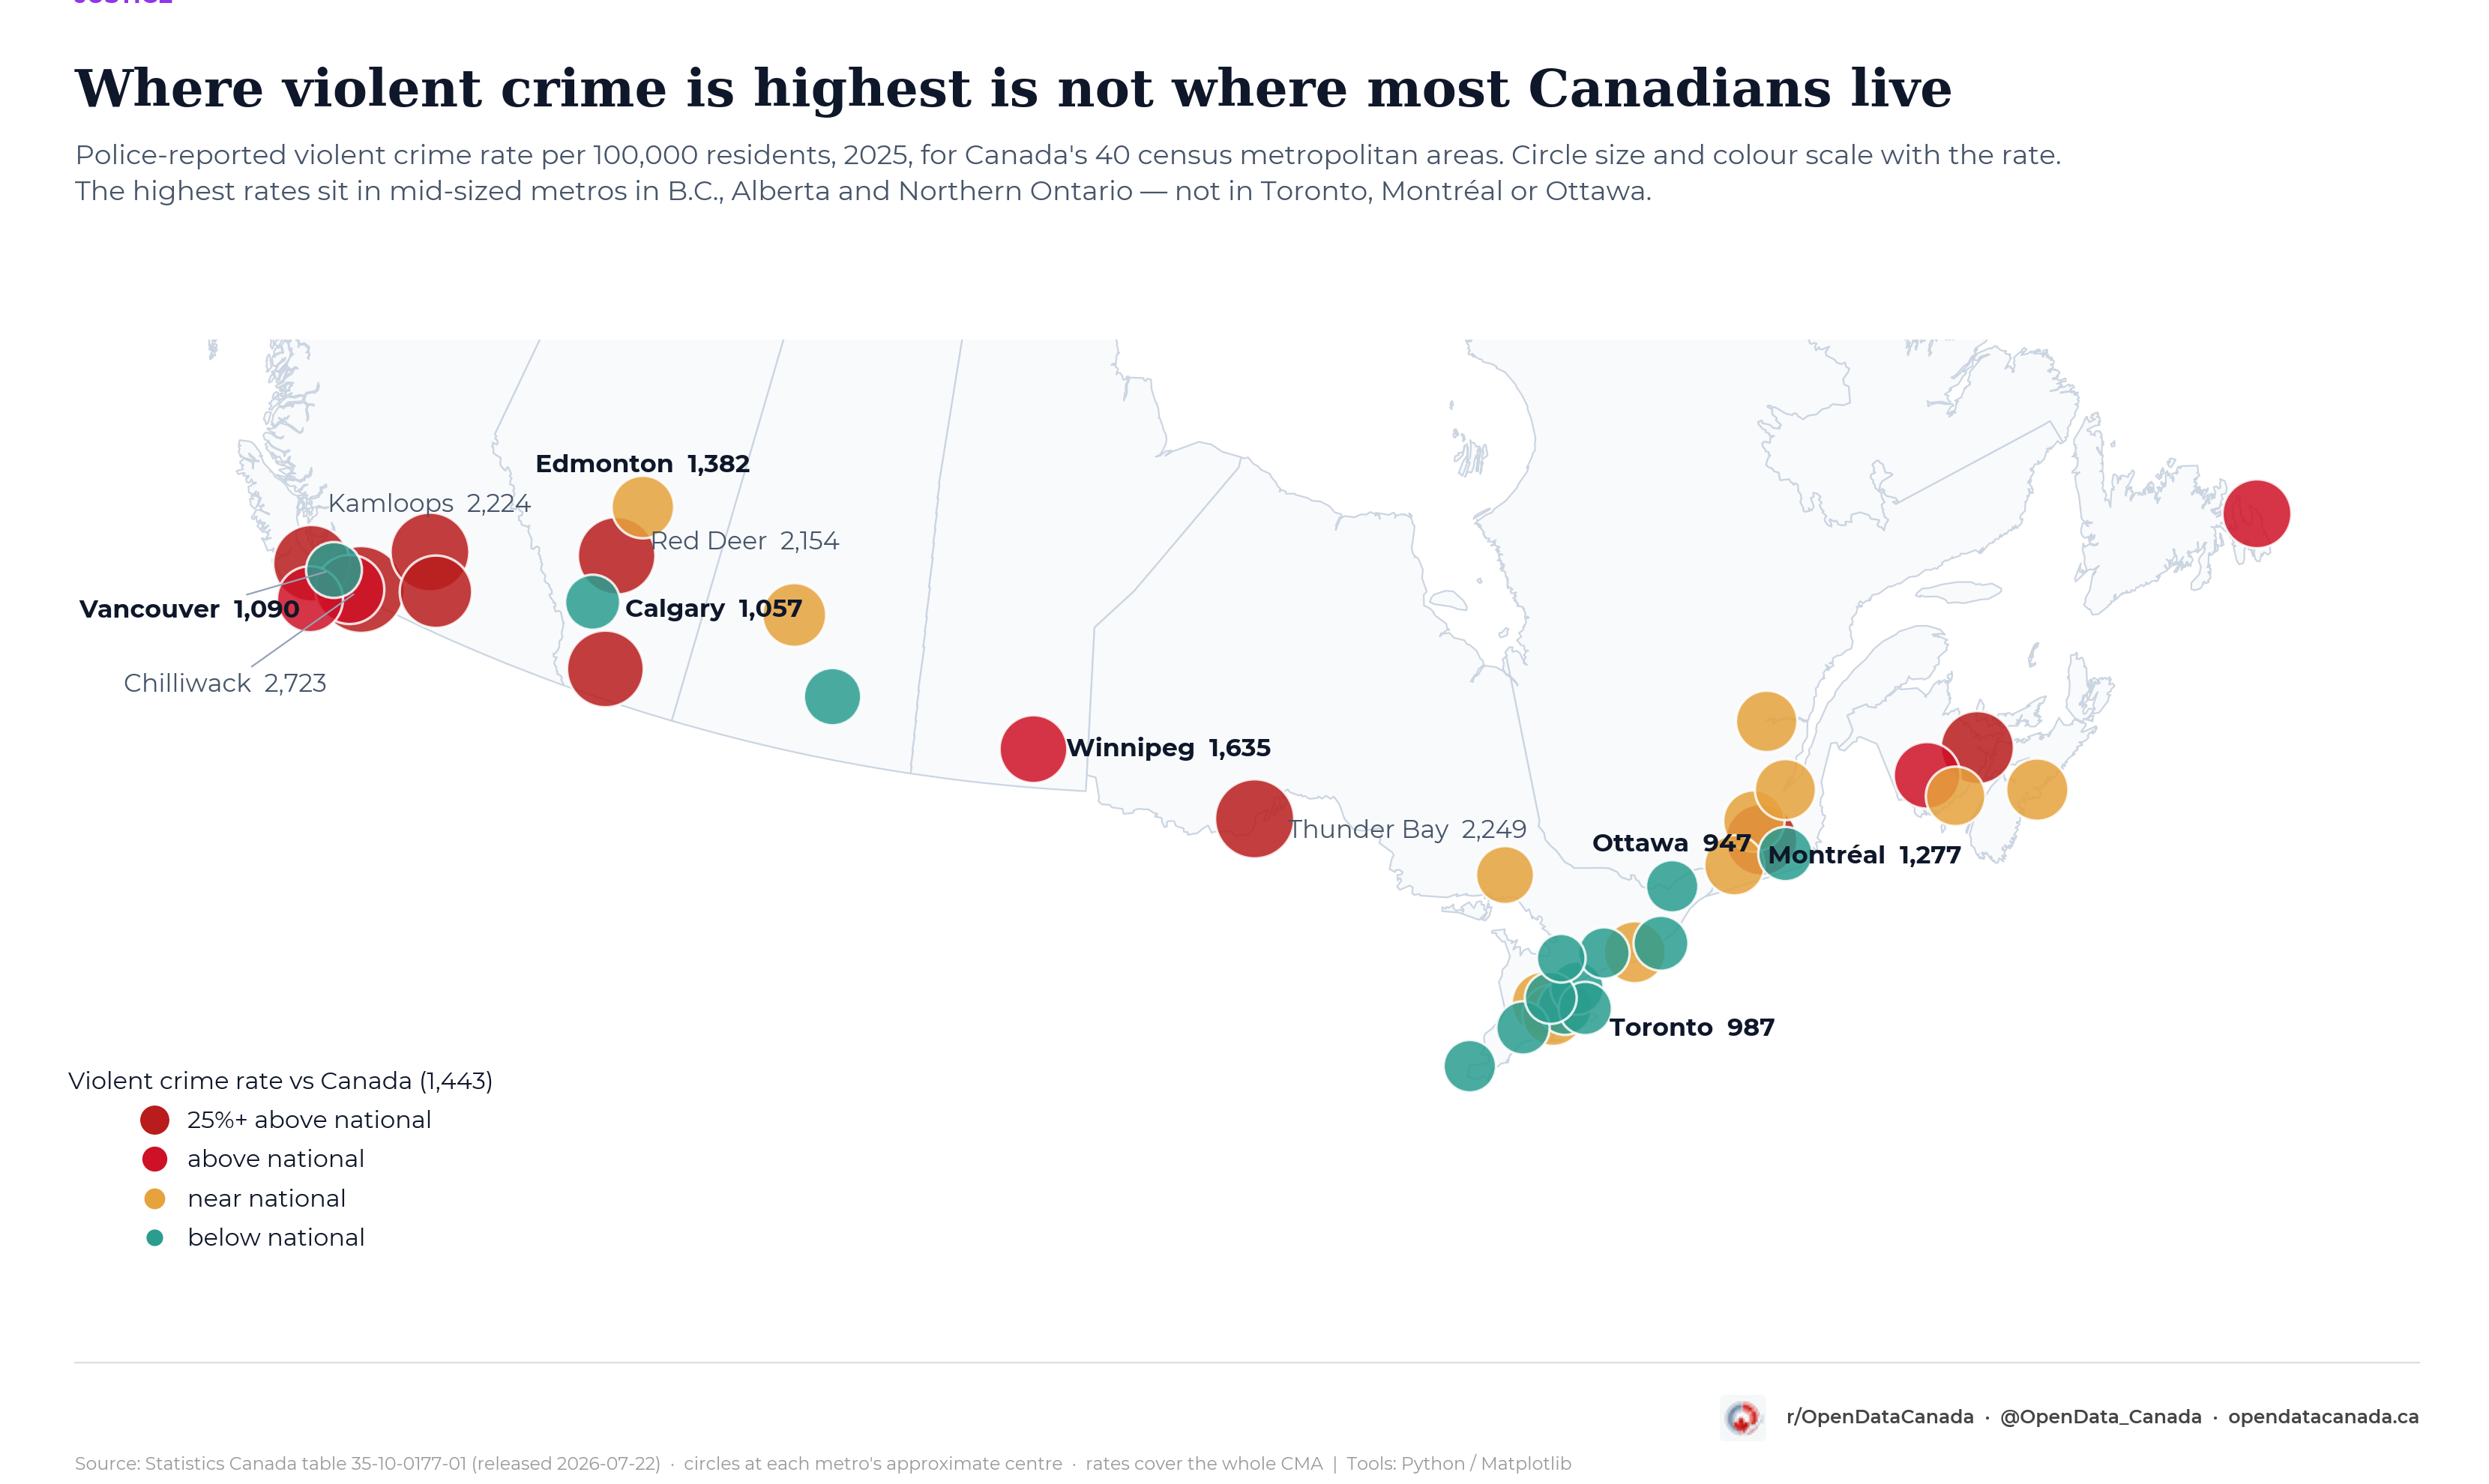
Canada's most violent cities are not its biggest ones
Chilliwack, Thunder Bay and Kamloops top the list. Toronto ranks 33rd of 40. Trace any of the 40 metros back to 1998.
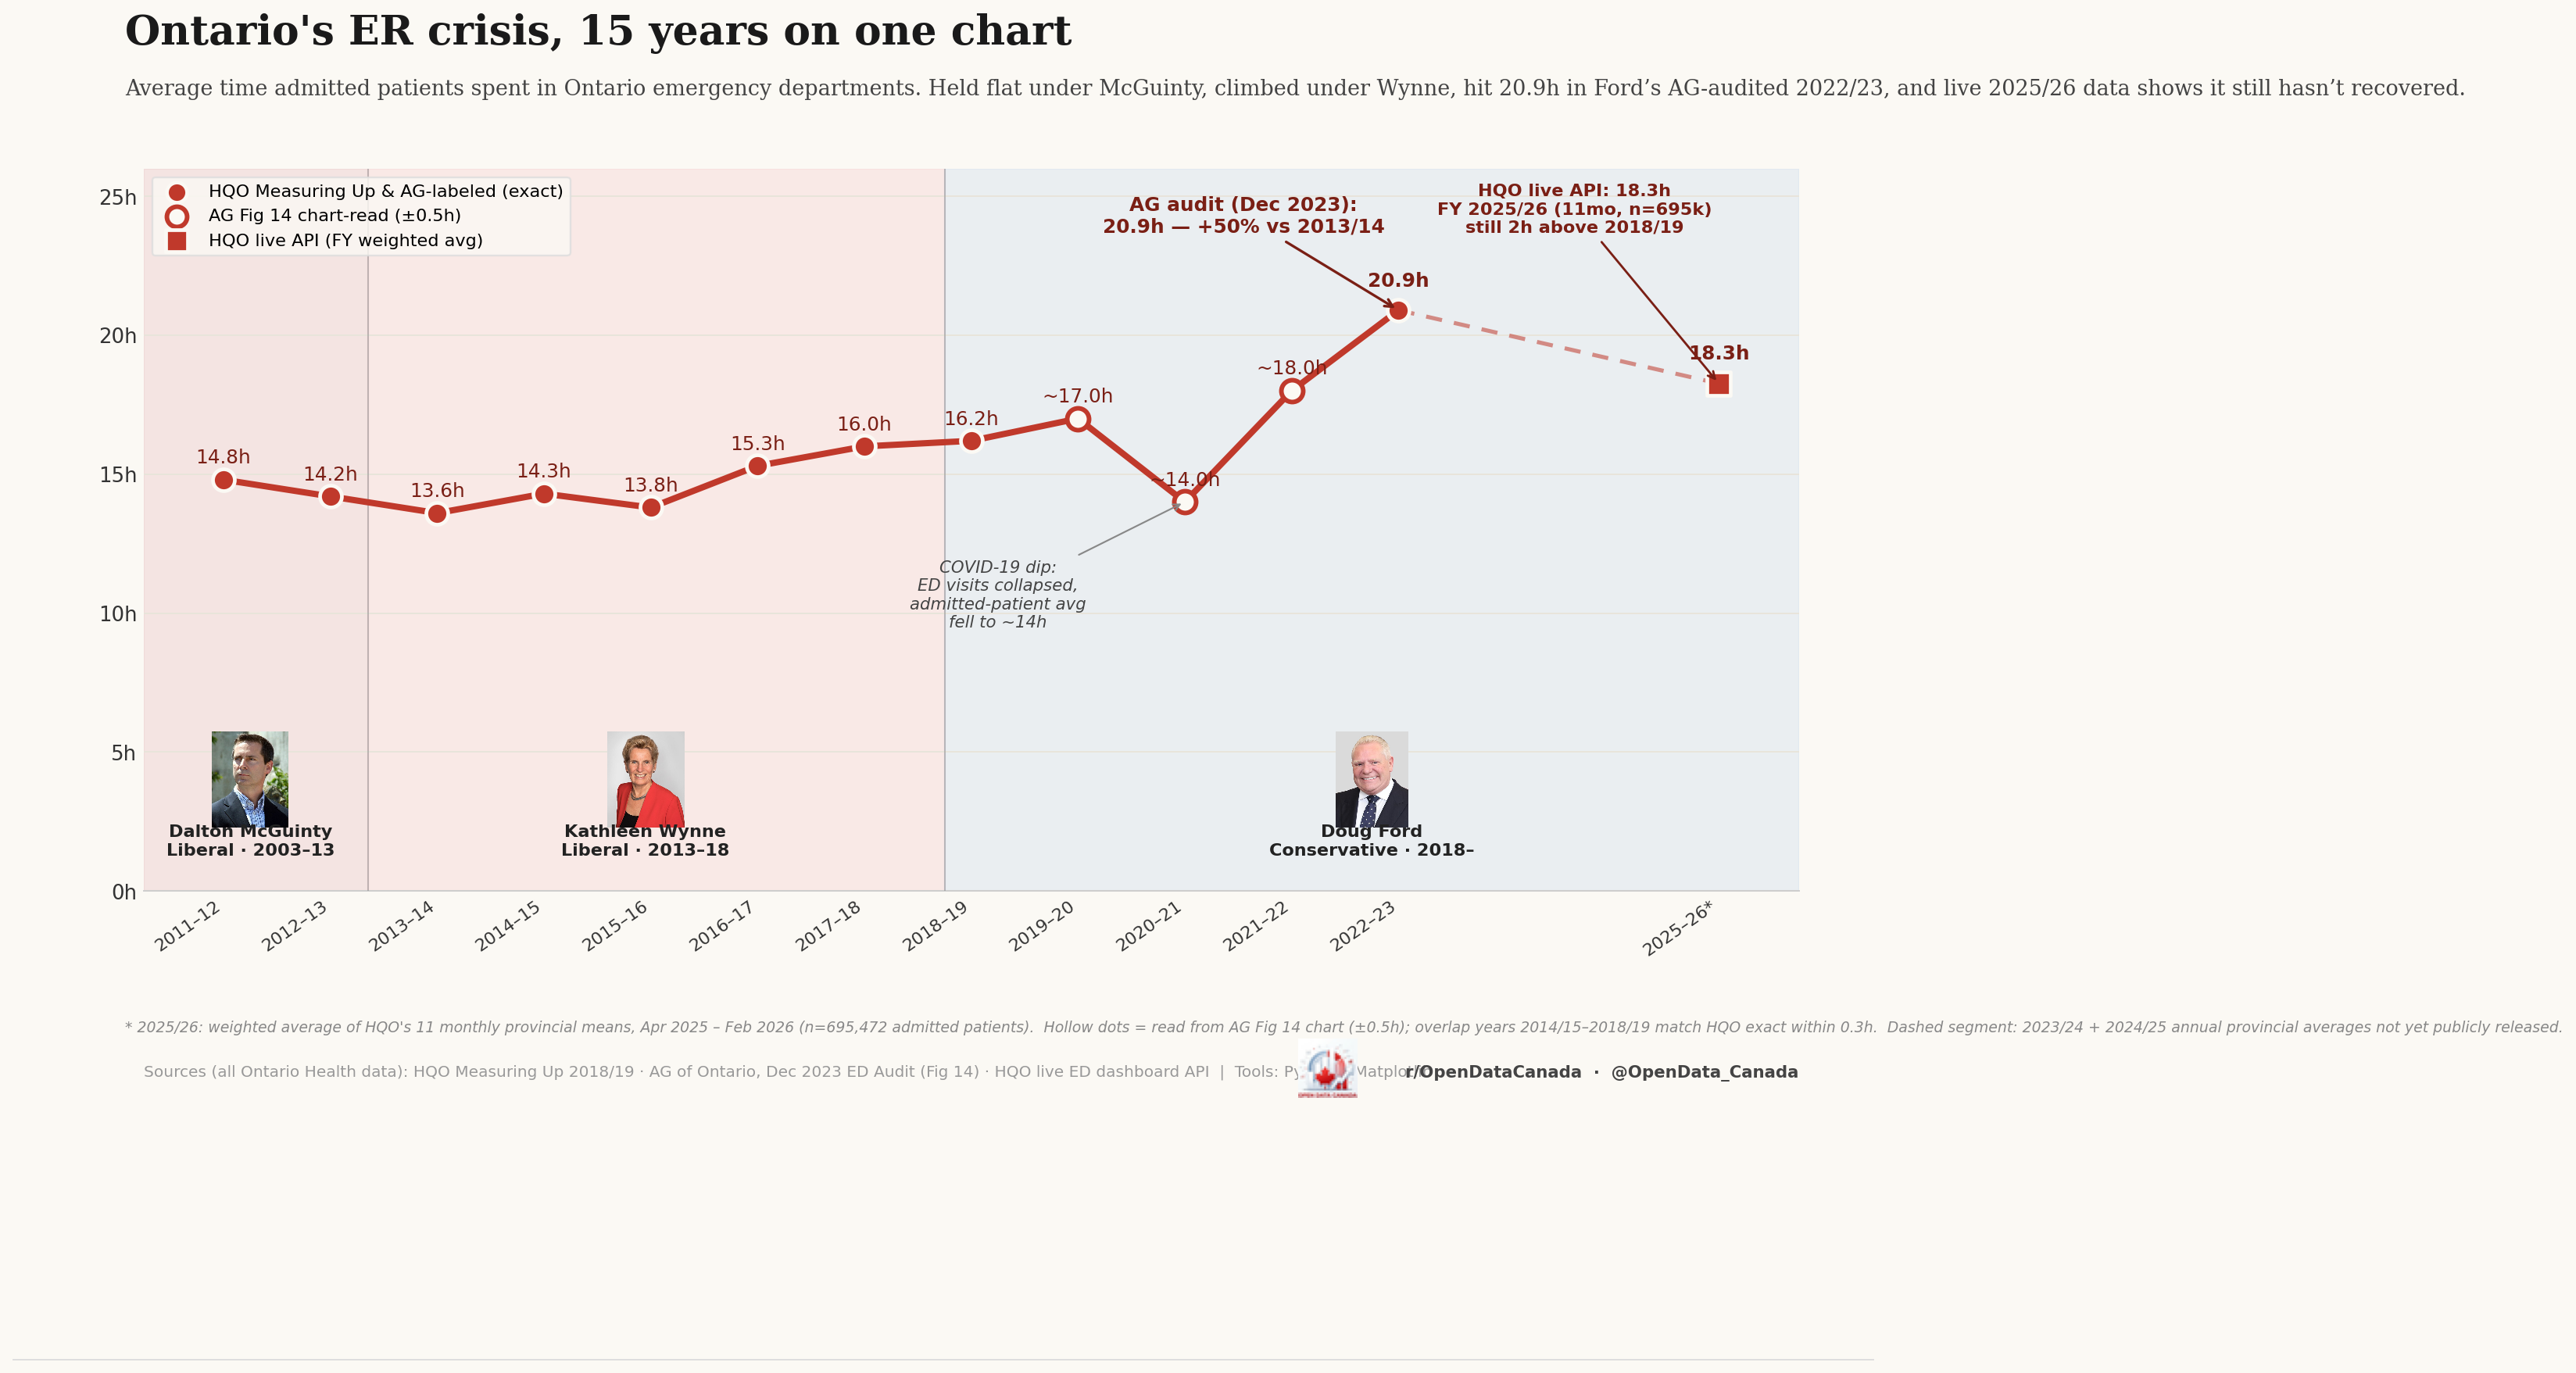
Ontario's ER crisis, 15 years on one chart
Average admitted-patient length-of-stay held flat under McGuinty, climbed under Wynne, and peaked at 20.9 hours under Ford in 2022/23 — falling since, but still above the 2014 baseline.
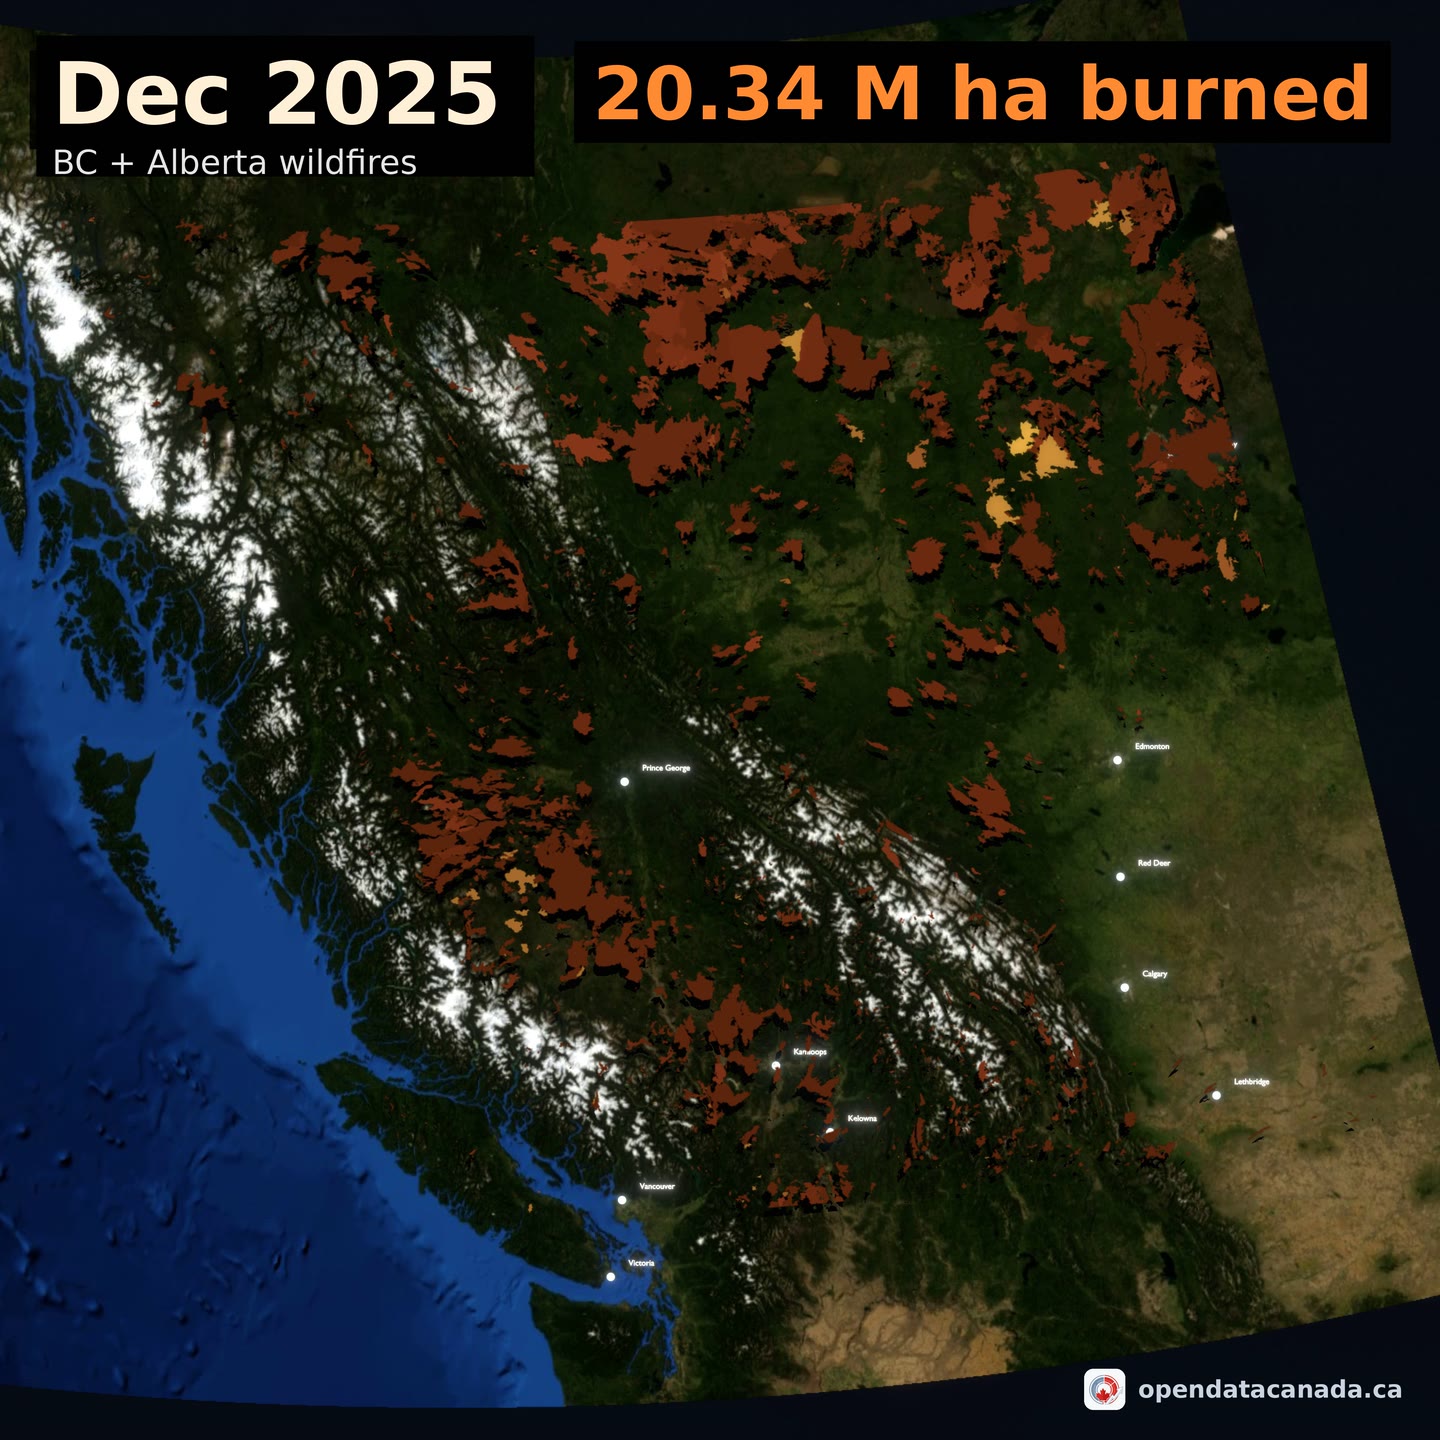
26 years of BC and Alberta wildfires, animated
20.34 million hectares burned since 2000. 2023 alone accounts for more than the whole of the 2000s combined.
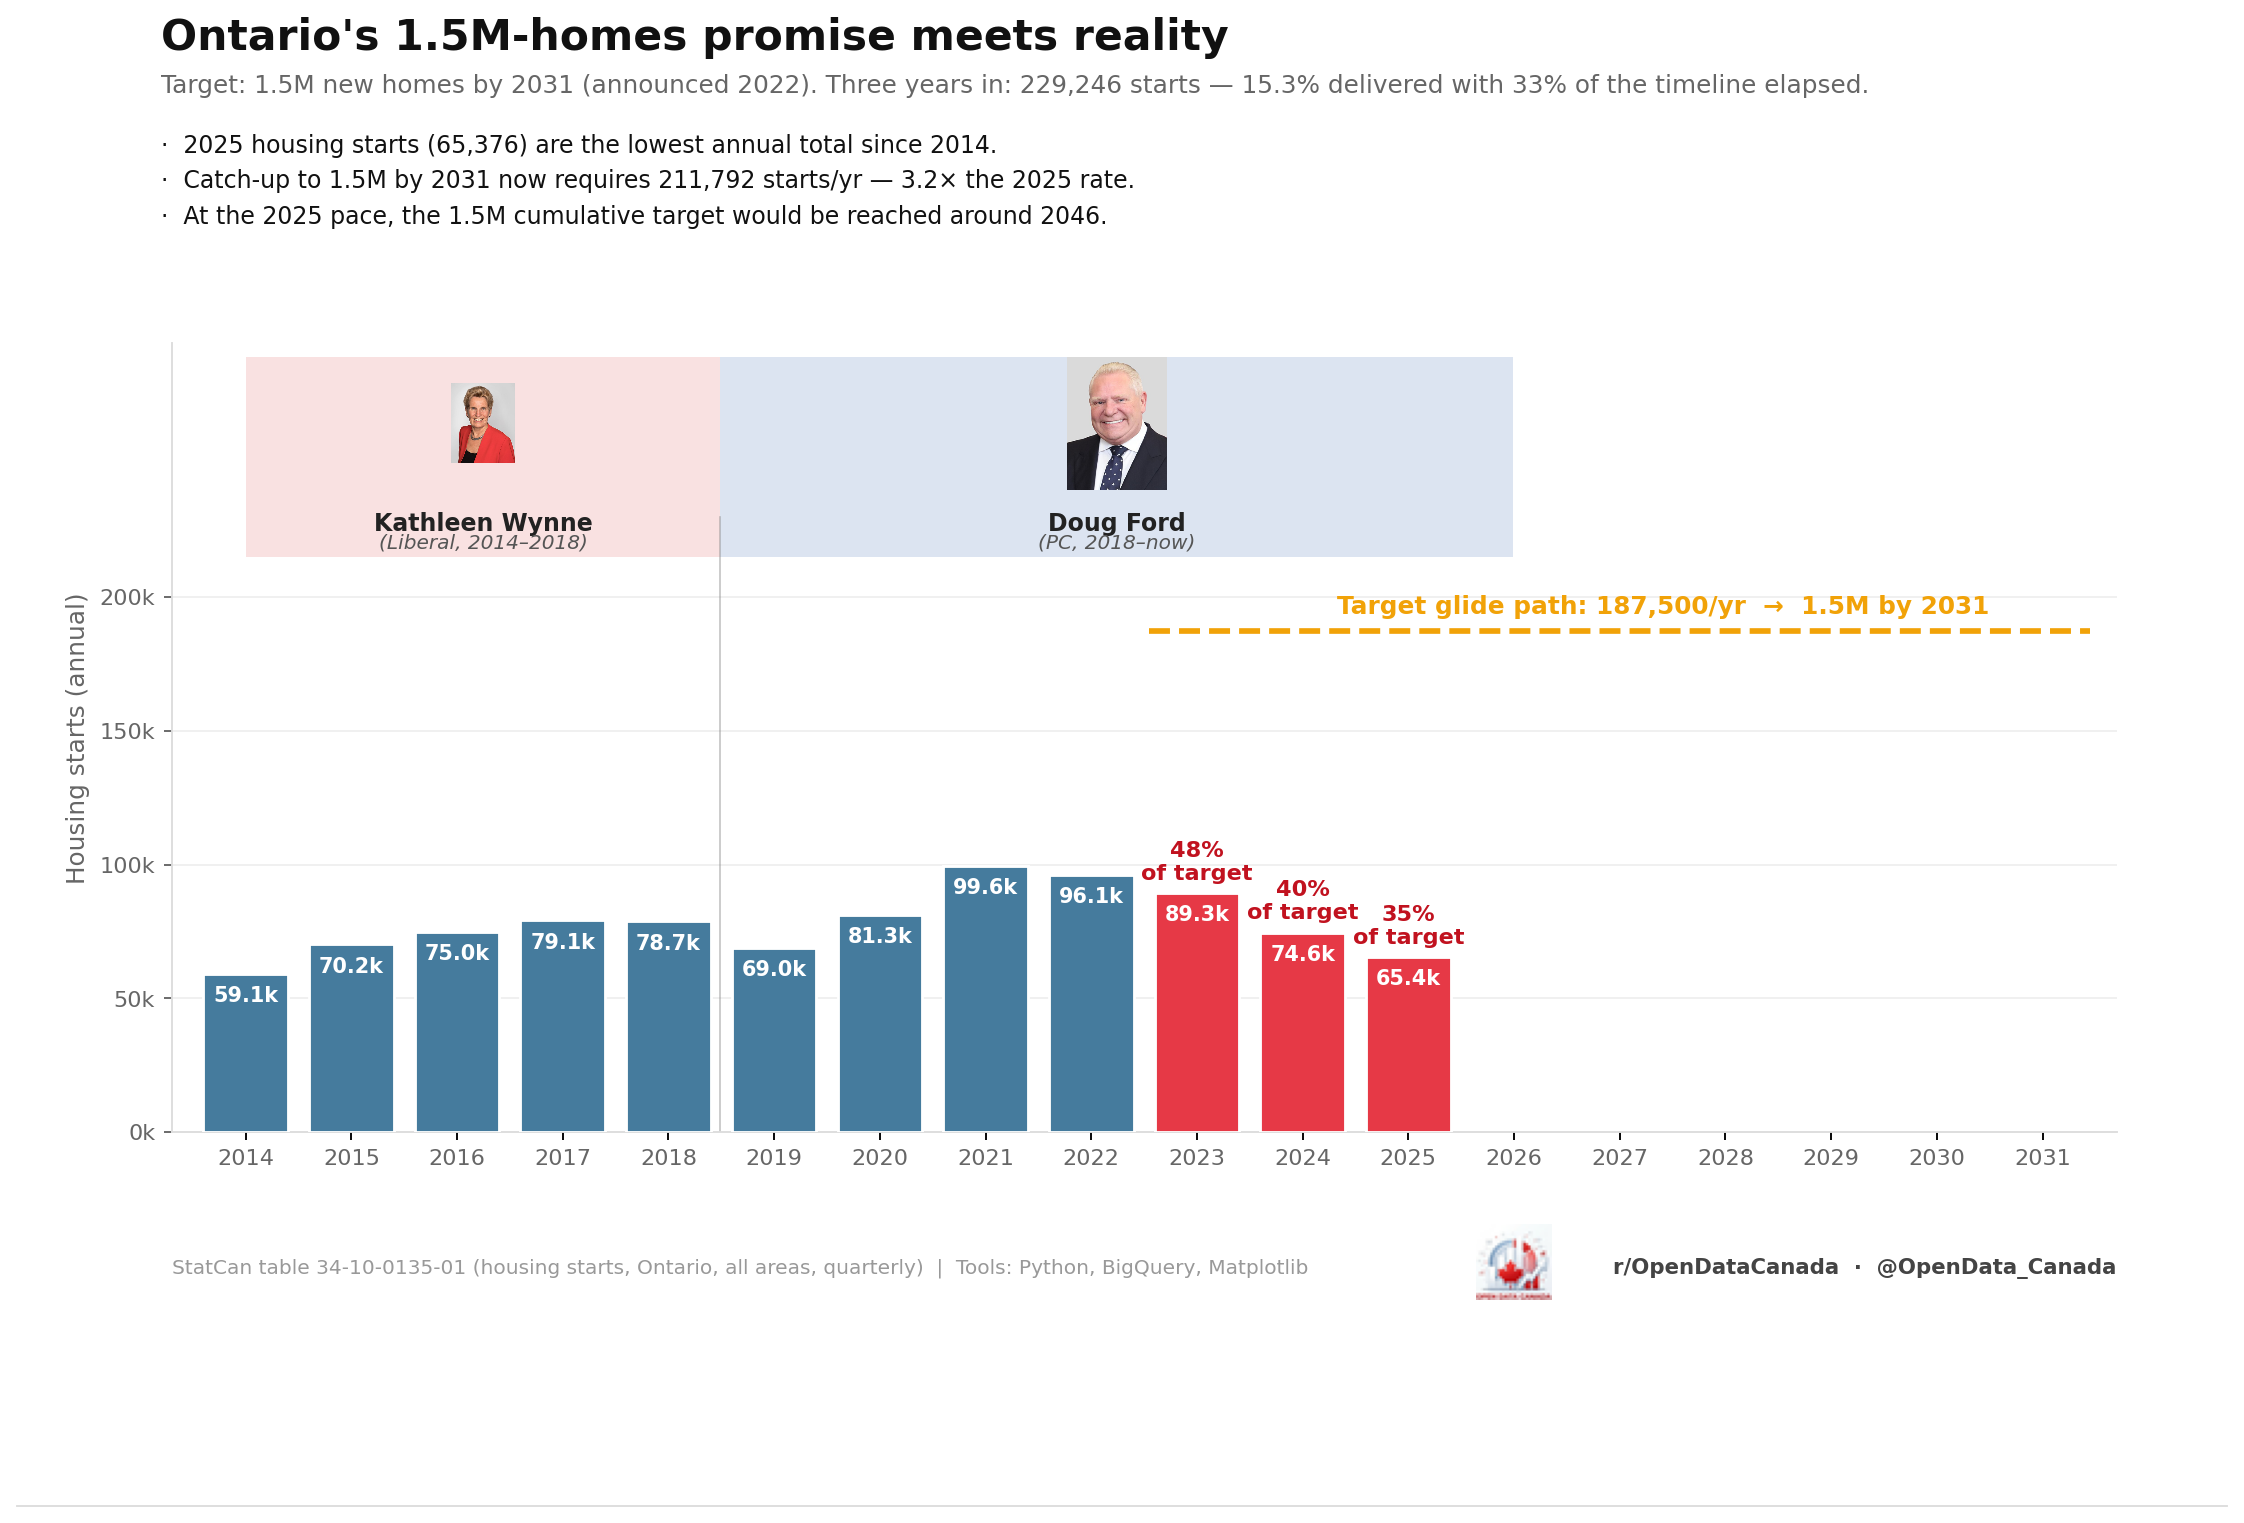
Ontario's 1.5M-homes promise meets reality
15.3% of the target delivered against 33% of the timeline elapsed. Catching up now needs 3.2× the 2025 pace.
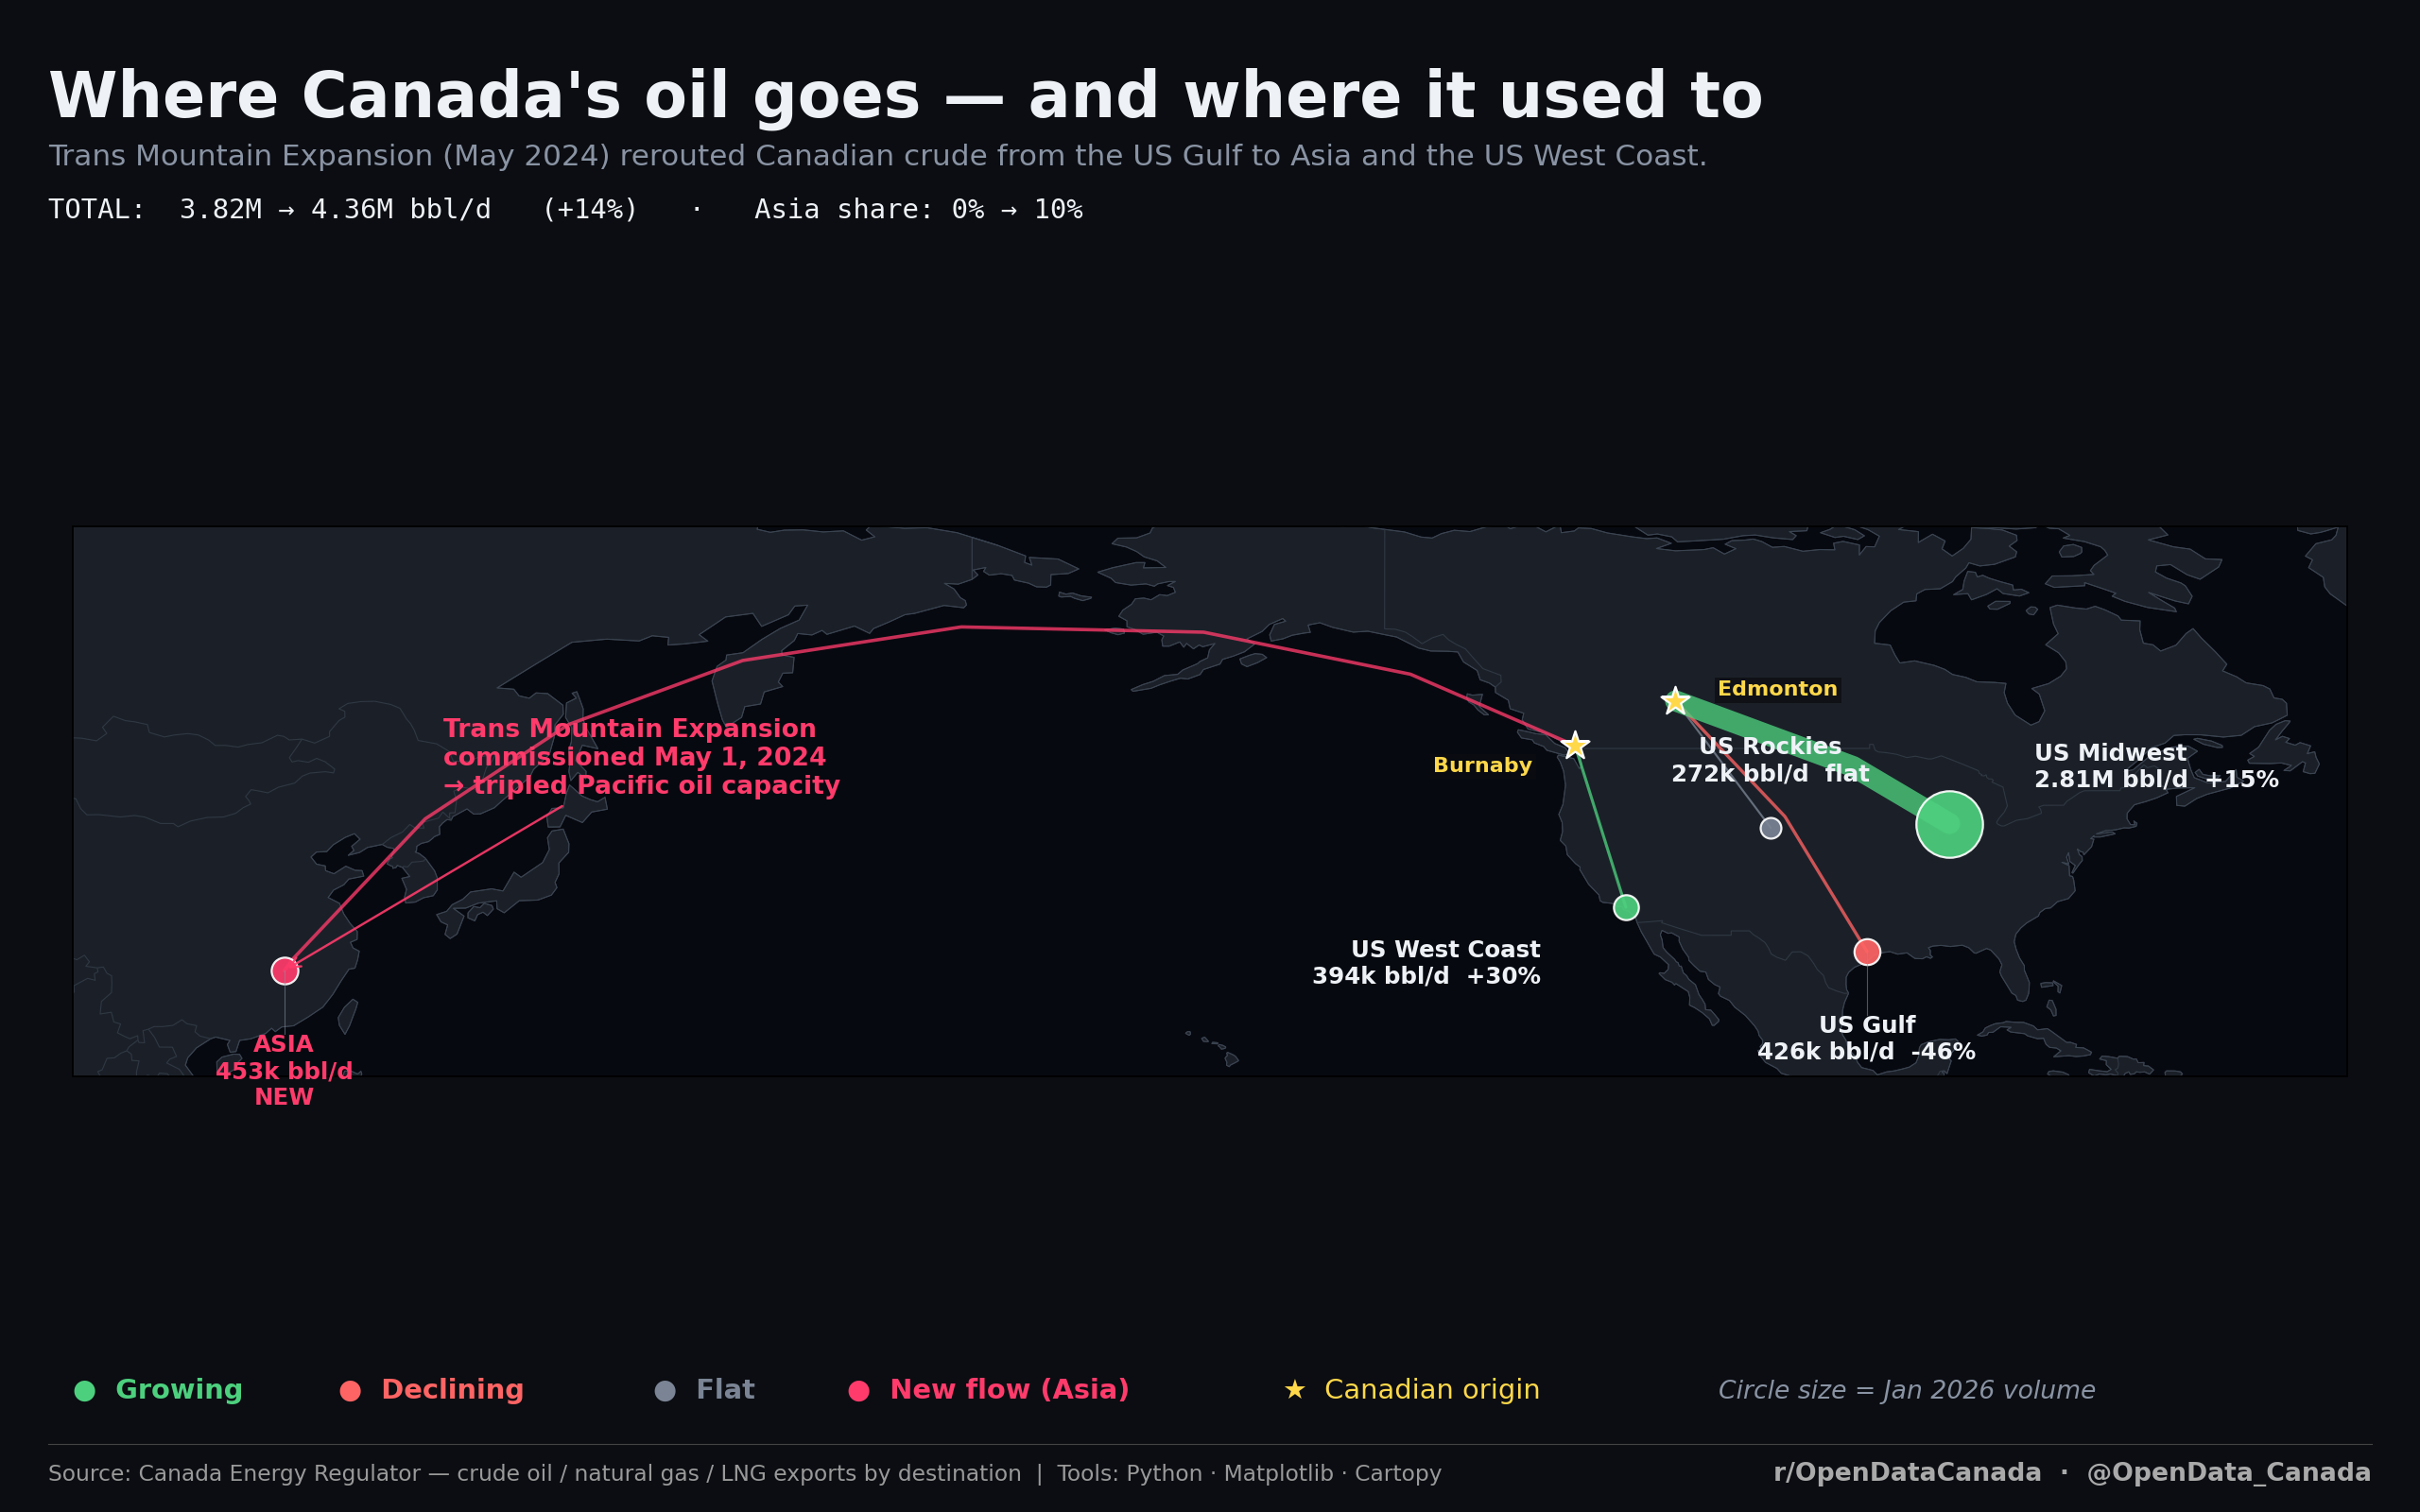
Where Canada's oil goes — and where it used to
The Trans Mountain Expansion tripled Pacific export capacity. Asia's share moved from 0% to 10%, and US Gulf-bound flows fell 46%.
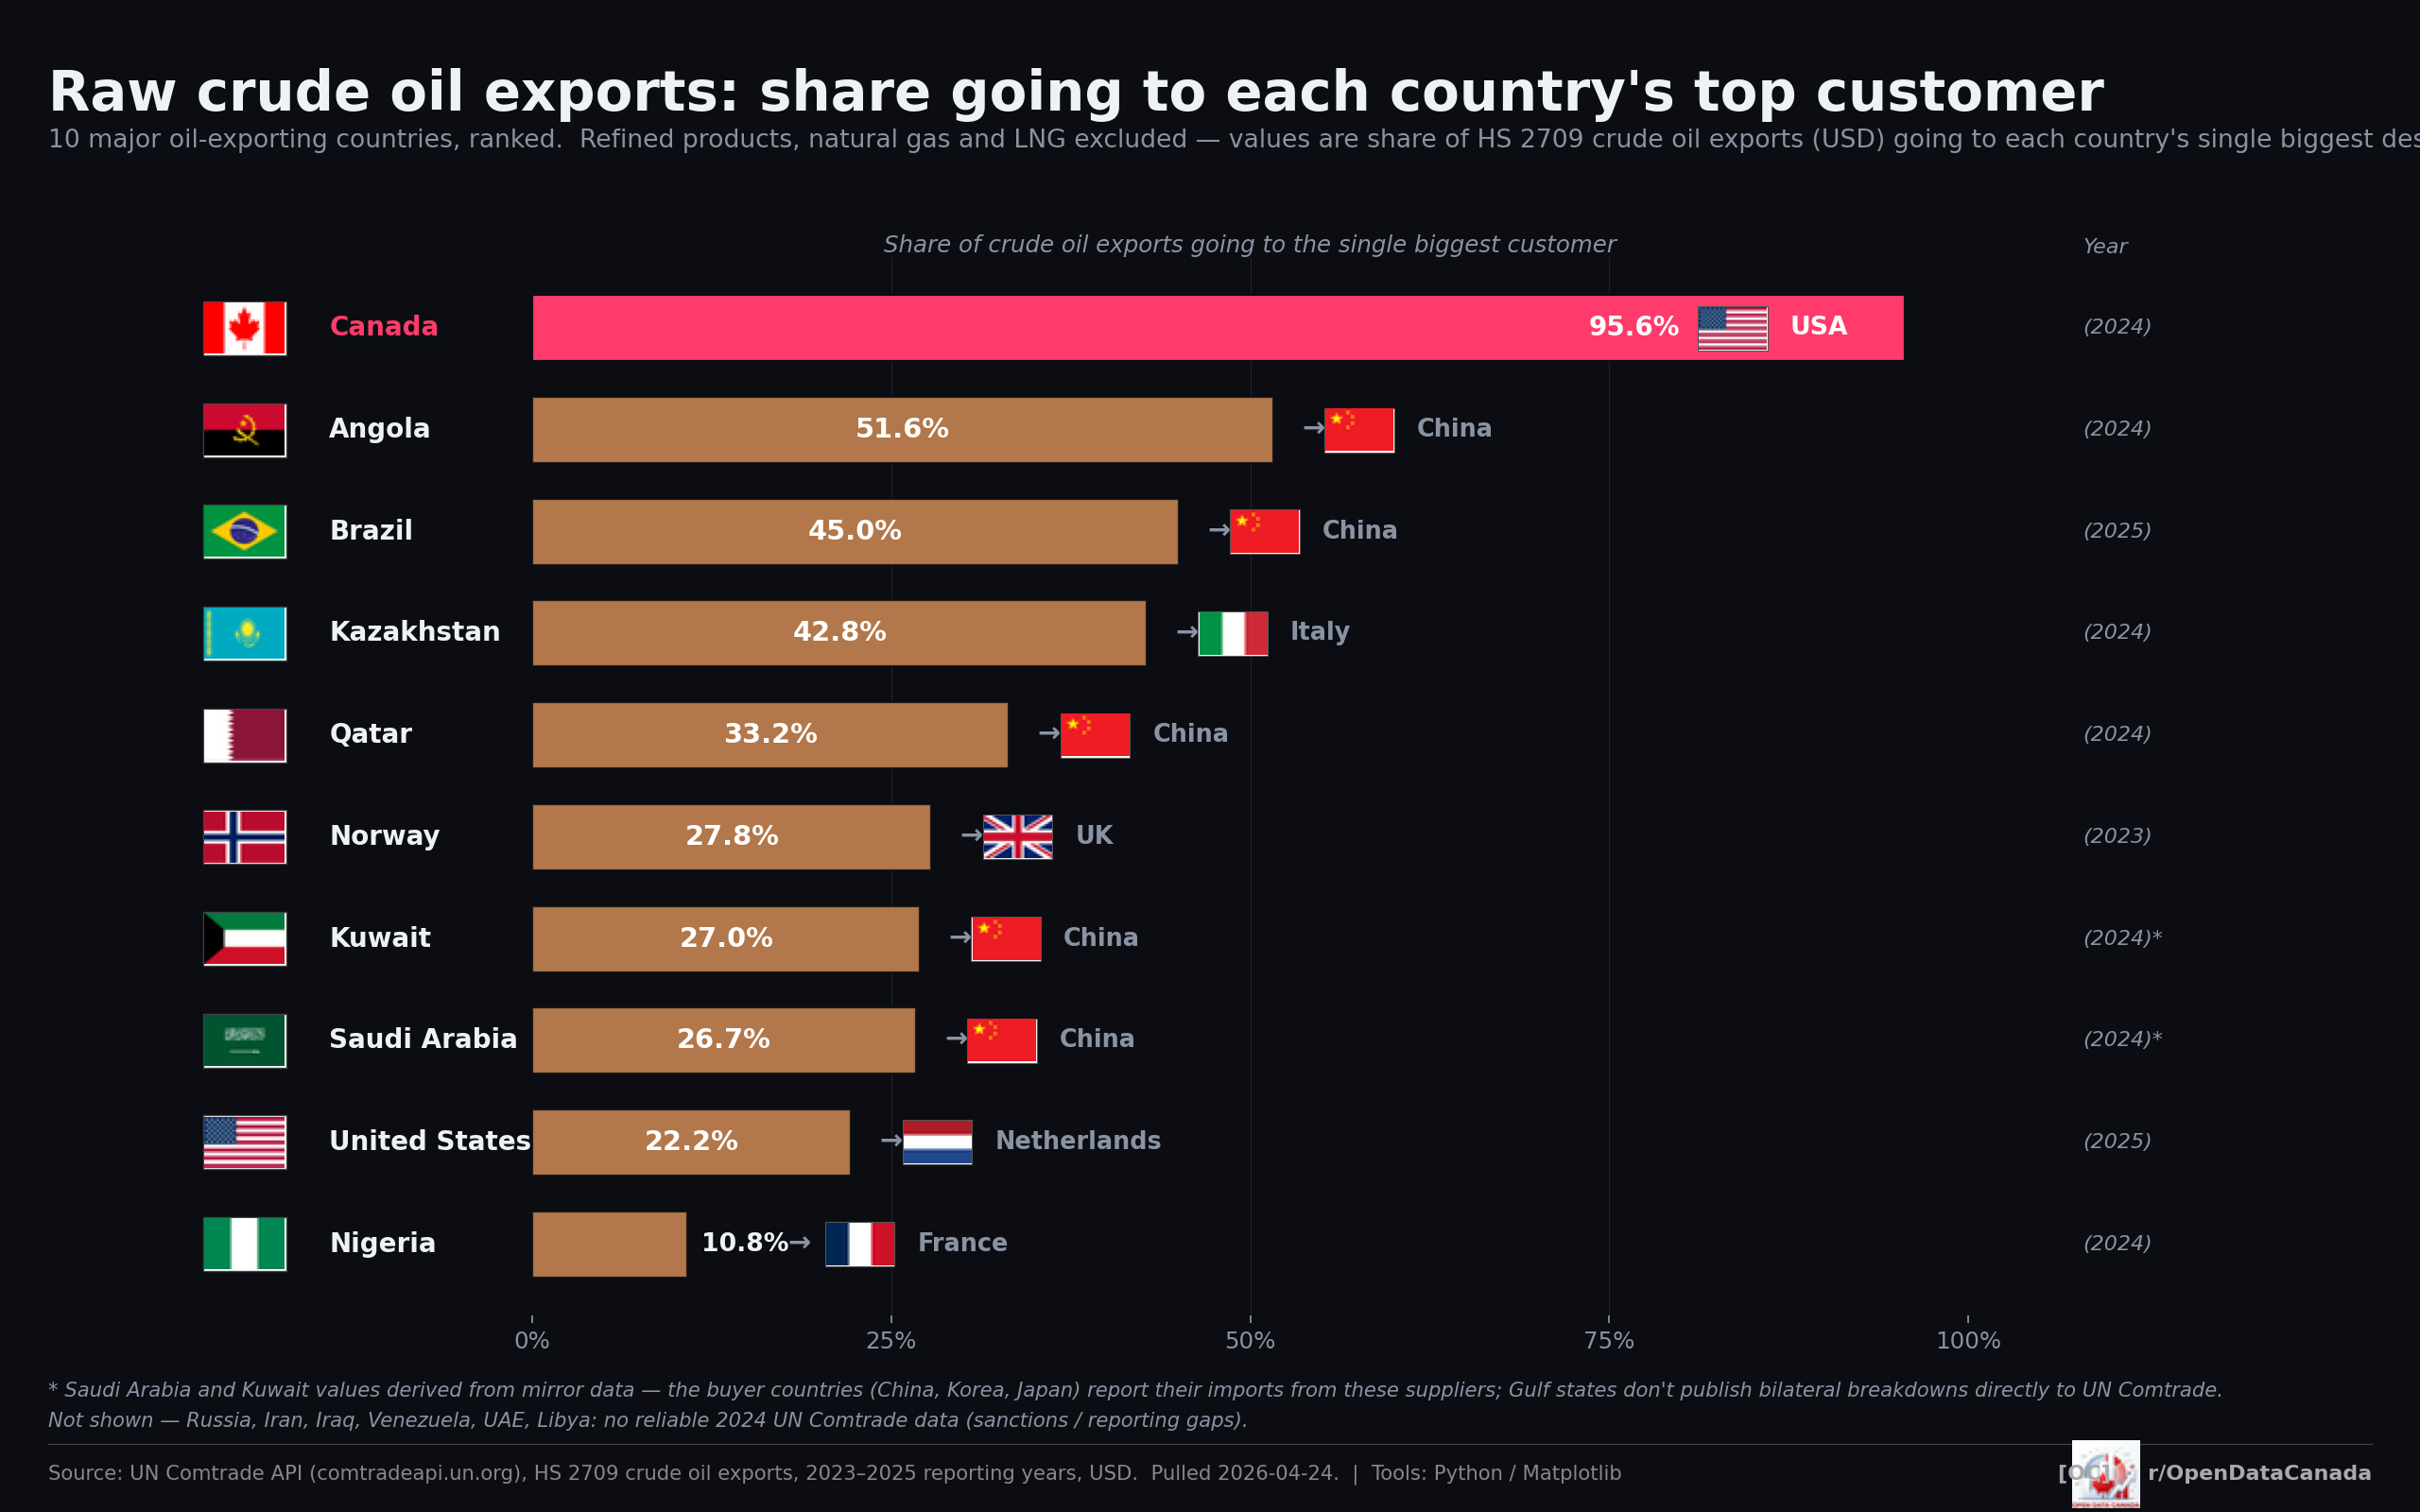
Canada is the most single-customer-dependent oil exporter in the world
95.6% of Canada's raw crude oil exports go to the United States — twice the concentration of the next-most-dependent exporter.
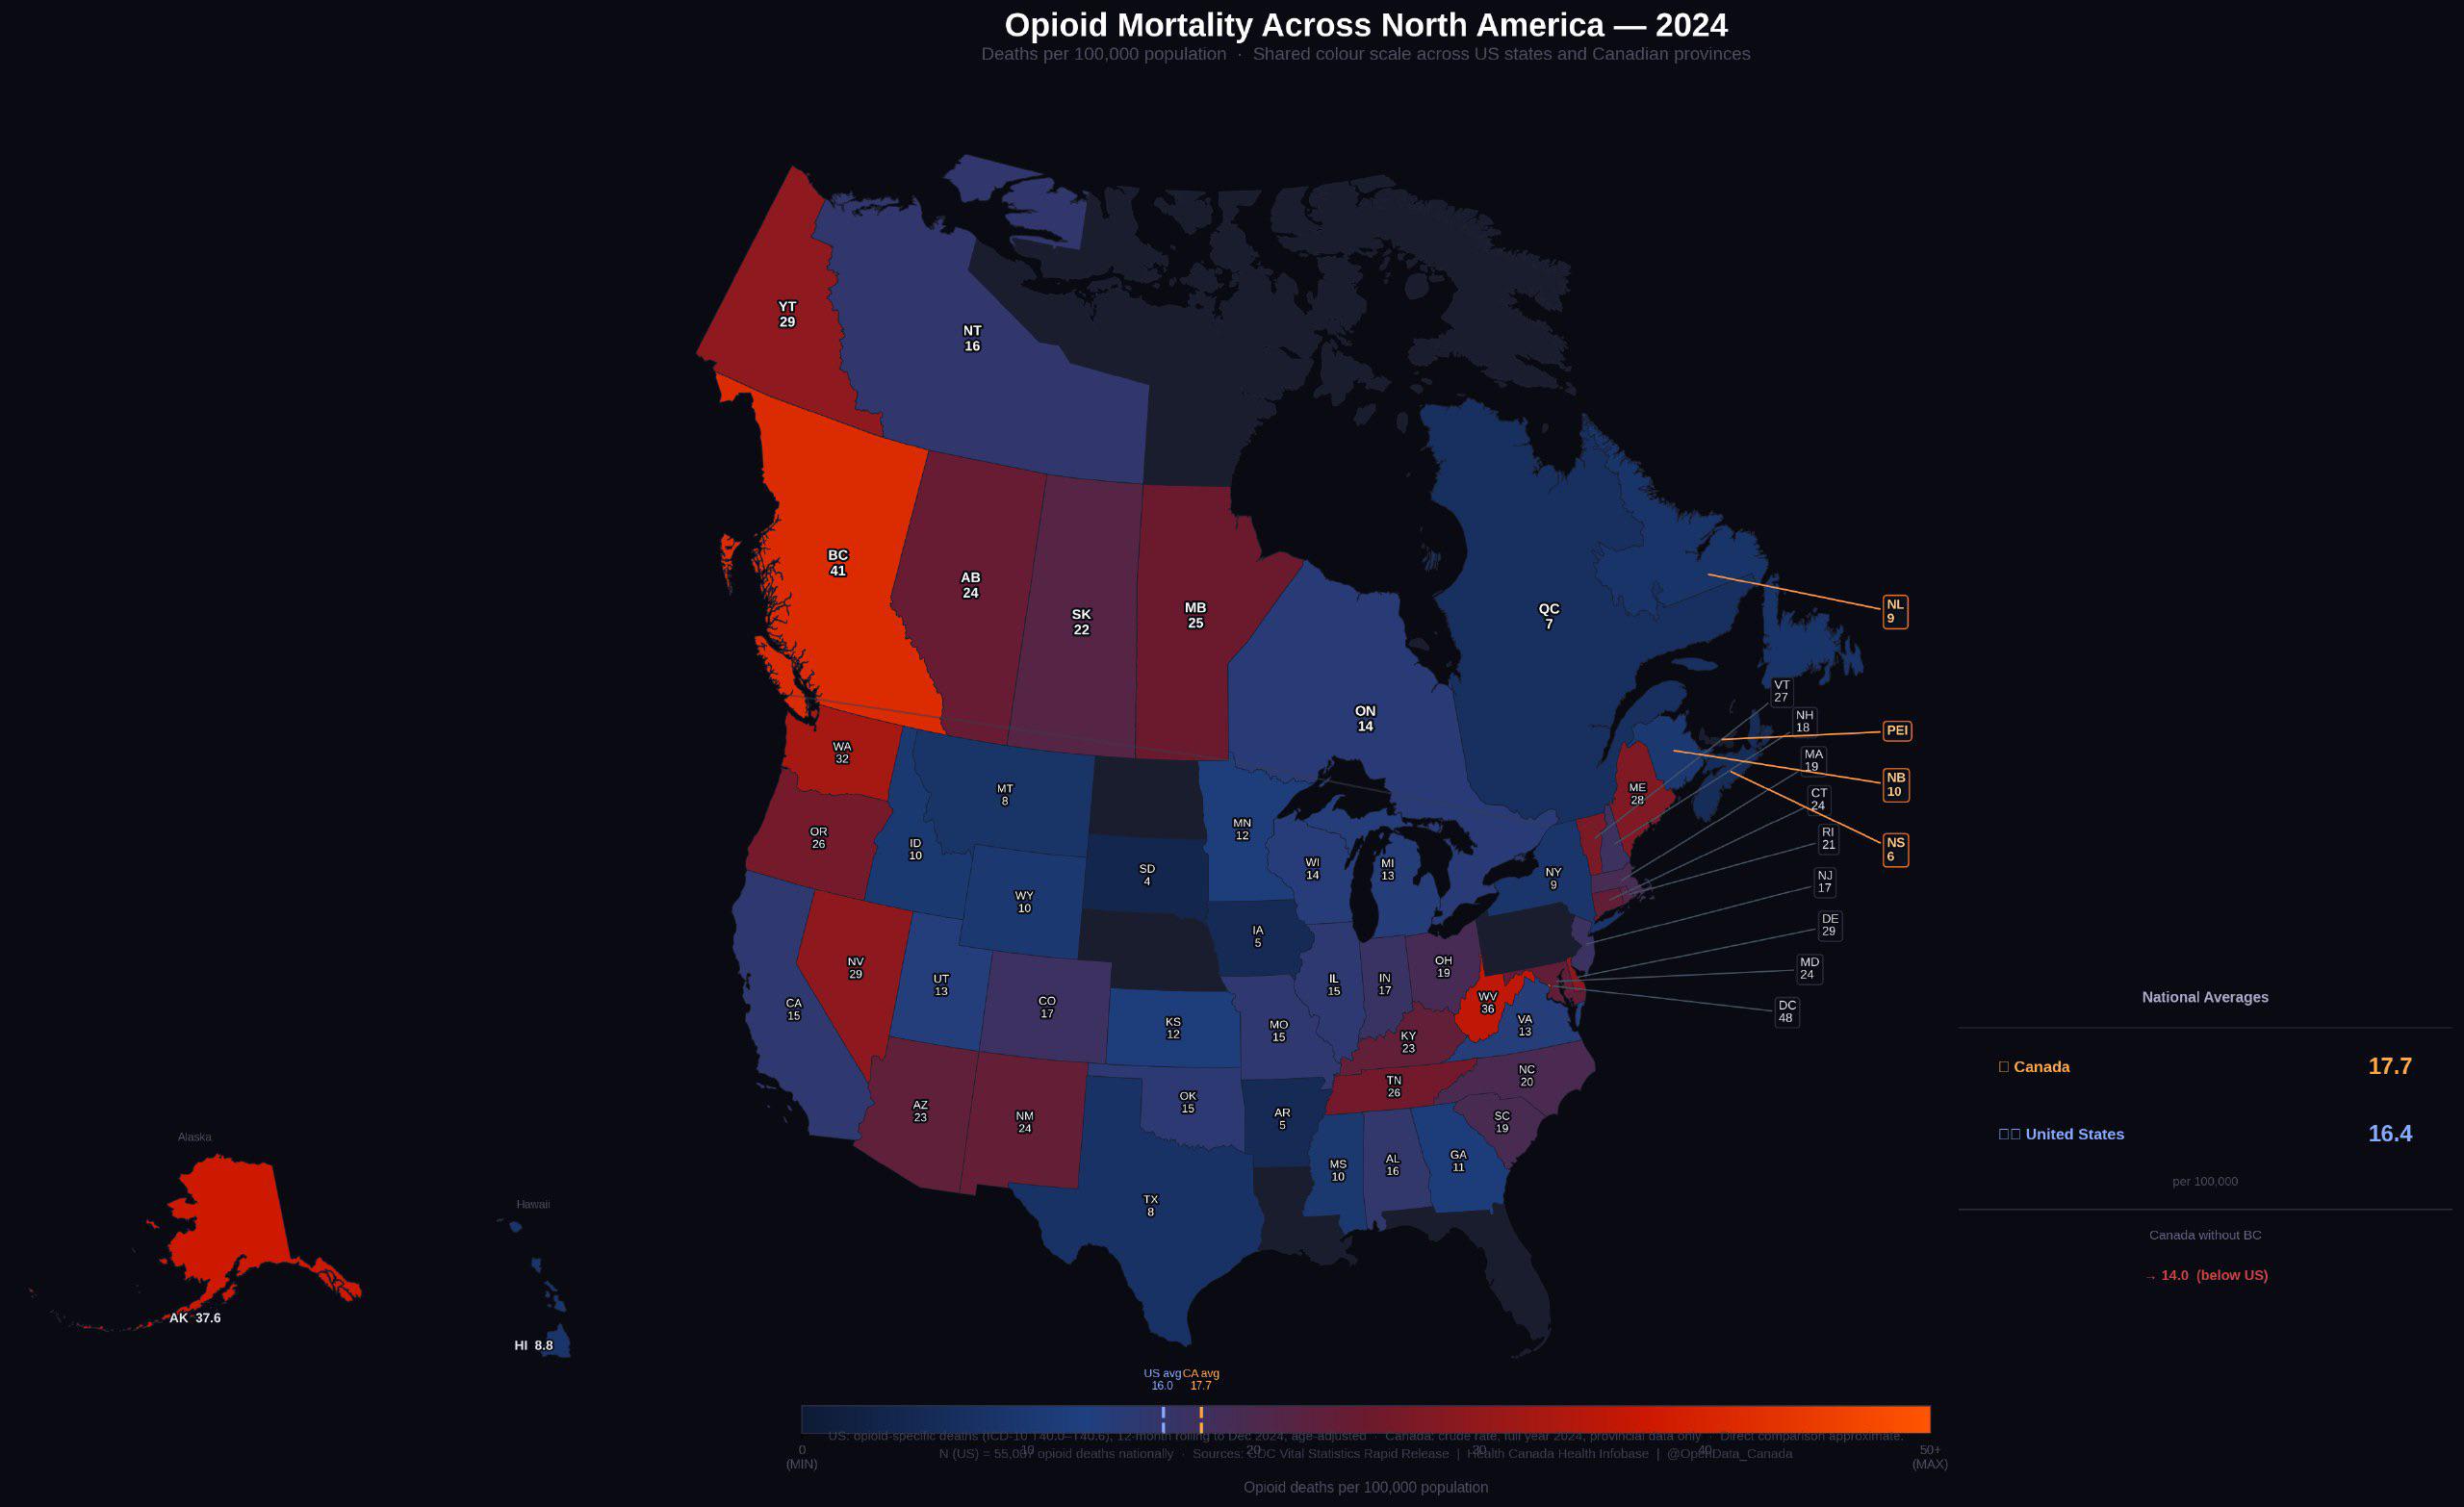
Canada now has a higher opioid death rate than the US
17.7 vs 16.4 deaths per 100,000 in 2024 — but pull British Columbia out of the Canadian total and Canada drops to 14.0.