Public health · Charts
Canada now has a higher opioid death rate than the US
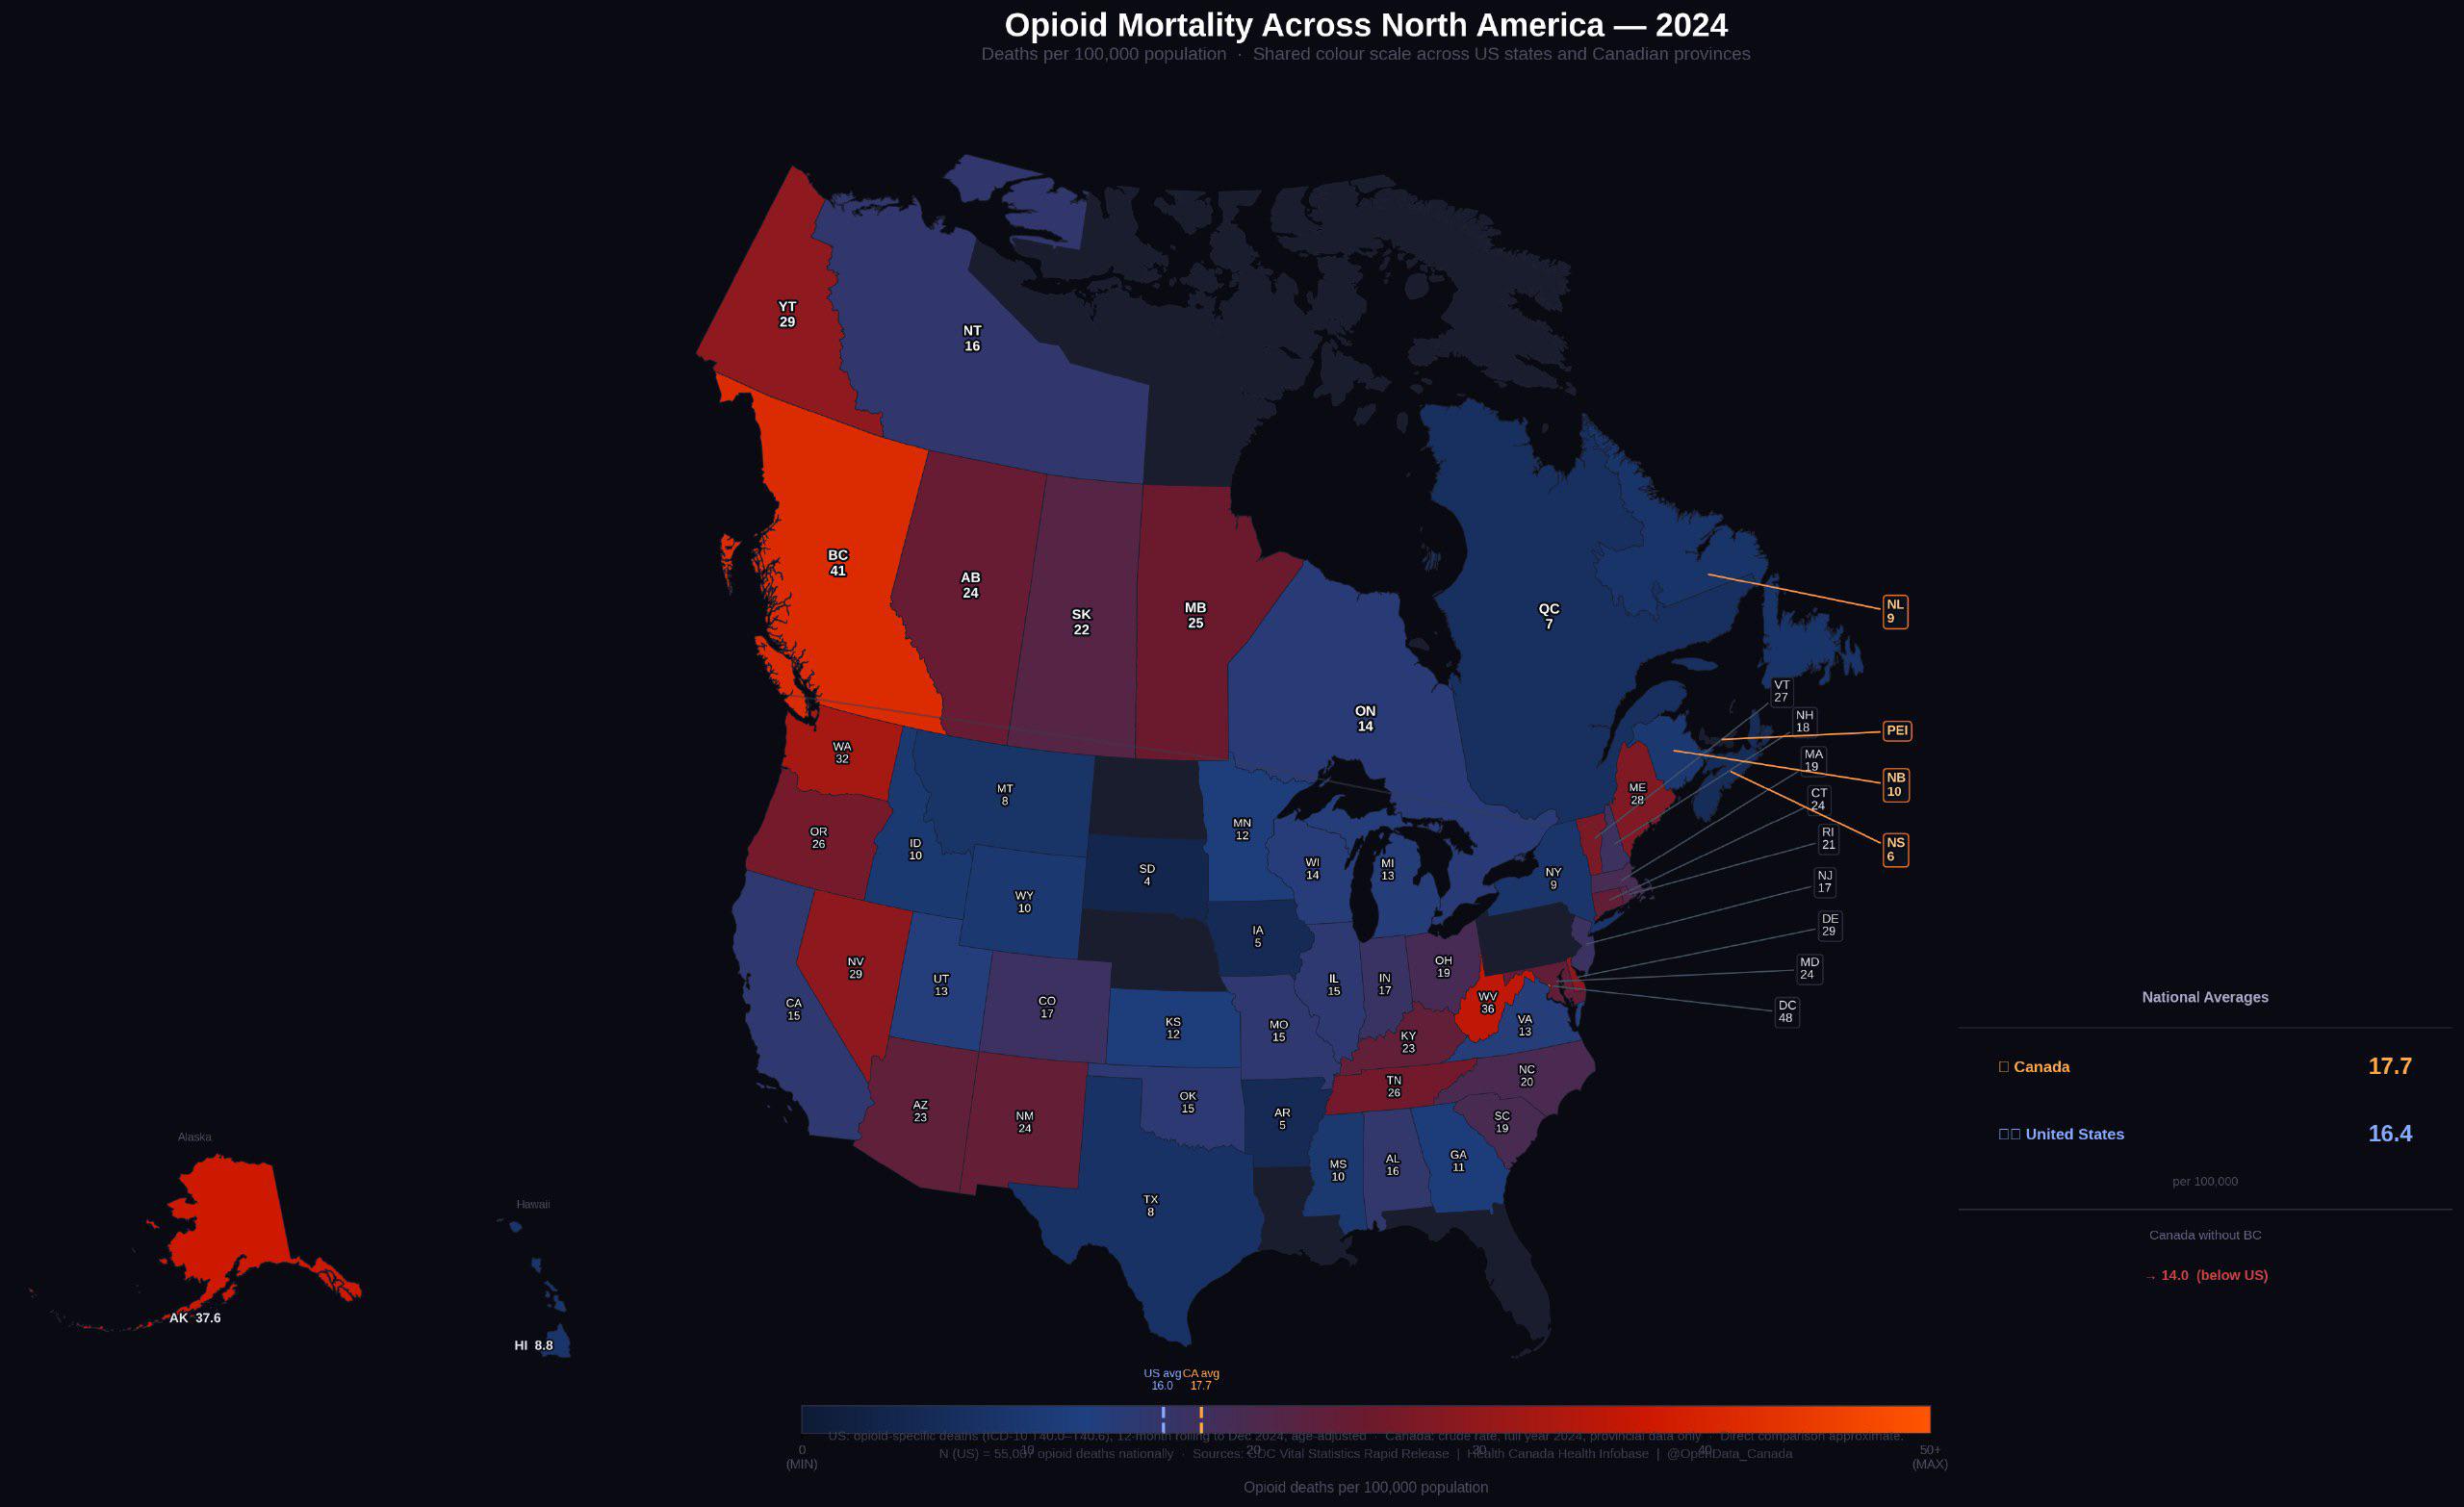
17.7 vs 16.4 deaths per 100,000 in 2024 — but pull British Columbia out of the Canadian total and Canada drops to 14.0, well below the US average. The national headline hides a province-level story.
Originally posted on r/OpenDataCanada. Sources: Health Canada Health Infobase (Canadian provinces), CDC Vital Statistics Rapid Release (US states), 2024 calendar year.
How Canada got here — national rate, 2016 to 2024
The rate was 7.8 per 100,000 in 2016. It more than doubled by 2020 — the year COVID-19 disrupted drug supply chains and isolated users from peers and harm-reduction services — and peaked at 20.0 in 2023. The 2024 figure of 17.7 is the first meaningful annual decline since the curve began. Whether that decline holds in 2025 will not be clear until Health Canada releases full-year data in mid-2026; the partial-year 2025 data published so far suggests the downward trend is continuing but at a slower pace.
The provincial picture is what actually matters
British Columbia's 2024 rate of 41.3 per 100,000 is more than five times the rate in Quebec, more than ten times the rate in Prince Edward Island, and roughly two-and-a-half times the US national average. Three Western provinces (BC, AB, SK) plus Manitoba and the Yukon all sit above the US figure. Every other Canadian jurisdiction sits below it. The "Canada-vs-US" framing in the original chart is technically accurate but the per-province numbers tell you the comparison is being driven almost entirely by one province.
Read the explainer
The full article expands on what's actually driving these numbers — the BC fentanyl supply story, the methodology differences between CDC and Health Canada definitions, why Quebec's rate is consistently a fraction of BC's, and what the 2024 decline does and doesn't tell us.
Sources and methodology
- Canadian rates: Public Health Agency of Canada, Apparent opioid and stimulant toxicity deaths, 2024 calendar year. Death counts are based on accidental and intentional poisoning deaths where one or more opioids were judged the cause; manner of death is determined by provincial coroners and medical examiners.
- US rates: CDC National Center for Health Statistics, Vital Statistics Rapid Release — Provisional Drug Overdose Deaths, 2024 12-month rolling estimates. State-level rates use the standard ICD-10 drug-overdose definition restricted to opioid-involved deaths (T40.0–T40.4, T40.6).
- Population denominators: Statistics Canada quarterly provincial estimates (Table 17-10-0009-01); US Census Bureau Vintage 2024 estimates.
- The CDC and Health Canada use slightly different operational definitions ("apparent opioid toxicity" vs "drug overdose deaths involving opioids"). The article linked above discusses how this affects the comparison.
Where to get the data
- Canadian rates and absolute deaths, by year and by province: Health Canada Health Infobase — Apparent Opioid and Stimulant Toxicity Deaths
- US rates: CDC NCHS Vital Statistics Rapid Release — Provisional Drug Overdose Death Counts
- Population denominators: Statistics Canada Table 17-10-0009-01
Read next