Housing · International comparison · 6 min read
Canada's House Prices Doubled After Inflation, the Most of 19 Peer Countries
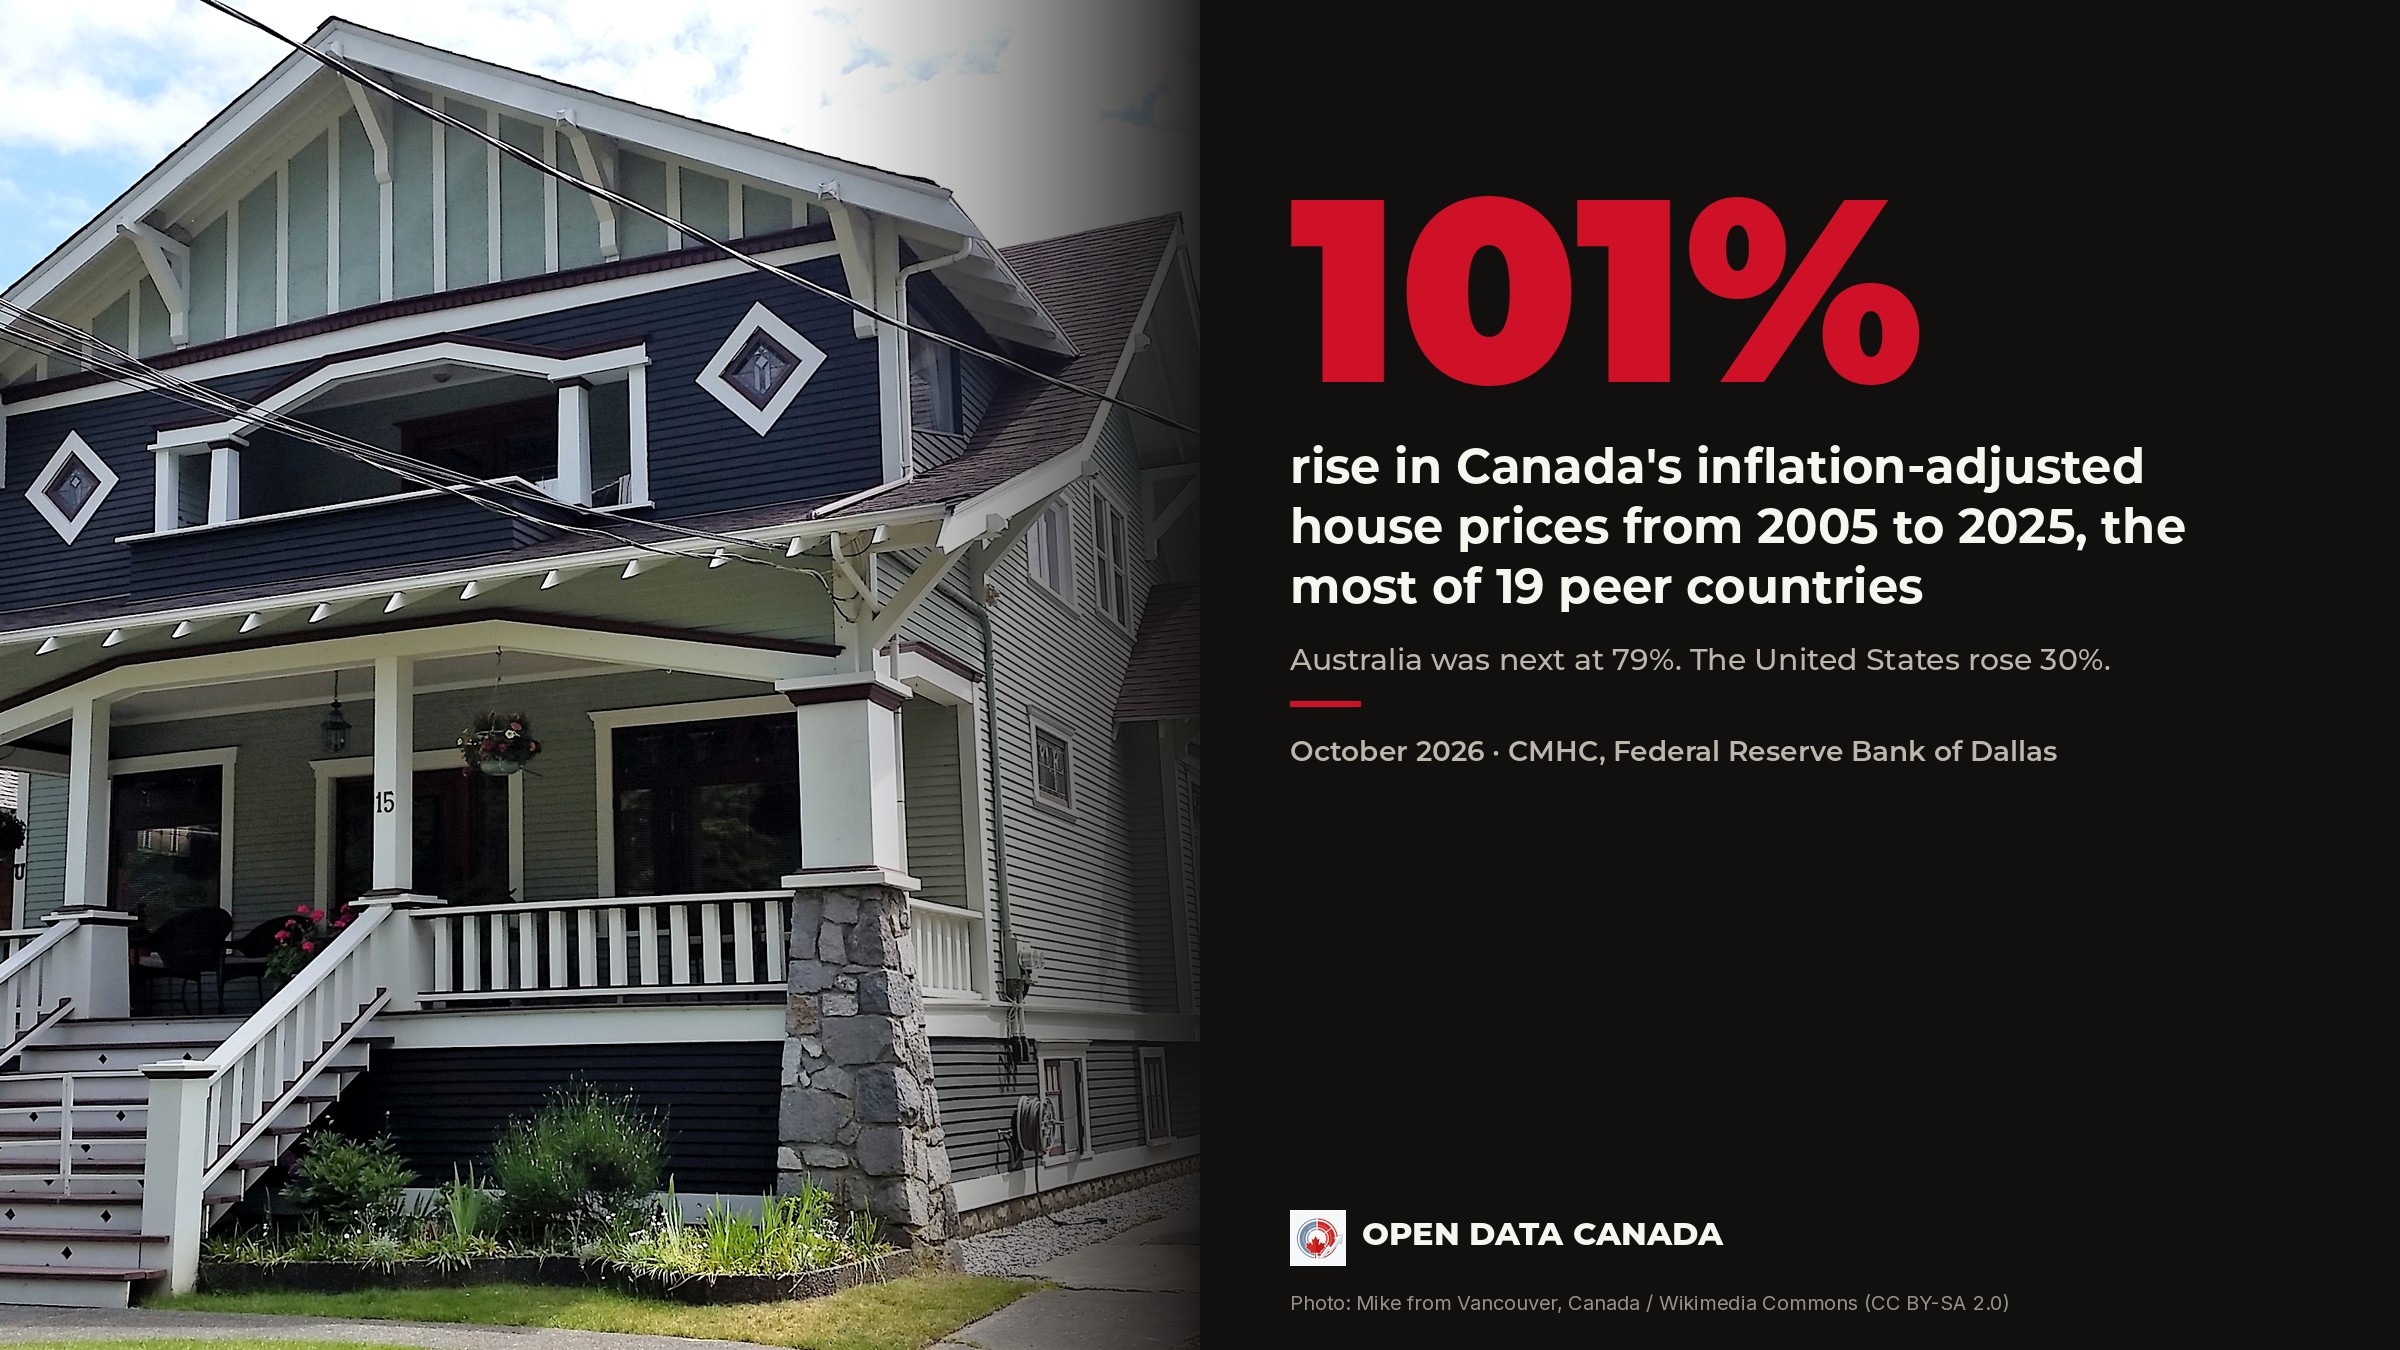
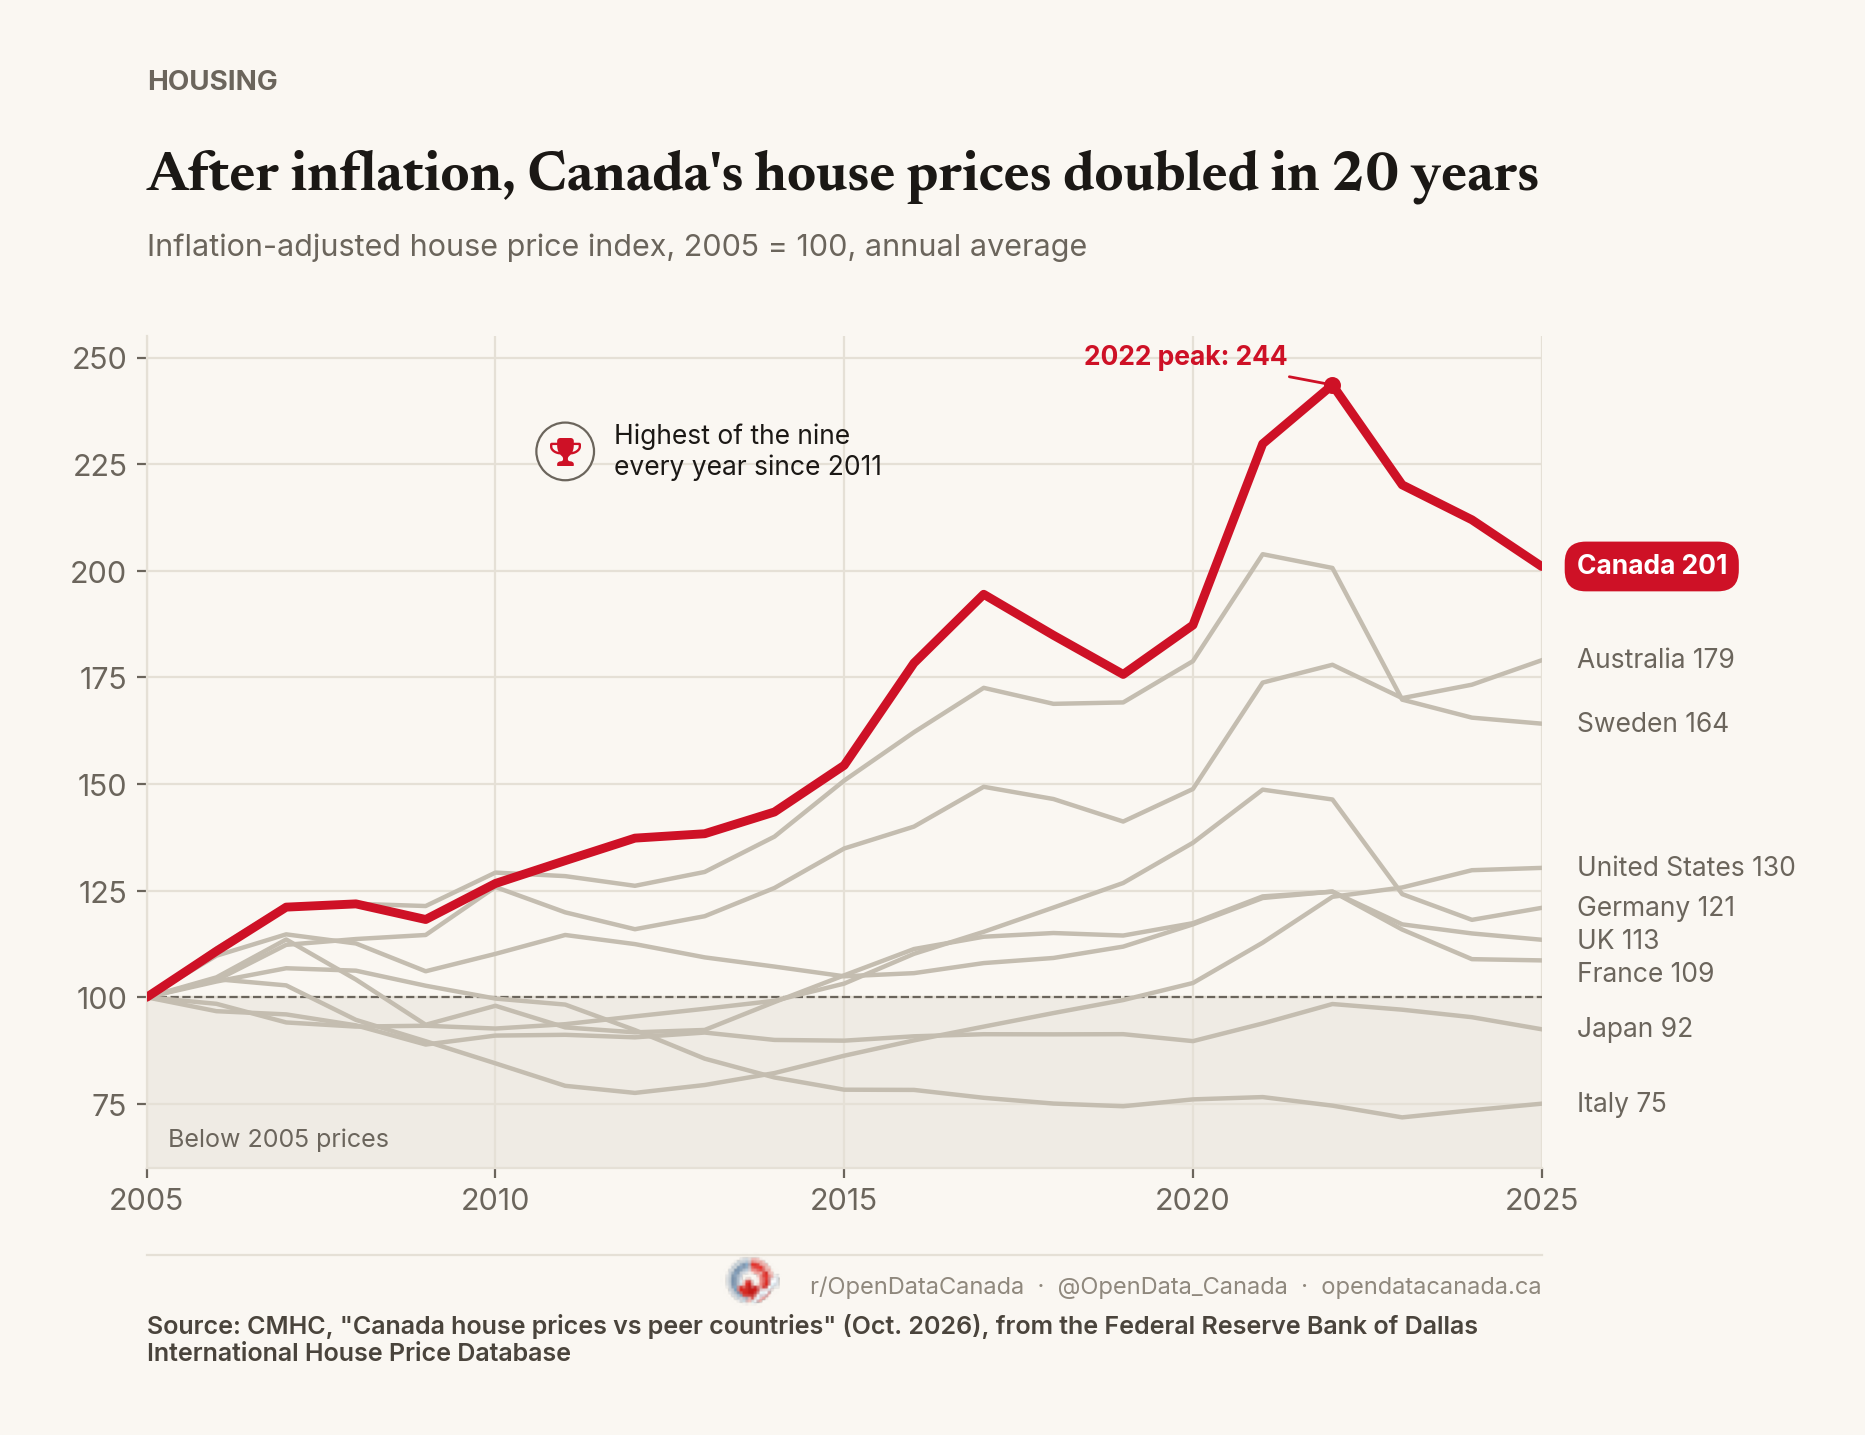
Inflation-adjusted house prices in Canada rose 101% from 2005 to 2025, the most of 19 peer countries in a new CMHC comparison. Australia was next at 79%. Prices have fallen since early 2022, by 19% in dollars and 29% after inflation.
Canada Mortgage and Housing Corporation (CMHC), the federal housing agency, published a comparison of Canadian house prices with peer countries on October 20. Its headline: since 2005, real house prices in Canada "have more than doubled, outpacing most developed countries."
After adjusting for inflation, Canada's house price index stood at 201 in 2025, where 2005 equals 100. Australia, the next highest of the nine countries in CMHC's main chart, was at 179. Sweden was at 164, the United States at 130 and the United Kingdom at 113. Italy and Japan are below where they started. Canada has had the highest index of the nine every year since 2011.
How much prices have really fallen since 2022
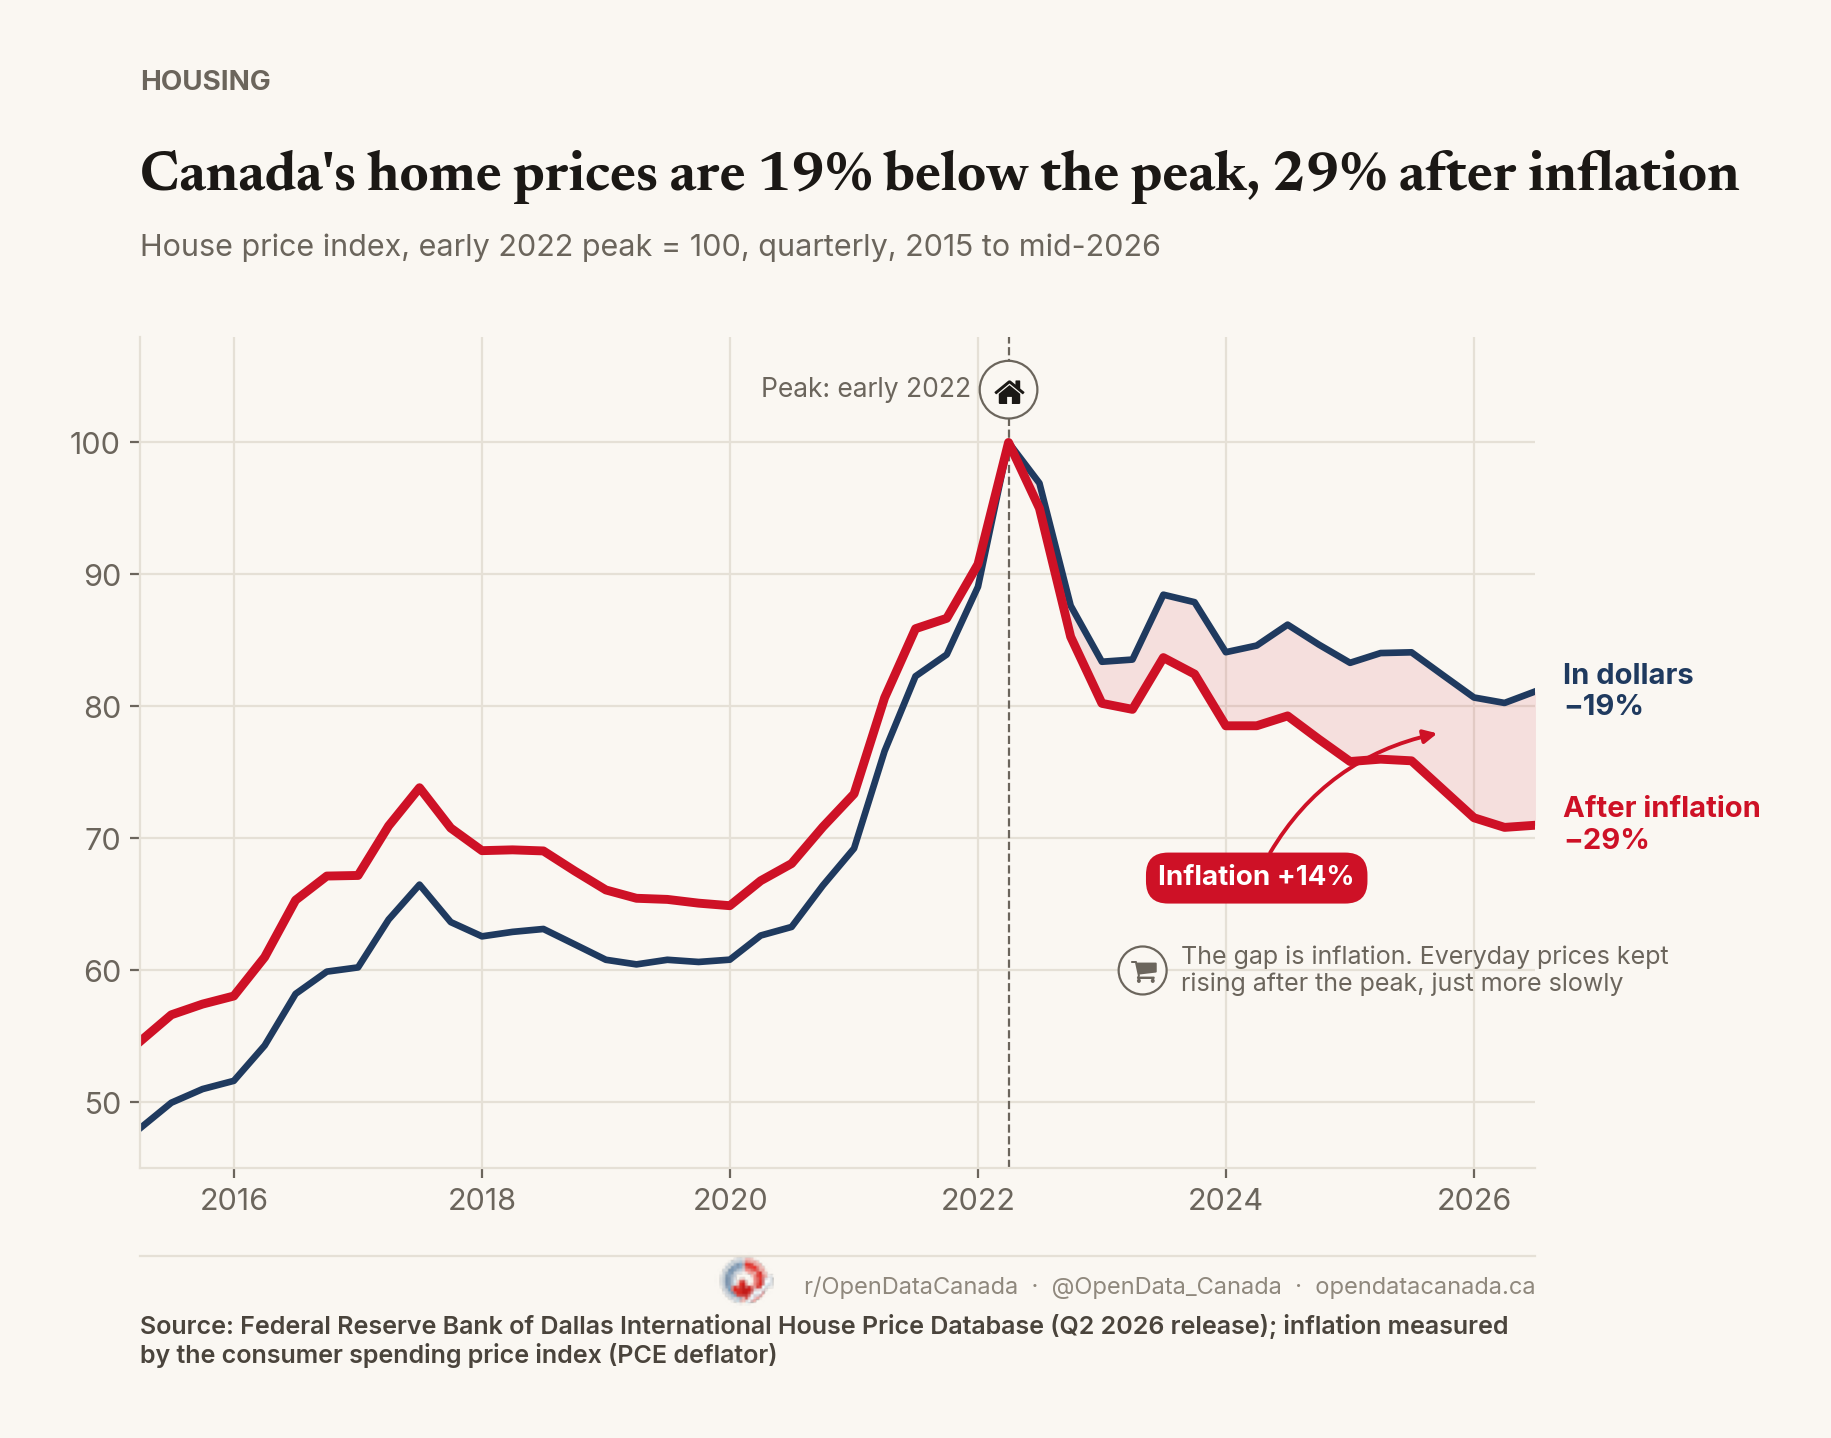
Canadian prices peaked in early 2022. By mid-2026, the latest quarter in the Federal Reserve Bank of Dallas's international database (the source CMHC uses), they were 19% below that peak in dollars and 29% below after inflation. The gap between those two numbers is inflation.
The Dallas Fed adjusts for inflation with a broad measure of consumer prices (the personal consumption expenditure deflator). That measure rose 14.3% between early 2022 and mid-2026.
Inflation did slow over that period. Measured this way, it ran at 6.5% a year in mid-2022 and has been between about 2% and 3% since 2024. Slower inflation still means prices are rising, only less quickly. The rate never went below zero, so the general price level never came back down.
A house now costs 81% of its peak price, paid in dollars worth 87.5% of what they were. That leaves its real value at 71% of the peak. Roughly three-fifths of the real decline is lower price tags and two-fifths is inflation.
The dollar figure is what counts for a buyer paying from savings. The inflation-adjusted figure is what counts for an owner asking whether their home kept up with everything else they buy.
Population growth explains part of the rise
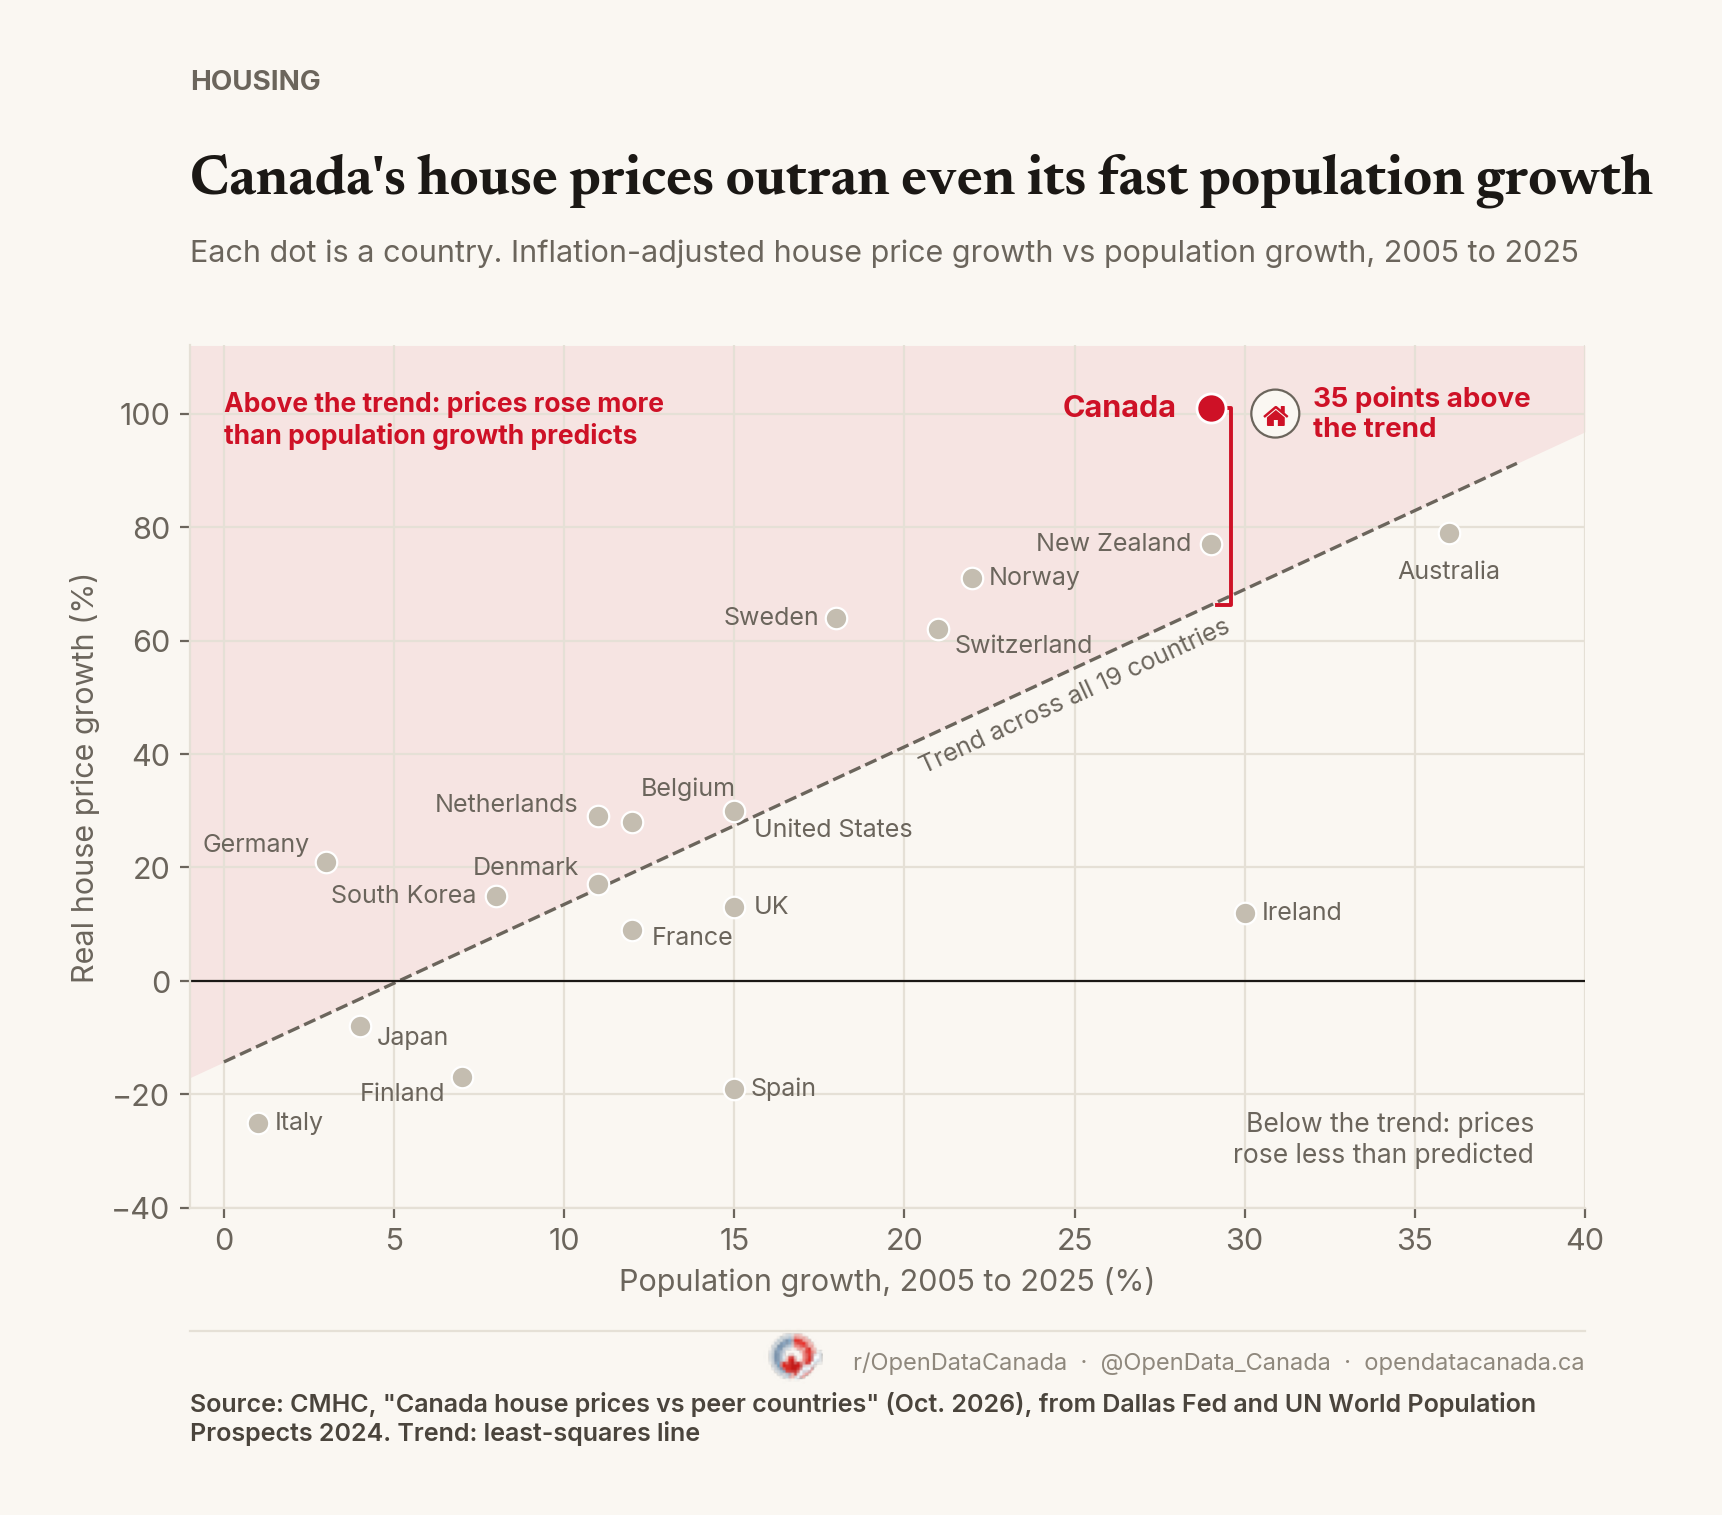
CMHC compared inflation-adjusted price growth with population growth across 19 countries from 2005 to 2025. Countries whose populations grew faster usually saw prices grow faster. A straight line fitted through the 19 countries rises about 2.8 points of real price growth for every point of population growth.
Canada sits well above that line. Its population grew 29%, the same as New Zealand's. New Zealand's real house prices rose 77%. Canada's rose 101%. For a country with Canada's population growth, the line predicts about 66%. Canada is 35 points higher.
Australia's population grew faster than Canada's, by 36%, and its prices rose less. Ireland's population grew 30% and its real prices rose only 12%.
CMHC's own reading: "Rapid population growth is only part of the story: demand was also supported by higher incomes and lower interest rates."
Nearly five new residents for every new home
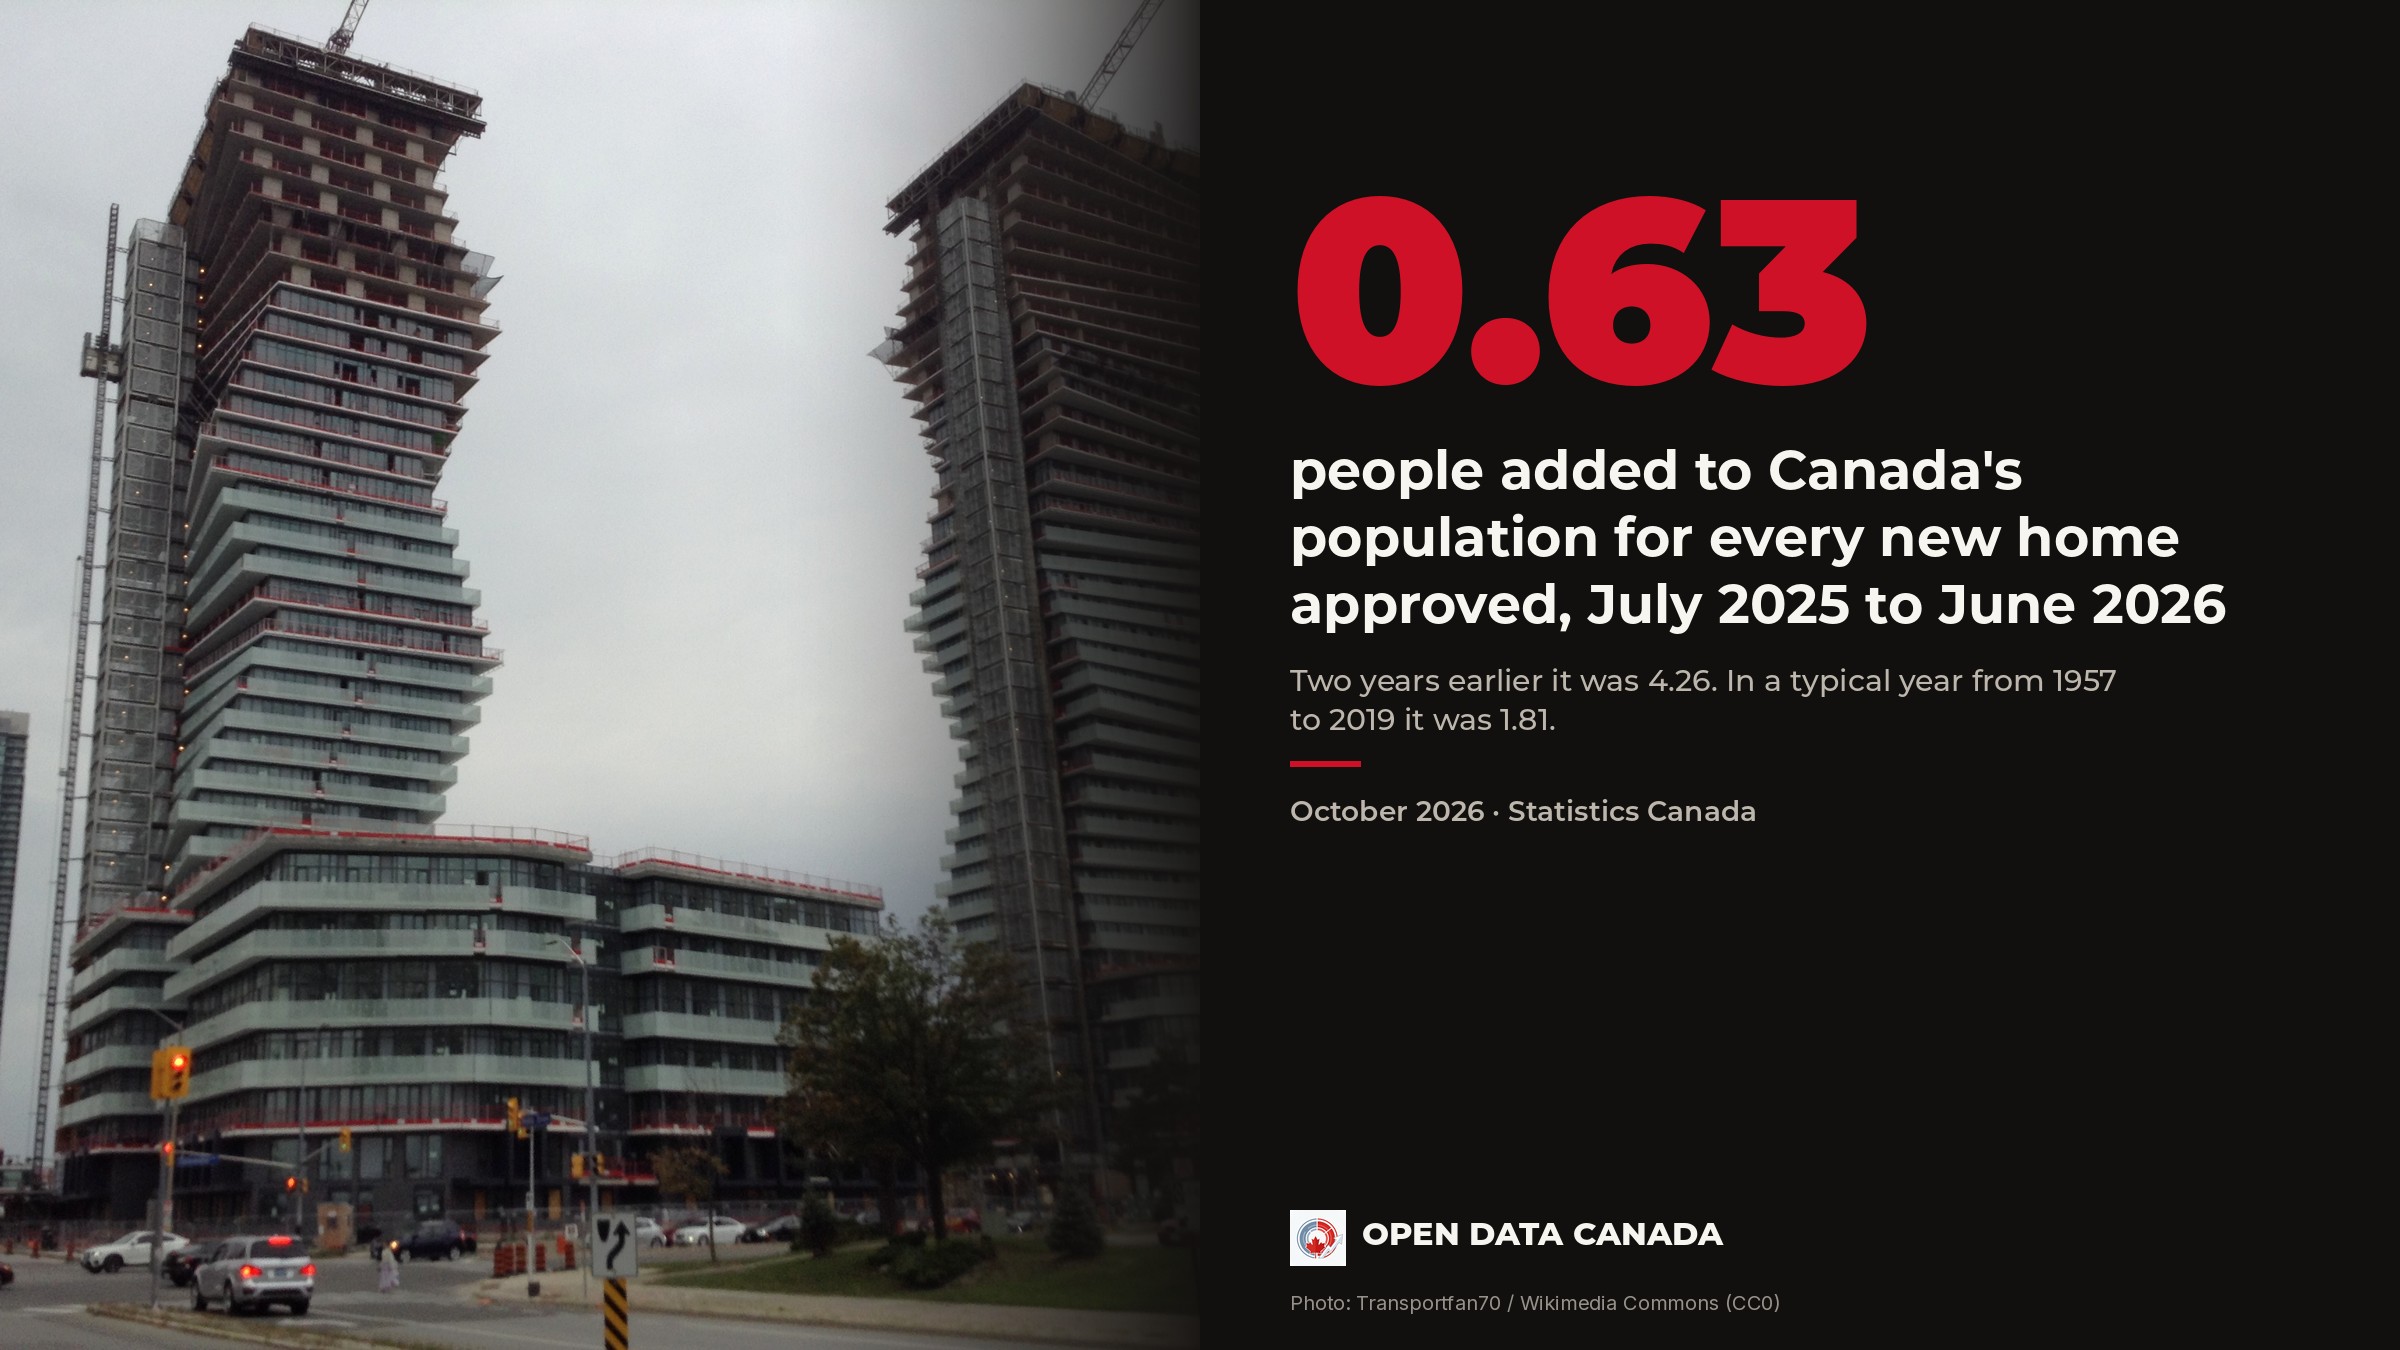
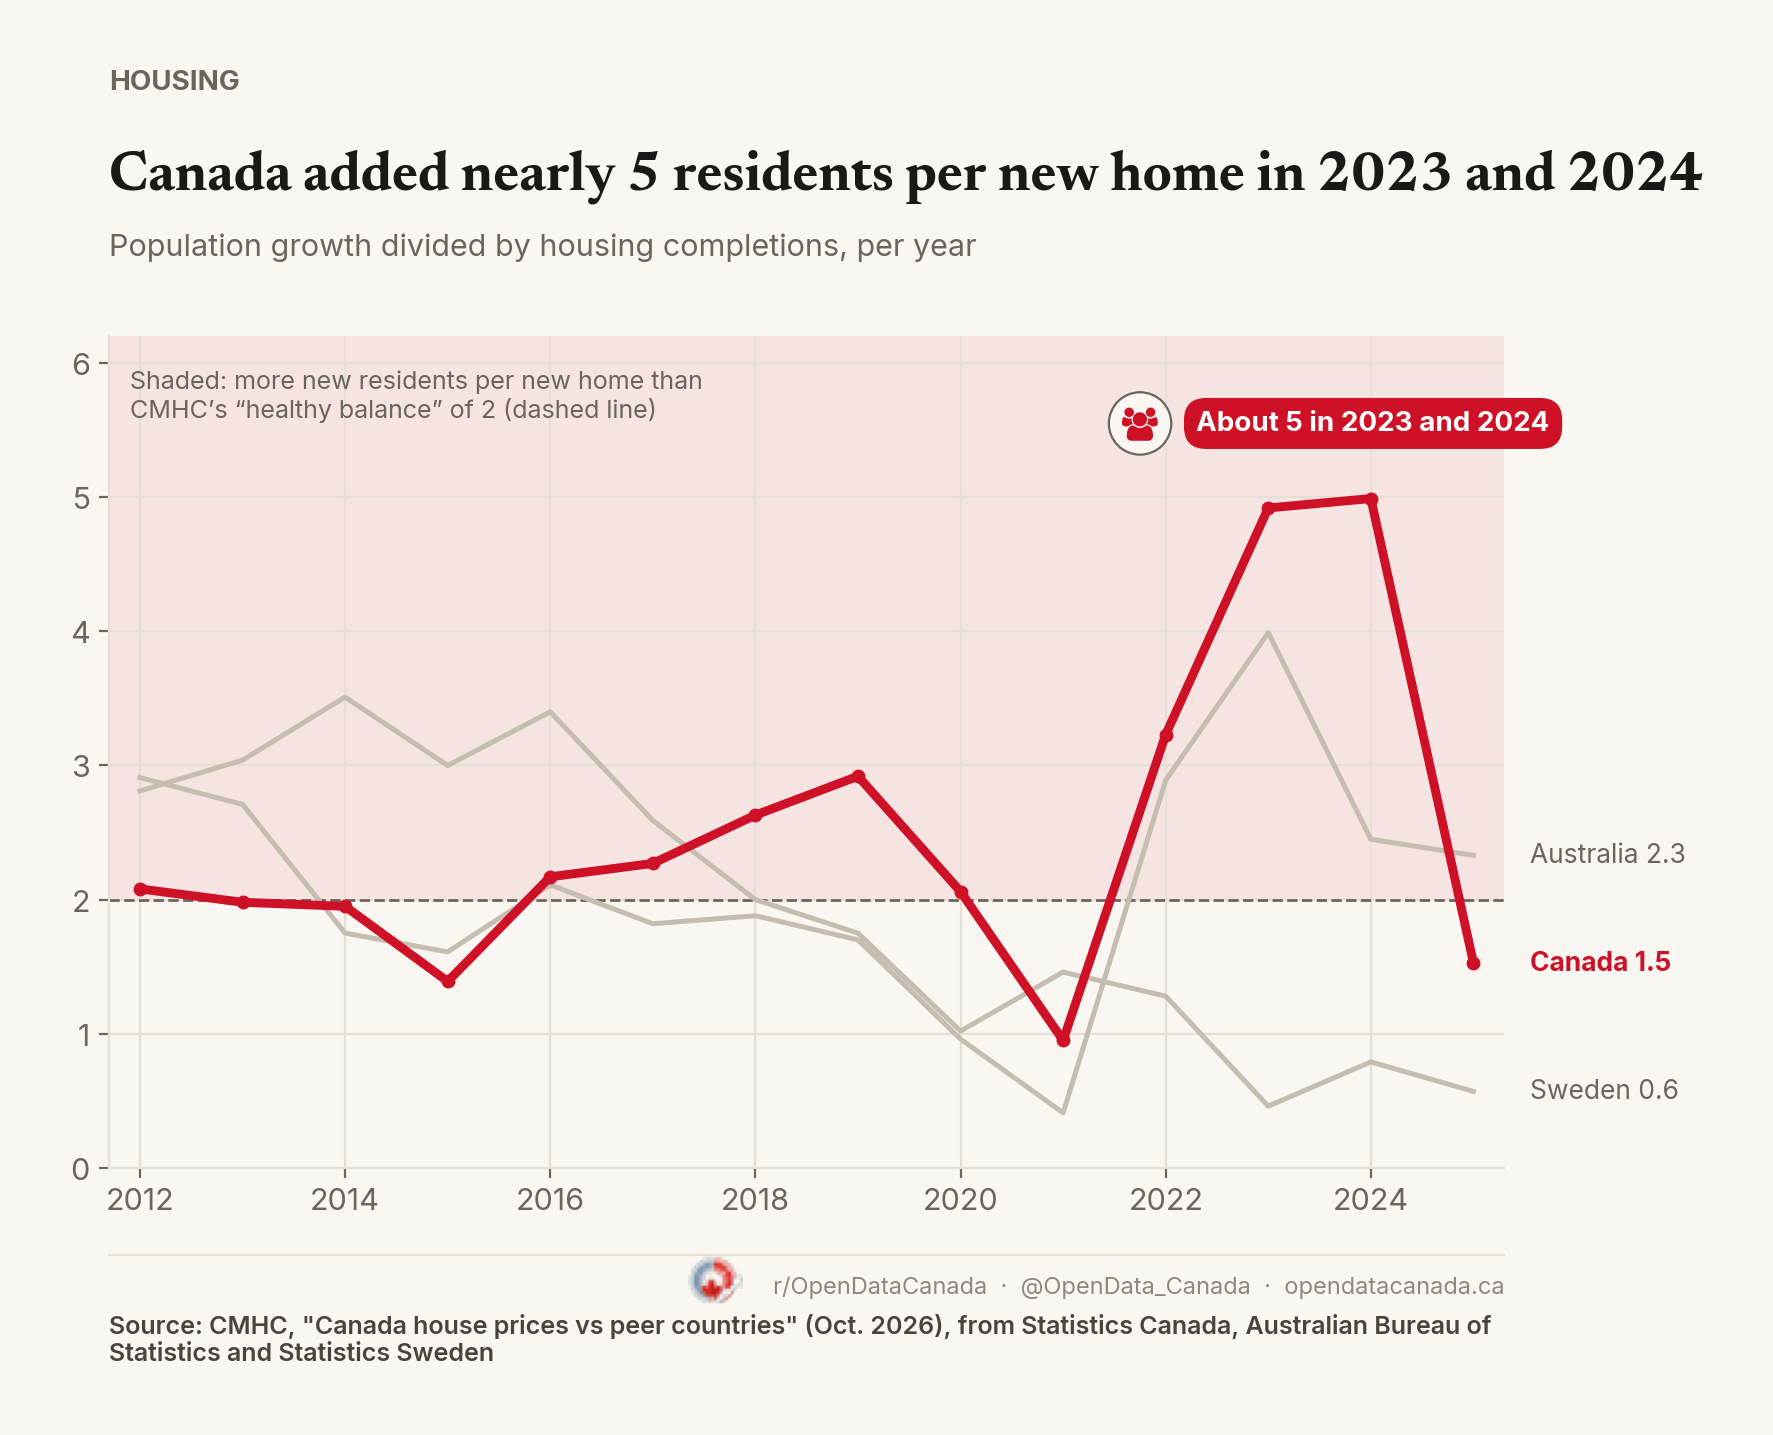
CMHC divided Canada's yearly population growth by the number of homes completed that year. In 2023 the country added 4.92 people for every new home. In 2024 it added 4.99. CMHC marks 2.0 as a "healthy balance ratio," though the report doesn't explain how that figure was set.
In 2025 the ratio fell to 1.53, which CMHC says "likely reflects later changes in immigration levels." Australia was at 2.33 that year and Sweden at 0.57. Population growth has kept slowing since. Statistics Canada puts growth in the year to July 1, 2026 at 0.46%; its September revision reshaped the recent numbers.
Construction didn't collapse. Newly completed homes were 1.2% of Canada's housing stock in 2011 and 1.3% in 2022, above the average for the Organisation for Economic Co-operation and Development (OECD). Australia's rate was 1.7% in 2011 and 1.6% in 2022. Supply grew steadily while demand jumped. CMHC notes that in 11 of 17 comparison countries, new construction grew as a share of the housing stock by more than it did in Canada.
Fewer homes per person than most peers
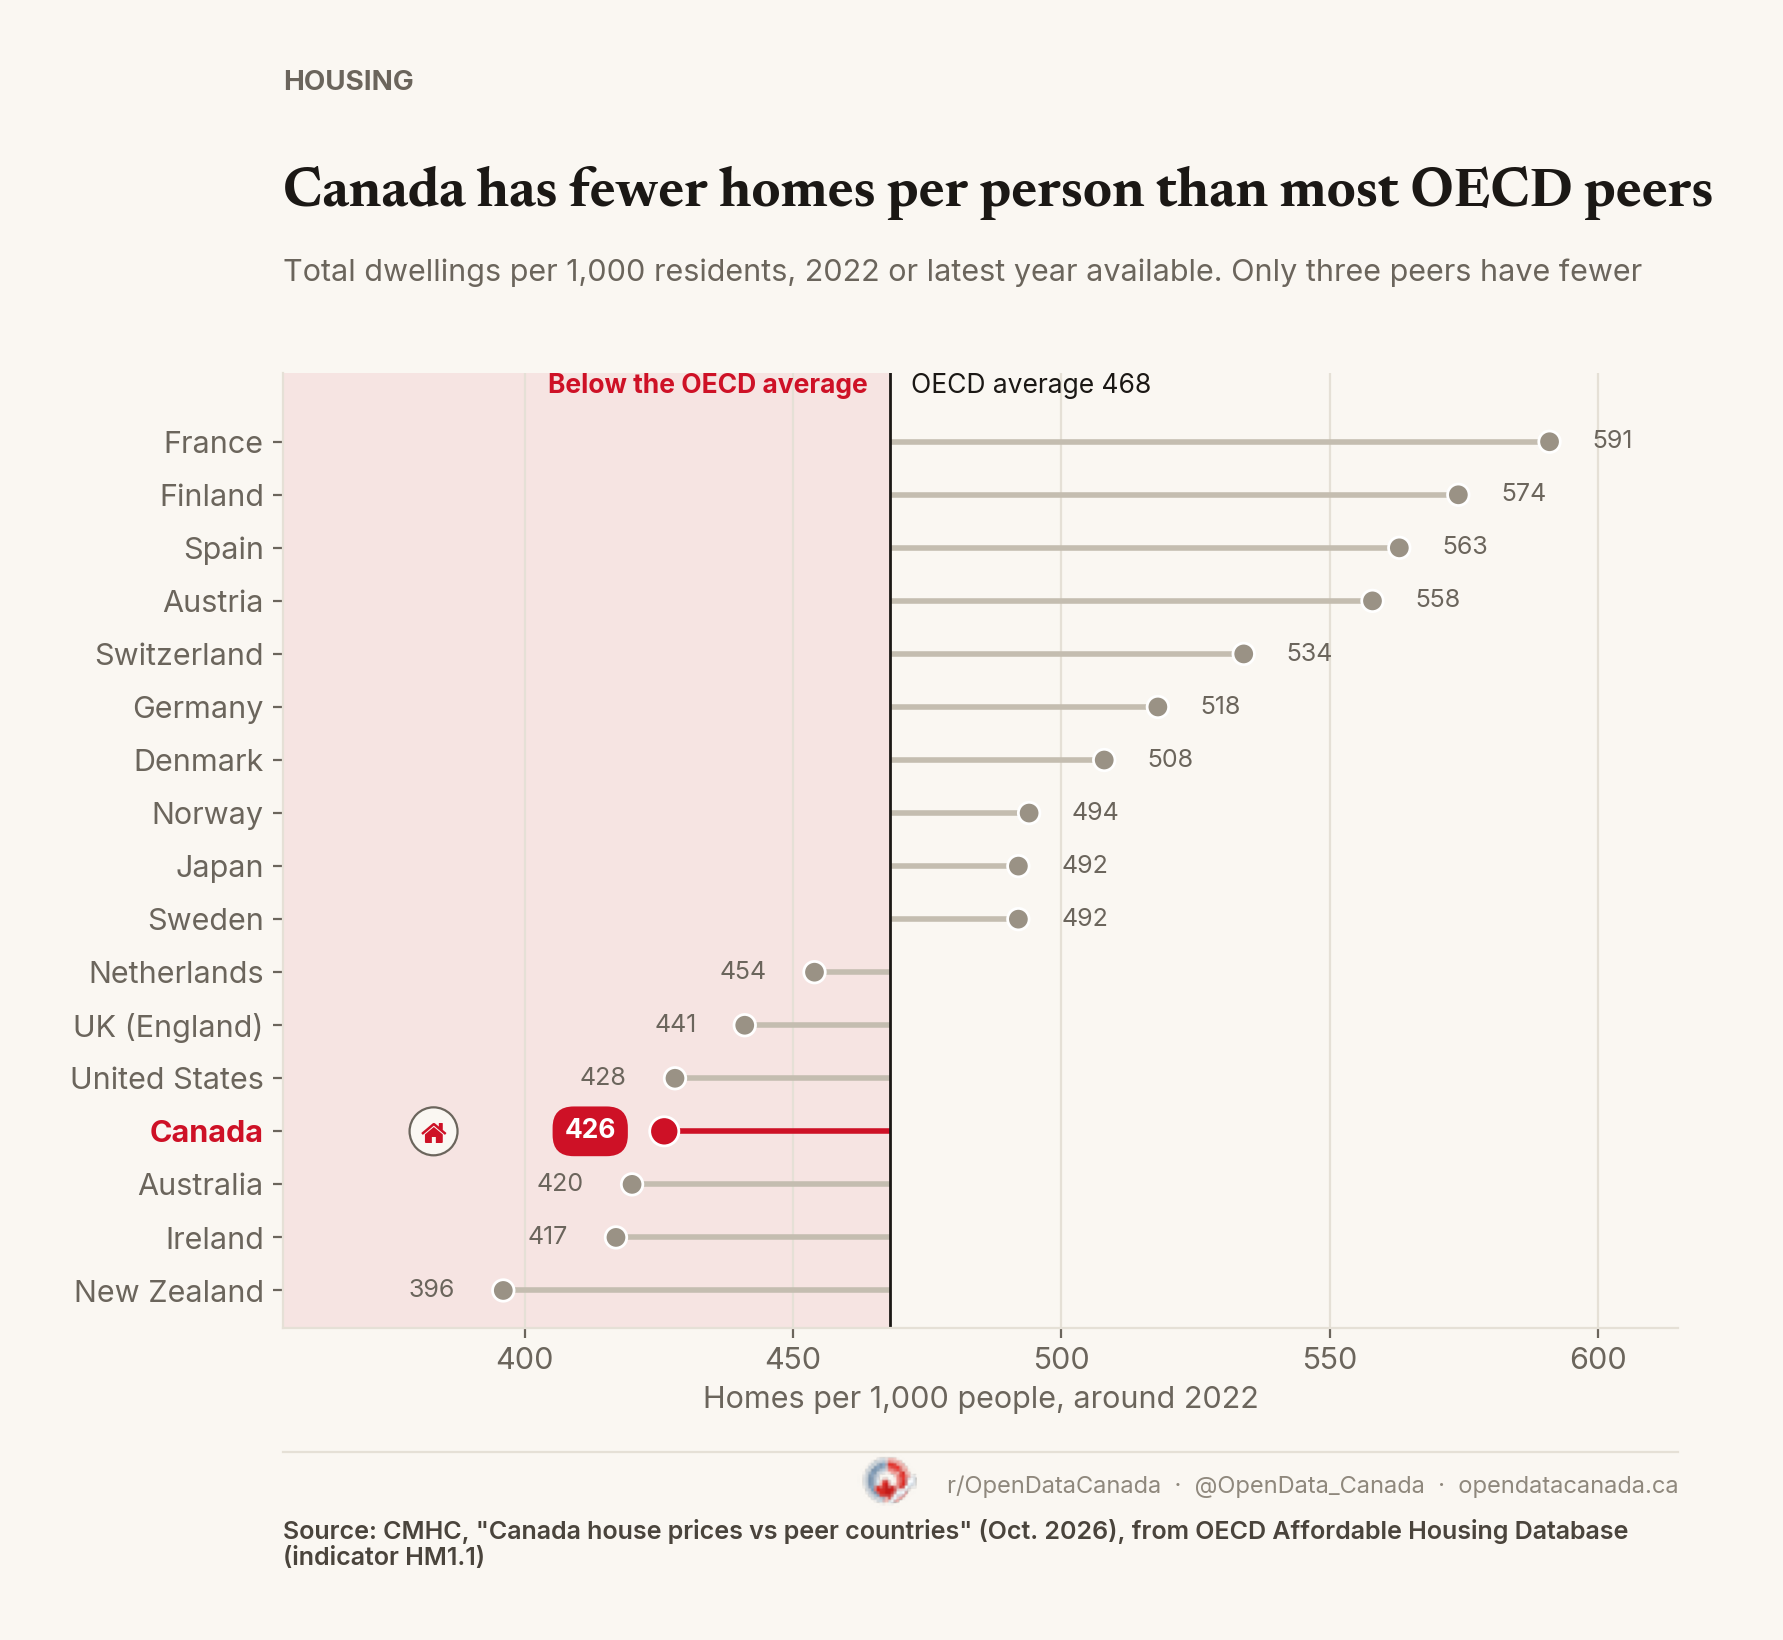
Canada had 426 homes for every 1,000 residents around 2022, against an OECD average of 468. Among the peers CMHC lists, only Australia (420), Ireland (417) and New Zealand (396) had fewer. France had 591.
Canada, Australia, Ireland and New Zealand, the four countries with the fewest homes per person, also had the four fastest-growing populations in CMHC's comparison. CMHC says the larger housing stock in Sweden and Norway, with 492 and 494 homes per 1,000 people, "could have helped moderate house price increases" despite strong population growth.
These comparisons come from harmonized international datasets. CMHC cautions that they show broad trends and are not meant for precise country-by-country conclusions, because countries define and collect housing data differently. None of these figures accounts for incomes, so they don't show whether homes became more or less affordable. The trend line in the population chart is a simple fit across 19 countries with wide scatter.
CMHC says a forthcoming review of 10 peer countries that built housing at scale will look at financial incentives, planning reform, construction innovation and the use of public land. For context on how prices shape living arrangements, see why millennials are twice as likely as boomers were to live with their parents.
Three years of falling prices have not changed the ranking. After inflation, Canada's house prices in 2025 were still further above their 2005 level than in any of the 18 other countries CMHC compared, and the population pressure behind them only eased last year.