Housing · 4 min read
Calgary approved 2.8 times as many homes per resident as Toronto
Toronto approved more homes than any other Canadian metro. Per resident, it sits near the bottom of 42. Nine of the ten metros with the fewest approvals per person are in Ontario.
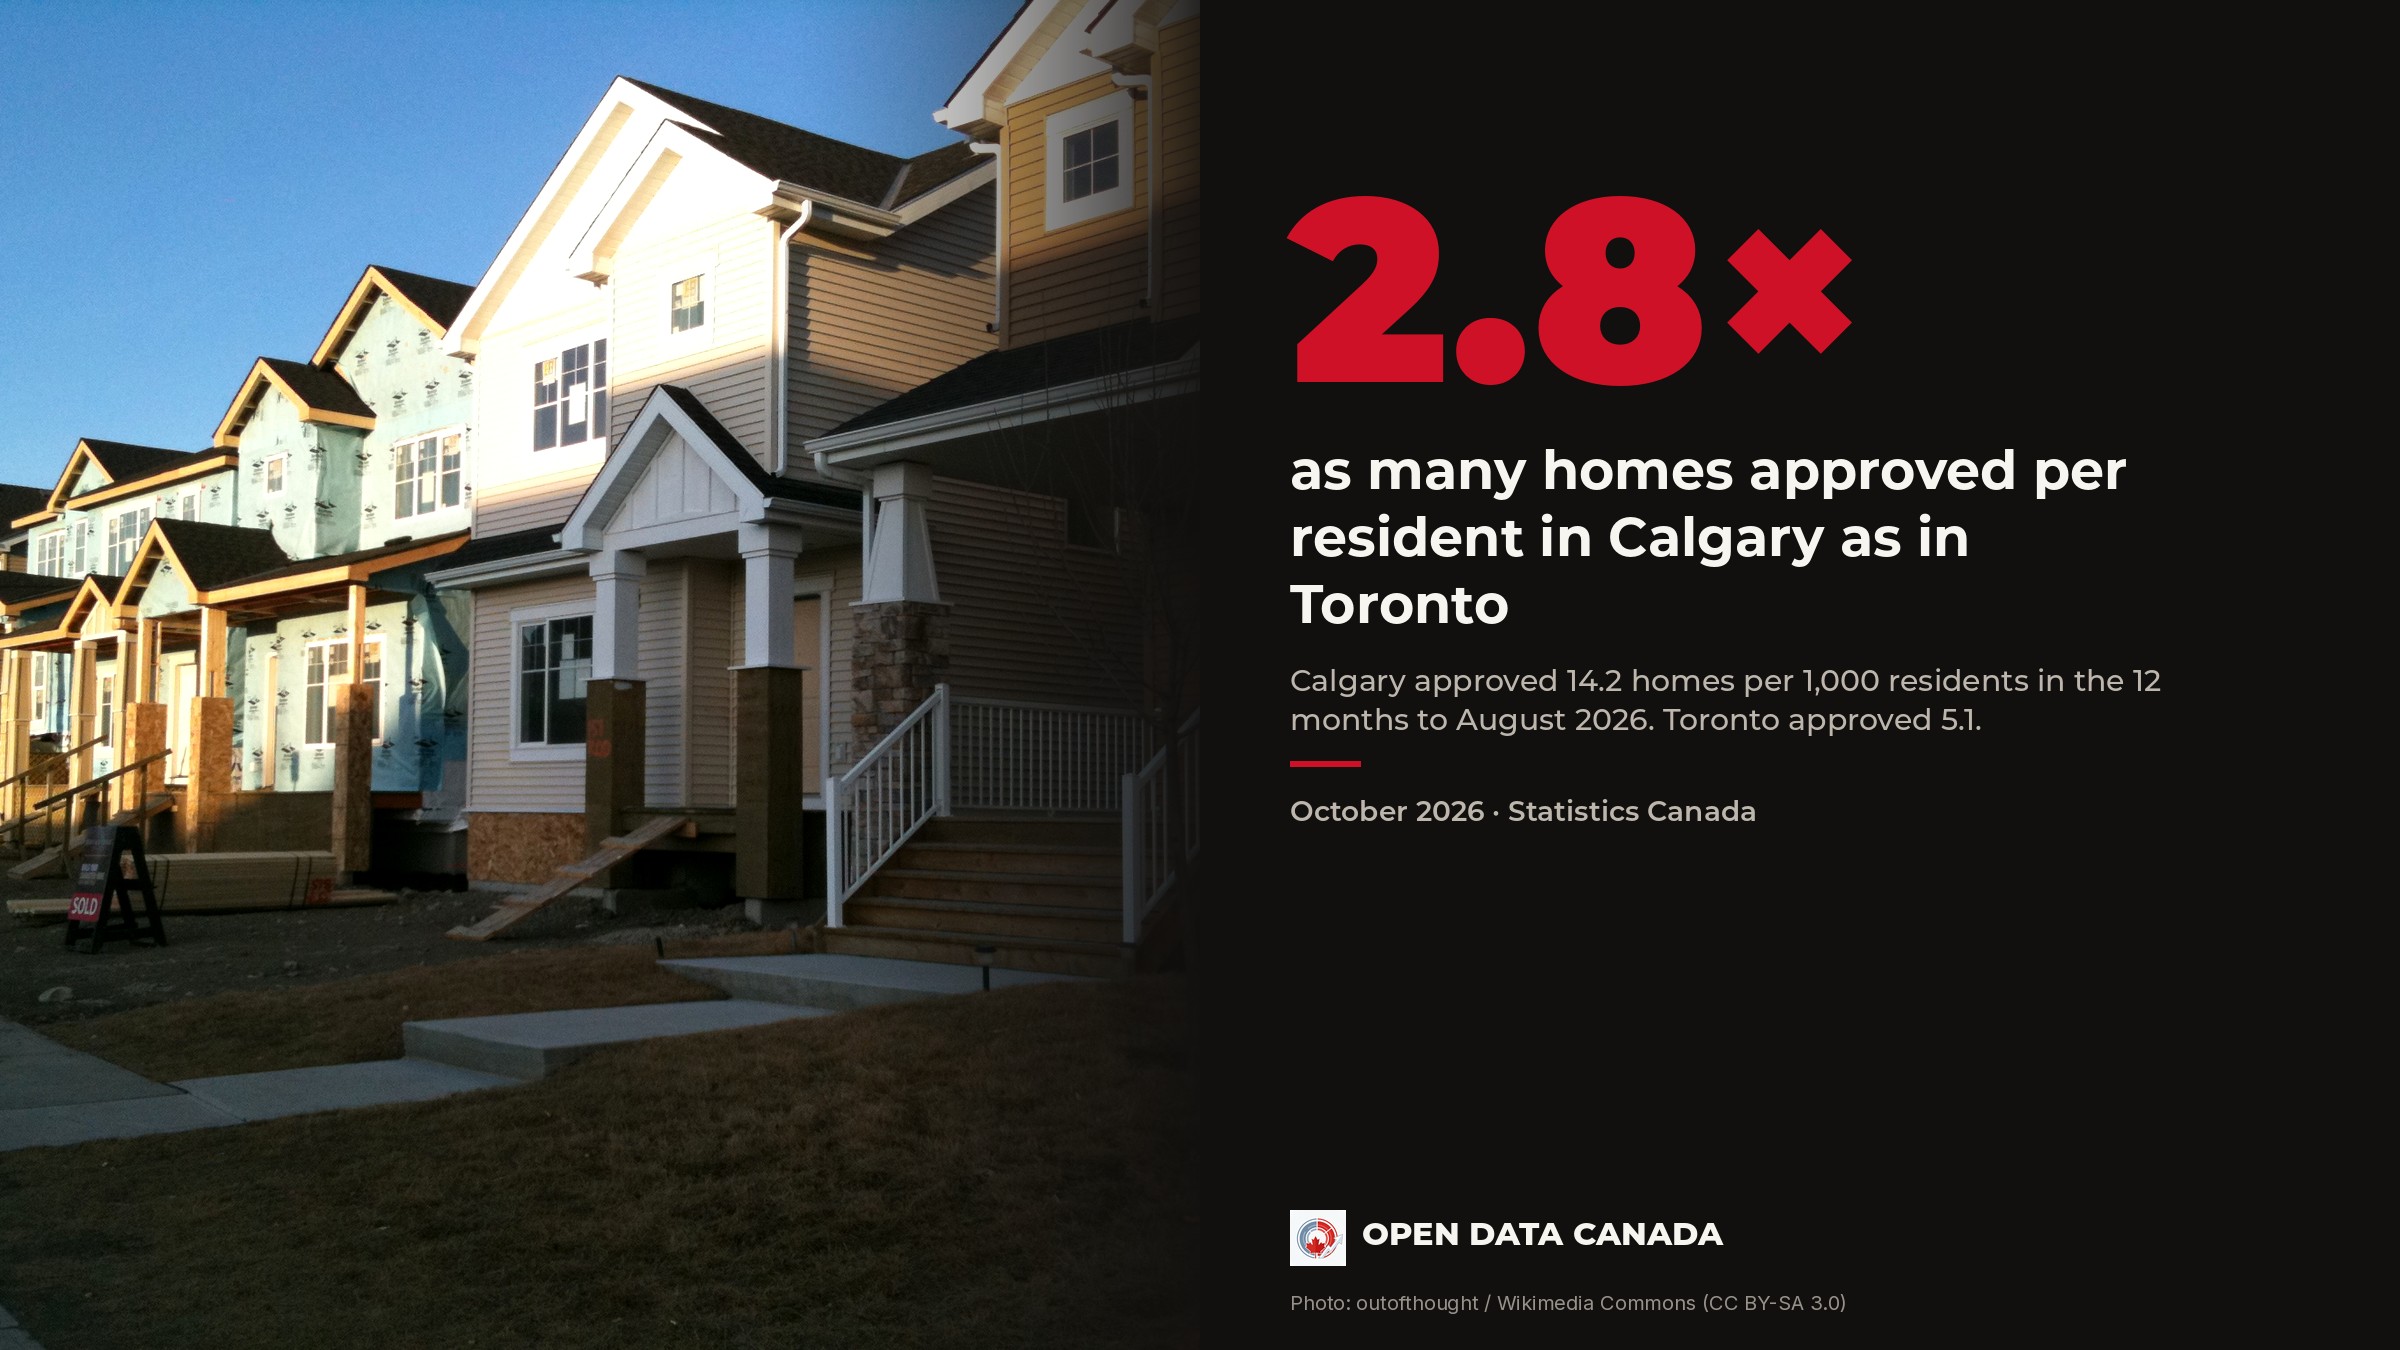
In the 12 months to August, builders in the Calgary area got building permits for 14.2 new homes for every 1,000 people who live there. In the Toronto area the figure was 5.1. In Hamilton it was 3.5. The rate for Canada as a whole was 7.2.
Statistics Canada's release on 14 October led with dollars: the value of permits rose 8.8 per cent in August. Single months jump around. Barrie's August permits covered more than five times as many homes as the August before, 261 against 46. Over the full year, its approvals fell 39 per cent. This article counts homes, not dollars, over a full year, and divides by the people who live in each metro.
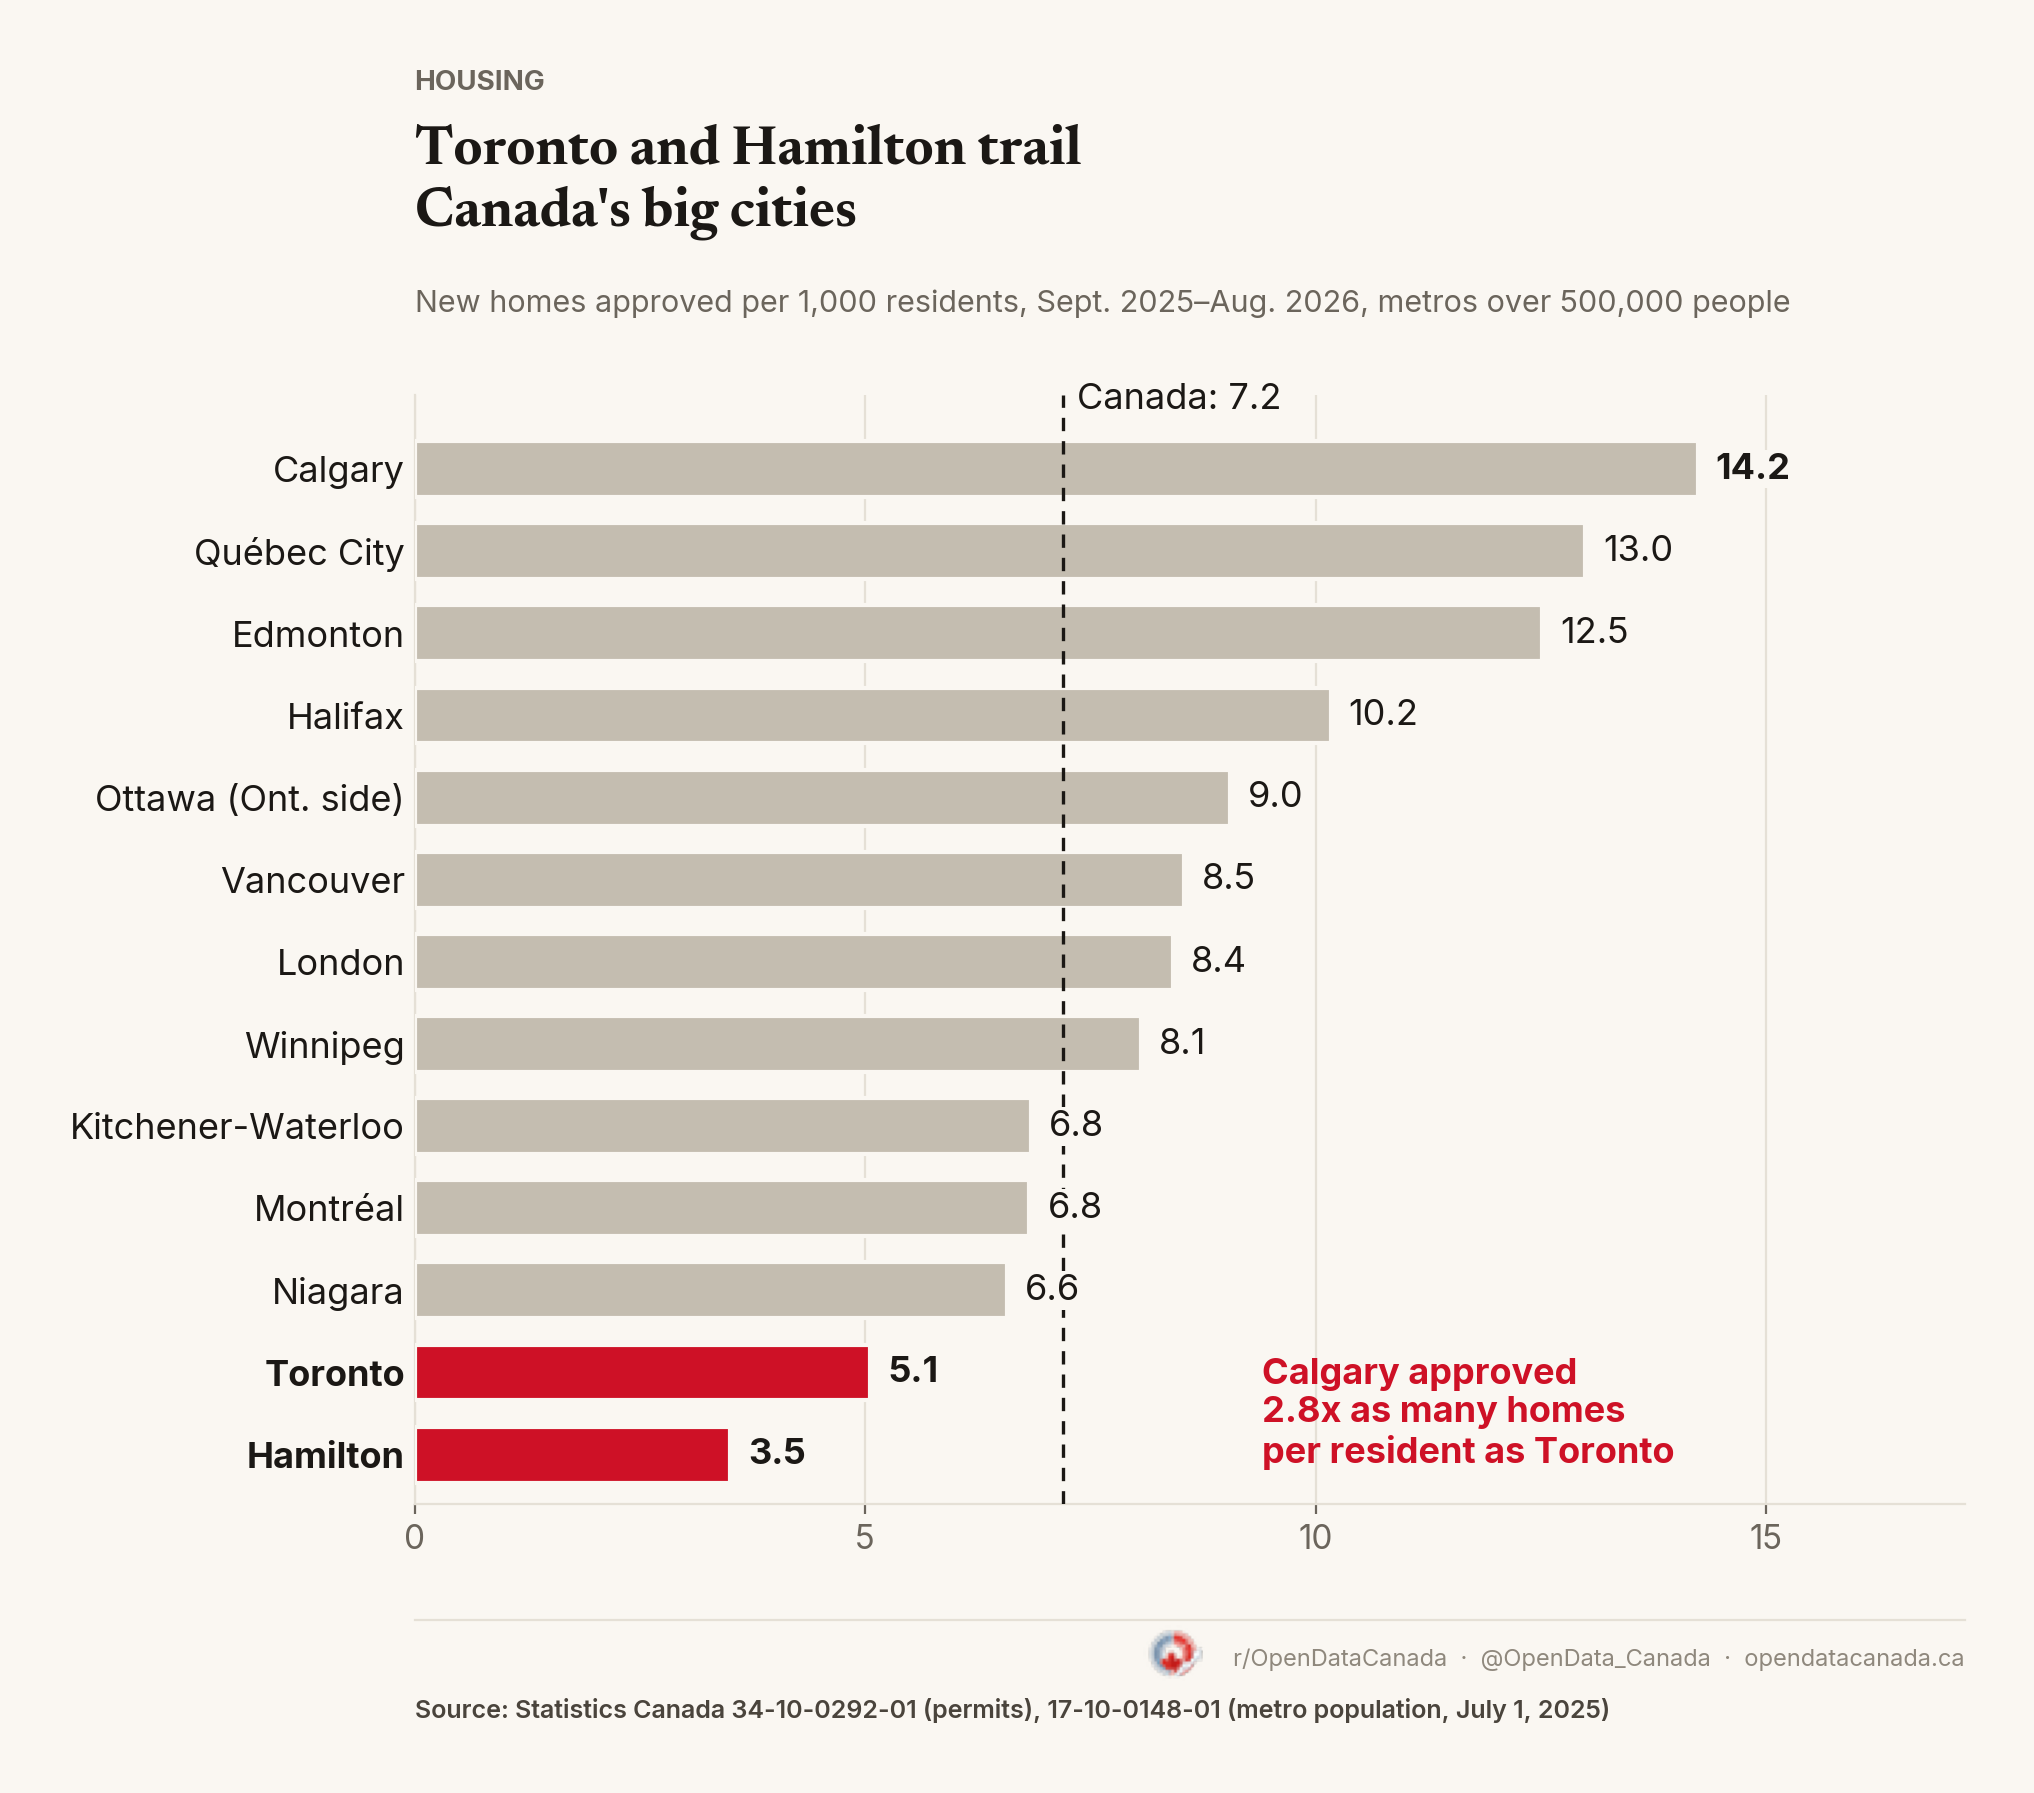
Calgary leads the big metros. Toronto and Hamilton trail.
A building permit is the go-ahead to build. It comes before construction starts, so it is the earliest sign of new supply.
| Metro | Homes approved | Change from prior 12 months | Per 1,000 residents |
|---|---|---|---|
| Calgary | 26,142 | −0.6% | 14.2 |
| Québec City | 11,737 | +24.6% | 13.0 |
| Edmonton | 21,179 | −14.6% | 12.5 |
| Halifax | 5,538 | −14.9% | 10.2 |
| Ottawa (Ontario side) | 11,998 | +9.7% | 9.0 |
| Vancouver | 26,358 | −11.4% | 8.5 |
| London | 5,327 | +16.3% | 8.4 |
| Winnipeg | 7,667 | +34.3% | 8.1 |
| Kitchener-Waterloo | 4,795 | −9.6% | 6.8 |
| Montréal | 31,370 | +18.9% | 6.8 |
| Niagara | 3,312 | +17.3% | 6.6 |
| Toronto | 35,927 | −12.7% | 5.1 |
| Hamilton | 3,048 | +7.7% | 3.5 |
Toronto approved 35,927 homes, more than any other metro. It still ranks near the bottom because 7.1 million people live there. Its approvals fell 12.7 per cent from the year before. Hamilton's rose 7.7 per cent, and it still has the lowest rate of the 13.
Smaller metros fill out both ends. Fredericton (13.9), Moncton (13.8) and Saskatoon (13.5) approved homes at about Calgary's pace. The bottom three are all in Ontario: Belleville (2.8), Windsor (2.6) and Peterborough (2.0). Ontario has 16 of the 42 metros. Its highest is Kingston, 10th at 10.1.
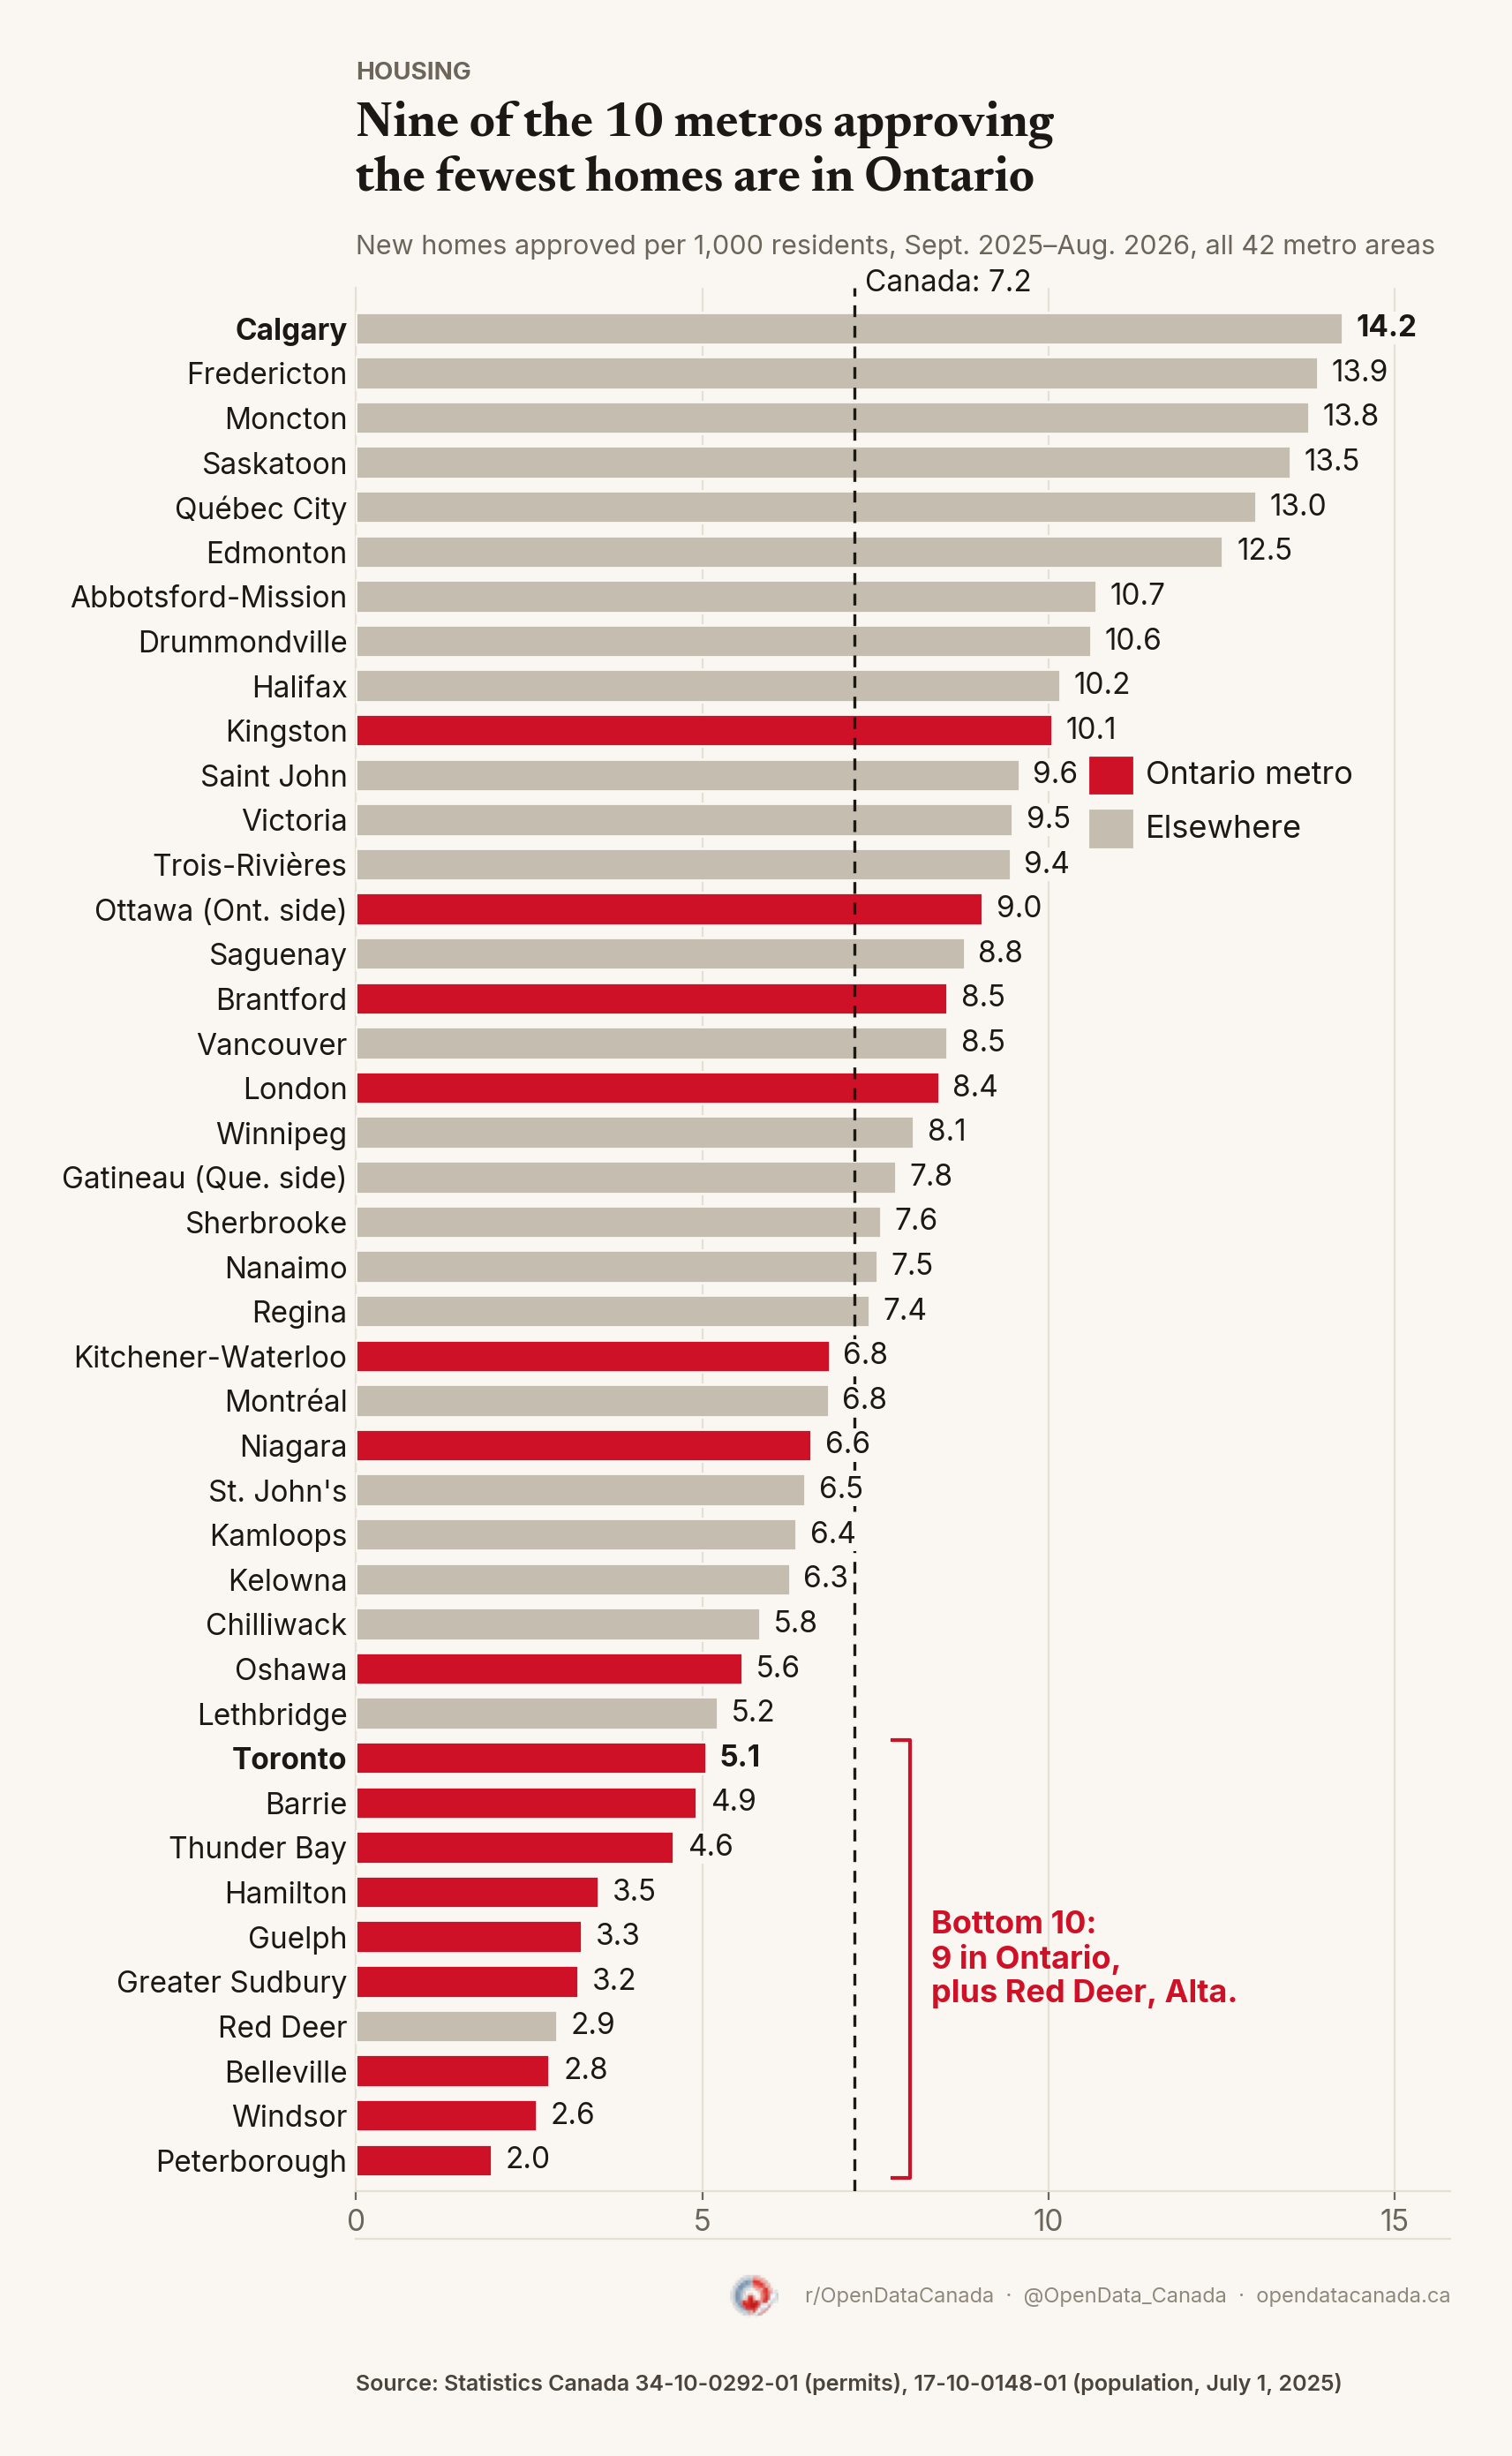
A permit is not a finished home. In 2025, Canada started about 16 per cent fewer homes than it approved. A year of permits is also lumpy: one big condo project can move a mid-sized metro. And the city populations are July 2025 estimates. Statistics Canada revised the national count in September but has not yet revised the city figures.
Ontario is low against other provinces and its own past
The pattern holds across the province. Over the same 12 months, Ontario approved 5.3 homes per 1,000 residents. Québec approved 8.2 and Alberta 10.8.
To compare with history, we used full calendar years. In 2025, Ontario approved 5.5 homes per 1,000 people. Only 18 of the 68 years back to 1957 were lower, and four of those were close to a tie. Most of the 18 fall in two stretches: 1992 to 1998 and 2008 to 2015.
Ontario's 1.5-million-homes target is well behind schedule on housing starts, and asking rents are falling as population growth slows.
Toronto approved more homes than any other metro in Canada. Calgary, Québec City, Edmonton and Halifax each approved at least twice as many for every person who lives there.
Where every metro ranks
| Rank | Metro | Per 1,000 residents | Prov. | Homes approved | Change |
|---|---|---|---|---|---|
| 1 | Calgary | 14.2 | Alta. | 26,142 | −0.6% |
| 2 | Fredericton | 13.9 | N.B. | 1,740 | +27.1% |
| 3 | Moncton | 13.8 | N.B. | 2,699 | −4.2% |
| 4 | Saskatoon | 13.5 | Sask. | 5,104 | +36.6% |
| 5 | Québec City | 13.0 | Que. | 11,737 | +24.6% |
| 6 | Edmonton | 12.5 | Alta. | 21,179 | −14.6% |
| 7 | Abbotsford-Mission | 10.7 | B.C. | 2,391 | +4.1% |
| 8 | Drummondville | 10.6 | Que. | 1,158 | −22.4% |
| 9 | Halifax | 10.2 | N.S. | 5,538 | −14.9% |
| 10 | Kingston | 10.1 | Ont. | 1,945 | +46.2% |
| 11 | Saint John | 9.6 | N.B. | 1,384 | +41.1% |
| 12 | Victoria | 9.5 | B.C. | 4,220 | −4.8% |
| 13 | Trois-Rivières | 9.4 | Que. | 1,647 | +3.9% |
| 14 | Ottawa (Ontario side) | 9.0 | Ont. | 11,998 | +9.7% |
| 15 | Saguenay | 8.8 | Que. | 1,495 | +10.8% |
| 16 | Brantford | 8.5 | Ont. | 1,505 | +1.6% |
| 17 | Vancouver | 8.5 | B.C. | 26,358 | −11.4% |
| 18 | London | 8.4 | Ont. | 5,327 | +16.3% |
| 19 | Winnipeg | 8.1 | Man. | 7,667 | +34.3% |
| 20 | Gatineau (Quebec side) | 7.8 | Que. | 2,917 | −32.9% |
| 21 | Sherbrooke | 7.6 | Que. | 1,847 | −26.3% |
| 22 | Nanaimo | 7.5 | B.C. | 977 | +79.3% |
| 23 | Regina | 7.4 | Sask. | 2,159 | +16.5% |
| 24 | Kitchener-Cambridge-Waterloo | 6.8 | Ont. | 4,795 | −9.6% |
| 25 | Montréal | 6.8 | Que. | 31,370 | +18.9% |
| 26 | St. Catharines-Niagara | 6.6 | Ont. | 3,312 | +17.3% |
| 27 | St. John's | 6.5 | N.L. | 1,578 | +22.2% |
| 28 | Kamloops | 6.4 | B.C. | 809 | −14.2% |
| 29 | Kelowna | 6.3 | B.C. | 1,594 | −25.8% |
| 30 | Chilliwack | 5.8 | B.C. | 760 | +30.8% |
| 31 | Oshawa | 5.6 | Ont. | 2,751 | +46.8% |
| 32 | Lethbridge | 5.2 | Alta. | 748 | +5.1% |
| 33 | Toronto | 5.1 | Ont. | 35,927 | −12.7% |
| 34 | Barrie | 4.9 | Ont. | 1,242 | −38.6% |
| 35 | Thunder Bay | 4.6 | Ont. | 614 | +26.6% |
| 36 | Hamilton | 3.5 | Ont. | 3,048 | +7.7% |
| 37 | Guelph | 3.3 | Ont. | 597 | −9.3% |
| 38 | Greater Sudbury | 3.2 | Ont. | 624 | +39.9% |
| 39 | Red Deer | 2.9 | Alta. | 334 | −30.1% |
| 40 | Belleville-Quinte West | 2.8 | Ont. | 349 | −61.0% |
| 41 | Windsor | 2.6 | Ont. | 1,277 | −31.5% |
| 42 | Peterborough | 2.0 | Ont. | 293 | +23.6% |