Housing · 5 min read
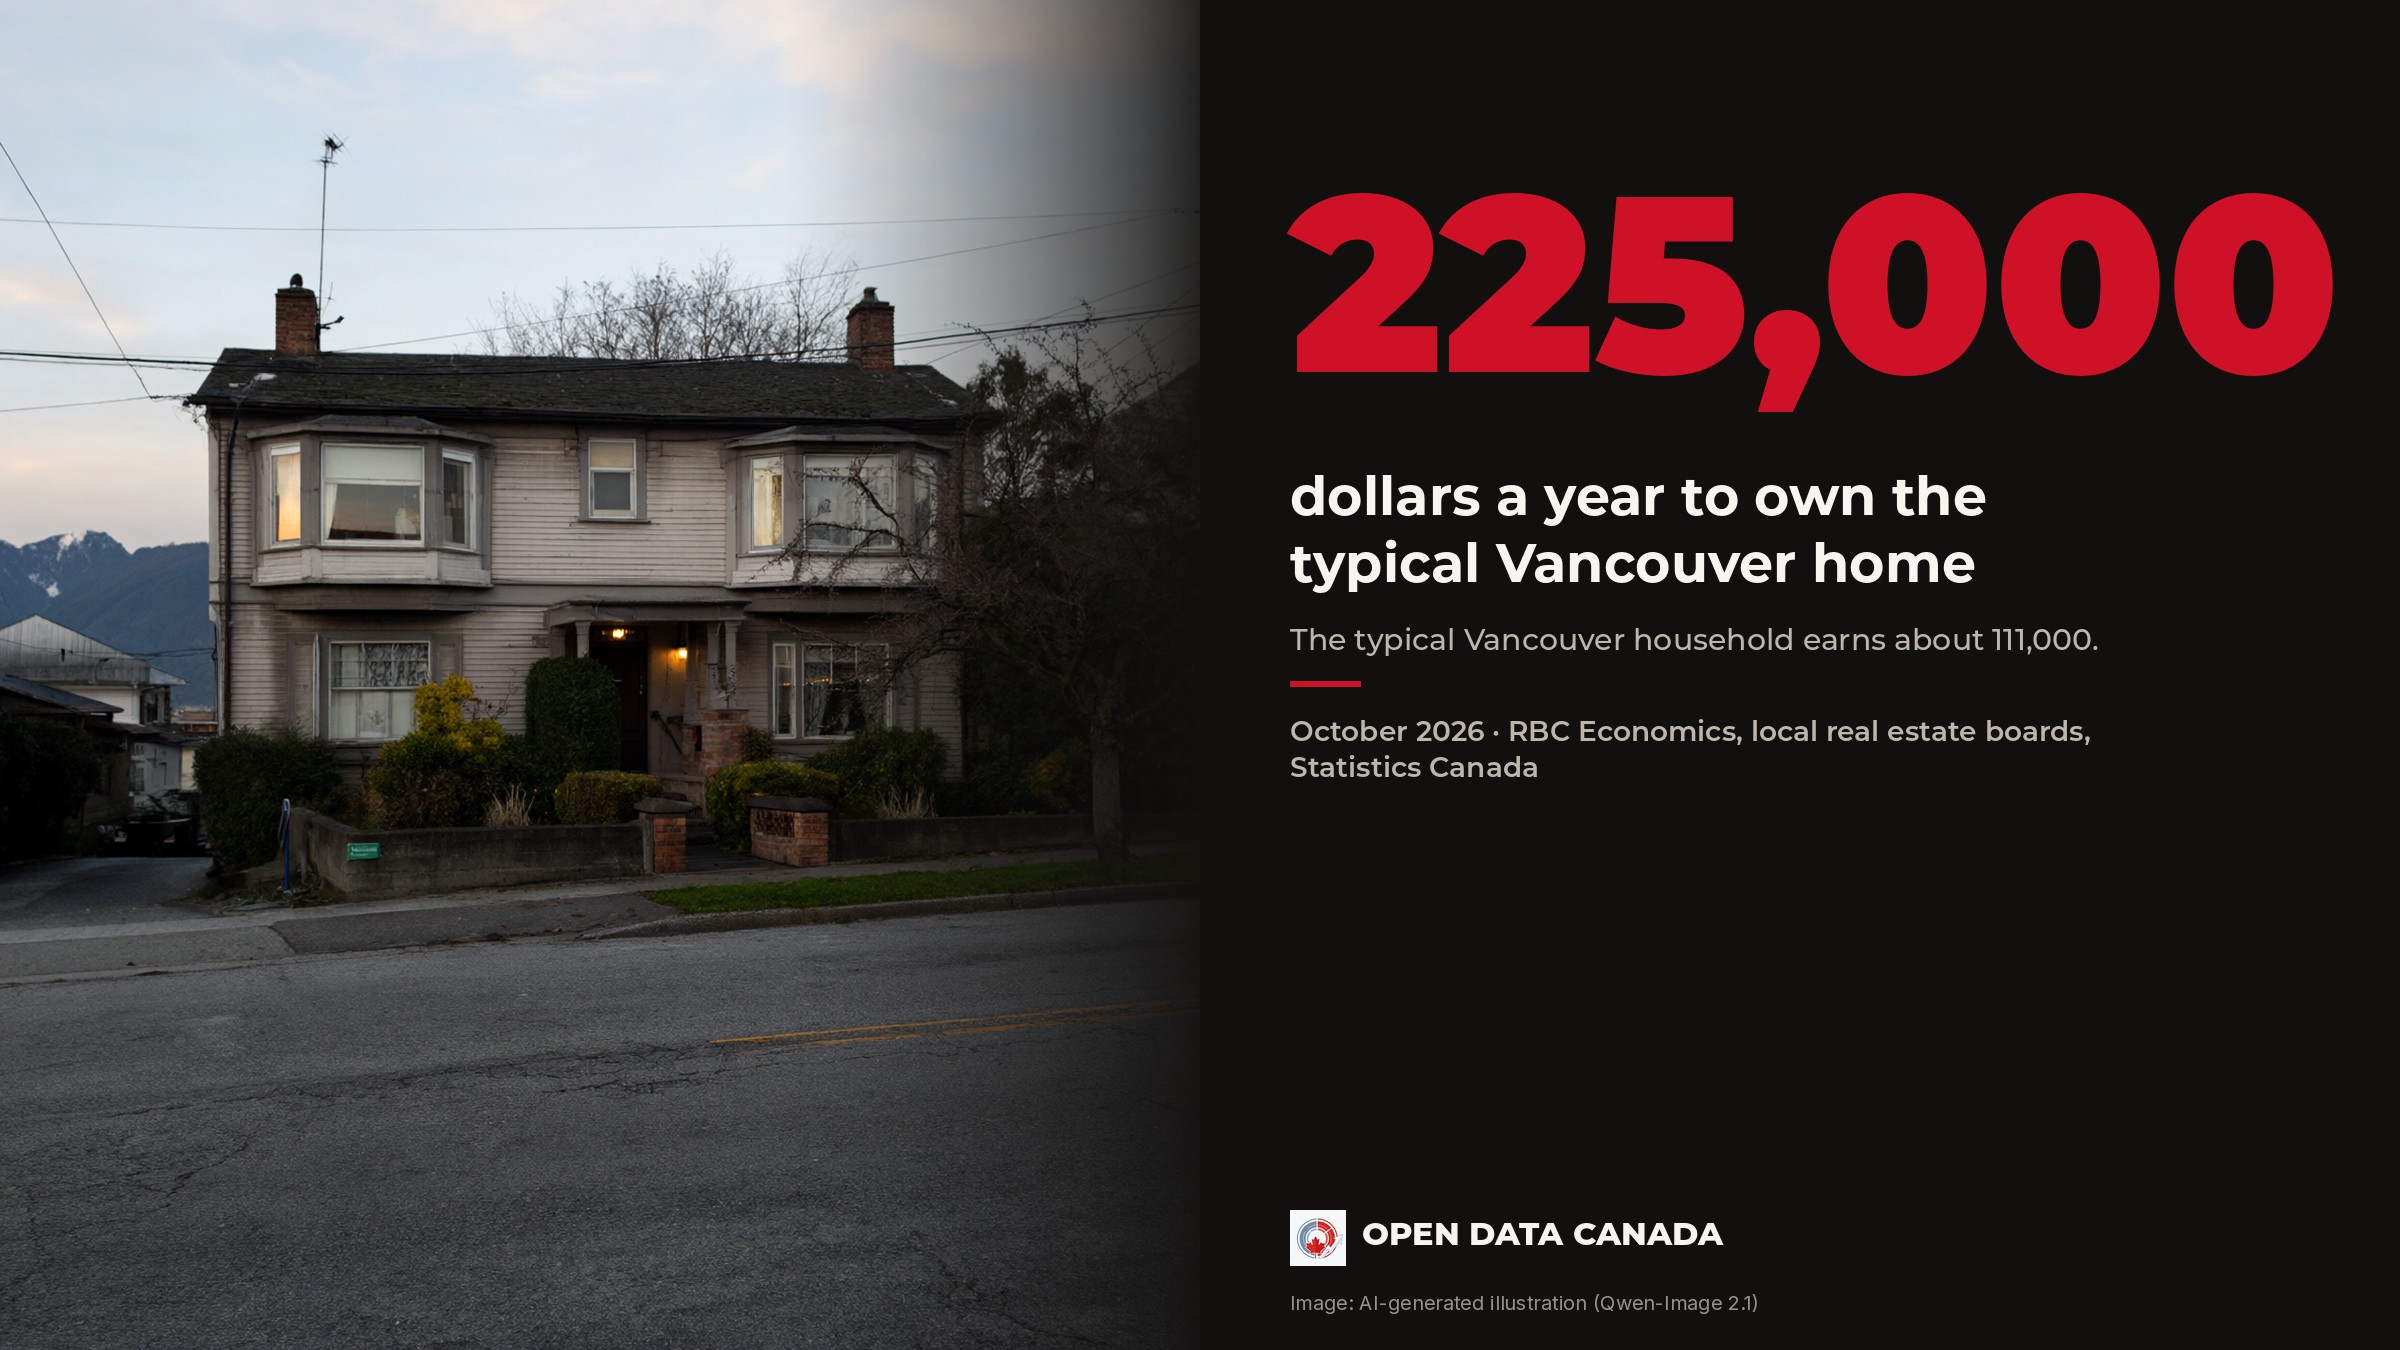
Buying a typical Vancouver home requires about 225,000 dollars a year
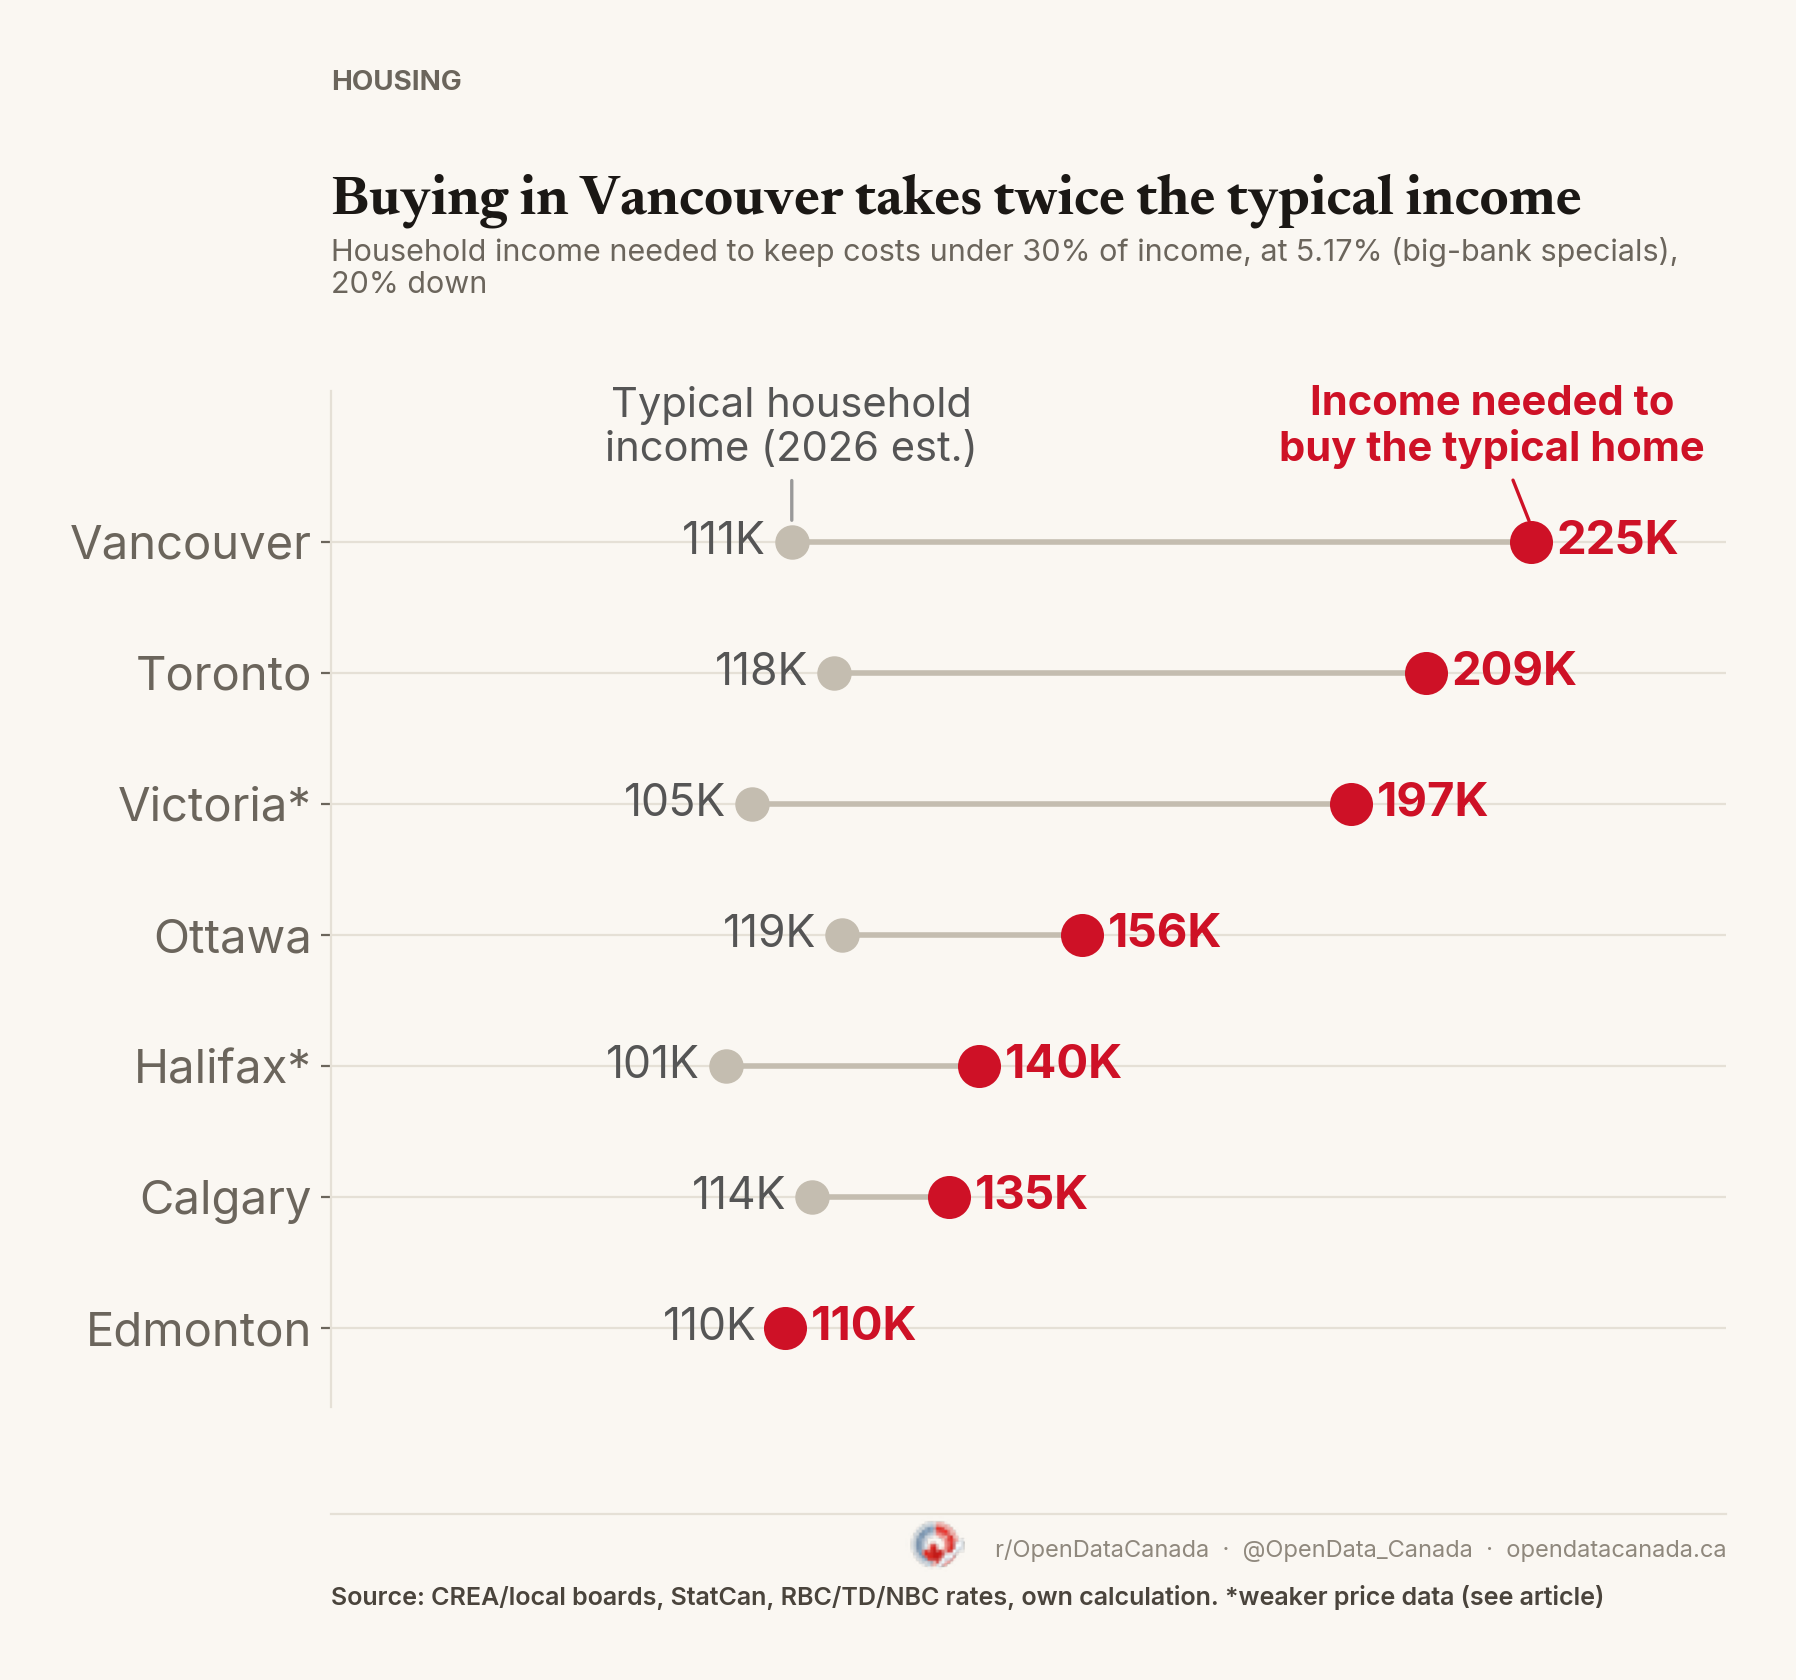
At the five-year fixed rate three big banks are offering, none of our seven cities passes the 30% affordability test, and Edmonton sits right on the line. Even at the lowest rate we found, only Edmonton passes. Vancouver is the extreme, at about 225,000 dollars a year, twice what a typical household earns.
On 28 September, RBC Economics said relief for Canadian home buyers is tapering off. Its national measure barely moved in the second quarter, to 52.8% of median household income. That number is hard to feel, so we asked a plainer question: how much does a household need to earn to own the typical home in each big city?
RBC does not publish dollar incomes, so we estimated them with a method like RBC's. The answer runs from about 110,000 dollars a year in Edmonton to about 225,000 in Vancouver.
The yardstick, and why these numbers are a floor
We used a common yardstick, also used by Canada's federal housing agency: housing costs should stay under 30% of pre-tax household income. Costs here are the mortgage payment, property tax and utilities, on a 20% down payment and a 25-year mortgage. We then worked backwards to the income that makes those costs equal 30%.
The mortgage rate matters a lot. We used 5.17%, the average of the five-year fixed special rates published on 8 October by RBC (5.14%), TD (5.34%) and National Bank (5.04%) for buyers putting 20% down. We could not get rates from BMO, CIBC or Scotiabank, so this covers three of the six largest banks. Brokers and credit unions often do better: the lowest rate we found, 4.44% (WOWA, 7 October), would bring Vancouver to about 210,000. The posted five-year rate the Bank of Canada publishes (6.19%), which almost nobody pays, would push it to about 246,000. A bank would also test your application at a higher rate than the one you sign.
Edmonton sits right on the line, and only low rates save it
On our estimates, Edmonton is the closest: a typical household earns about 110,000 and needs about 110,000, a few hundred dollars short (about 400), which is well inside the uncertainty of estimated incomes. It passes only below a rate of about 5.1%, so at the lowest rate we found it has about 5,000 dollars to spare. At 6.19%, no city passes. RBC's own measure agrees on the direction: it puts Edmonton at 36.8% of median income, above the 30% line, and the other six cities in our table higher.
| City | Income needed (dollars a year) | Typical household income, est. (dollars a year) | Shortfall (dollars a year) |
|---|---|---|---|
| Vancouver | 225,000 | 111,000 | 114,000 |
| Toronto | 209,000 | 118,000 | 91,000 |
| Victoria* | 197,000 | 105,000 | 92,000 |
| Ottawa | 156,000 | 119,000 | 37,000 |
| Halifax* | 140,000 | 101,000 | 39,000 |
| Calgary | 135,000 | 114,000 | 21,000 |
| Edmonton | 110,000 | 110,000 | 400 |
*Weaker price data (Victoria is our own estimate, Halifax is an August figure): see the methodology box. Shortfalls are calculated from unrounded figures.
Toronto and Victoria are neck and neck
RBC puts Vancouver at 83.9% of median income, the worst in the country. Toronto sits at 64.1% and Victoria at 63.3%, a gap of under one point. RBC says the order of second and third worst could flip for the first time since 2011.
Our figures show why. A Toronto buyer needs about 11,500 dollars more income than a Victoria buyer, but Victoria households earn about 13,000 less. As a share of local income, Victoria already comes out slightly worse on our numbers, 56% to Toronto's 53%.
RBC also notes that Toronto condos have stayed more affordable than Montreal's for a second straight quarter, something not seen in 16 years. We could not test that one: we could not find a comparable Montreal home price, so Montreal is not in our table.
Why Vancouver stands apart
The typical home across Metro Vancouver cost 1,075,900 dollars in September, by the real estate board's benchmark price. A detached house cost 1,784,700 and would need about 368,000 of household income. An apartment, at 682,500, would need about 146,000.
RBC says home prices there are off 3% to 7% from a year ago, and it blames a softening job market in British Columbia for keeping falling prices from helping as much as they should. Vancouver improved by a full percentage point in the second quarter, the second-largest drop among the markets RBC tracks. It started from so far up that it is still the least affordable market in the country.
It may get worse before it gets better. RBC expects "a modest loss of affordability as 2027 rolls in", as bond yields rise and Bank of Canada rate hikes loom. The posted five-year rate rose from 6.09% to 6.19% in the week before this article was published.
Related: 56% of Canadians who don't own a home don't expect to ever own one.