
Article · Transit · 6 min read
Every big Canadian city is losing transit riders again — and only Edmonton ever beat its pre-pandemic level
Measured in linked trips from the operators' own records, one Canadian transit system carries more riders than it did in 2019. Every other big city is still below its pre-pandemic level, and in 2026 all of them, Edmonton included, are carrying fewer riders than a year ago.
Five years of "recovery" reporting has trained readers to expect the same chart every year: ridership climbing back toward the 2019 line, each city a little closer than last year. That chart is now wrong in both directions. One city, Edmonton, crossed the line back in 2023 and kept going. The rest never got there. And the newest monthly data says the climb itself has stopped.
One definition drives everything here, so it gets stated once. Every number is linked trips: one complete journey from origin to destination, however many transfers it takes. Some agencies headline "boardings" instead, which recount the same rider at every transfer and run 1.5 to 1.7 times higher — TransLink, which publishes both, logged 241 million journeys against 404 million boardings in 2024. Mixing the two is the easiest way to lie with transit data. And a trip is not a person: a commuter who drops from five office days a week to two halves their "ridership" without ever leaving the system. Levels also aren't comparable between agencies, which is why every city is indexed against its own 2019 rather than raced as absolute lines.
Where the recovery actually landed
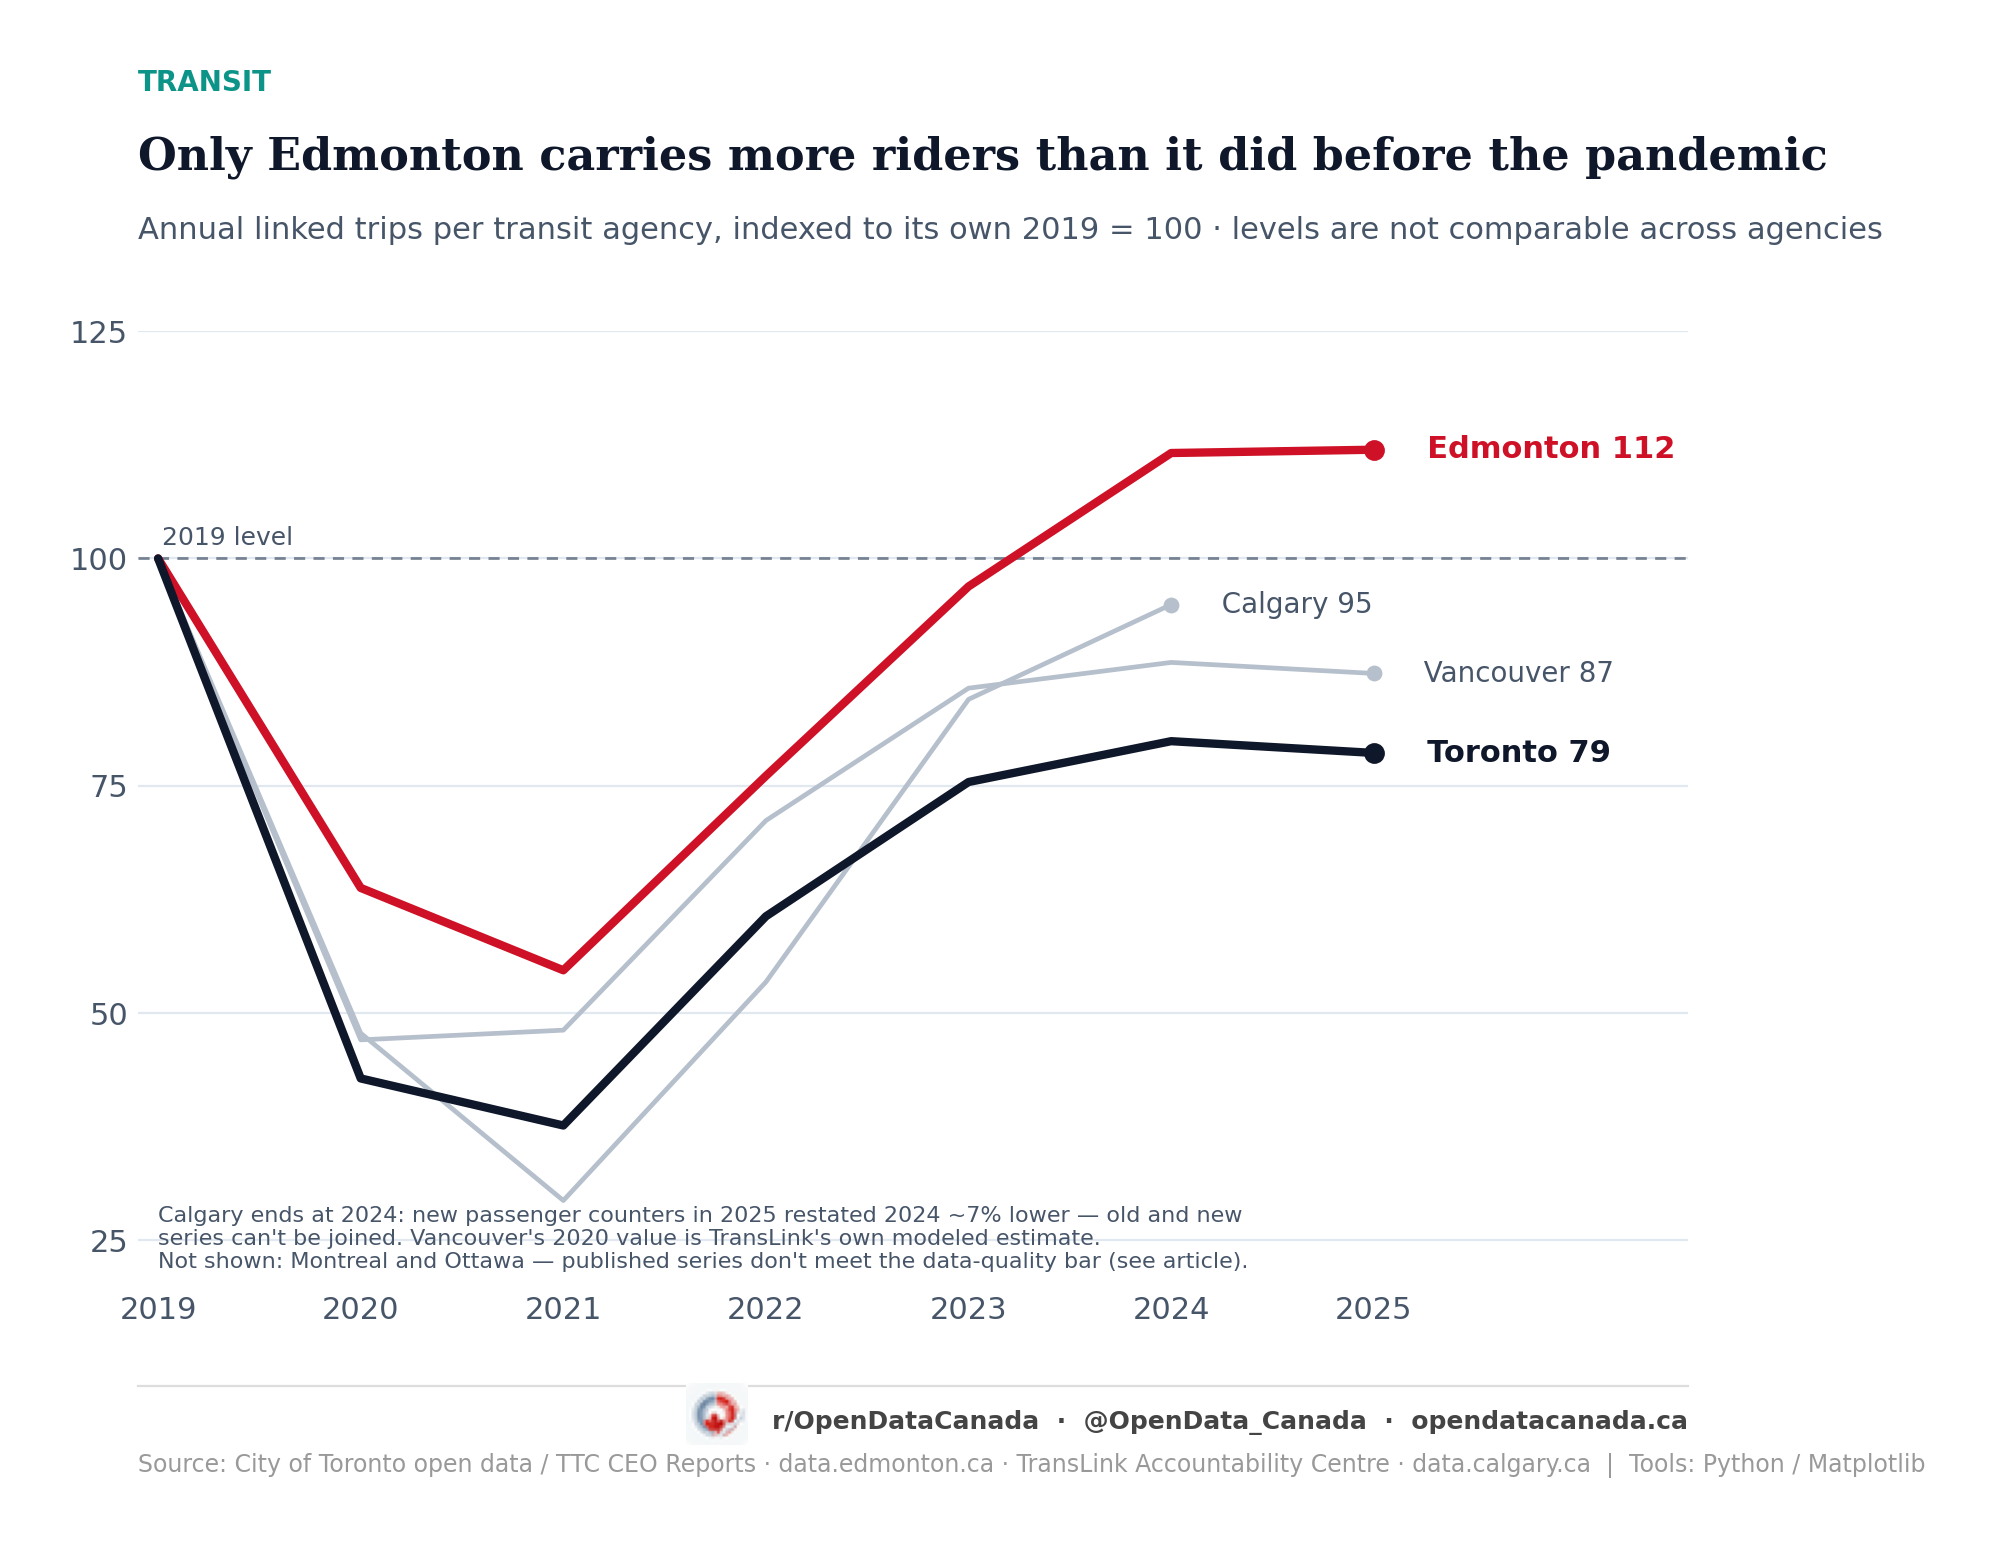
By the end of 2025, the four cities whose data survives our quality bar (more on that bar below) sat here, with 2019 as 100:
| City | Latest full year | Index (2019 = 100) | Linked trips |
|---|---|---|---|
| Edmonton | 2025 | 112 | 61.8M, up from 55.2M in 2019 |
| Calgary | 2024* | 95 | 101.1M, down from 106.5M in 2019 |
| Vancouver | 2025 | 87 | 237.6M, down from 272.0M in 2019 |
| Toronto | 2025 | 79 | 413.1M, down from 525.5M in 2019 |
* Calgary's comparable series ends at 2024; the agency changed its counting method in 2025 (explained below).
Toronto's gap is the one that should reframe the conversation. The TTC is missing 112 million trips a year against 2019, more than Calgary's entire annual ridership. And Toronto's number isn't still climbing toward the line: 2025 (413.1M) came in below 2024 (419.9M). The recovery peaked, then slipped.
2026: down everywhere we can measure
The sharper finding is in the freshest data. Four of the six big-city agencies have published at least some 2026 months. All four are carrying fewer riders than in the same months of 2025:
- Toronto: 198.7M trips January through June, against 202.2M in the same months of 2025. Down 1.8 percent, and still 25.8 percent below the same months of 2019.
- Vancouver: 94.7M journeys January through May, against 98.6M last year. Down 3.9 percent on TransLink's own accountability data.
- Edmonton: 25.7M trips January through May, against 26.9M last year. Down 4.3 percent, in the one city that had fully recovered.
- Ottawa: rolling twelve-month ridership through April 2026 is 0.1 percent below the prior year, and the individual 2026 months published so far run about 6 percent below the same months of 2025. Ottawa gets an asterisk the others don't: an axle-bearing defect discovered in January 2026 sidelined 41 of the 60 Line 1 light-rail cars at its worst point, with full capacity not expected back before late May. Part of Ottawa's dip is trains that weren't there to ride, not riders who stayed home.
When the Q1 2025 numbers stalled nationally, analysts reached for weather; Toronto Metropolitan University's urban-research centre, reviewing Statistics Canada's agency-level series in June 2025, attributed the softness to a harsh winter. The 2026 data undercuts that. Edmonton was still growing through 2024 and flat in 2025 (61.6M to 61.8M); now it's down too. Whatever is happening, it isn't a cold snap.
And it's genuinely new. Set 2020 aside and no year in this data had every measurable city losing riders at once — through 2021 and 2022 someone was always growing, and even in 2025 Edmonton eked out a gain. In 2026, nobody is. One city dipping for a quarter is noise; half a year of it across four cities in three provinces is a trend.
The Edmonton exception, while it lasted
Edmonton's 112 is remarkable, and it isn't a mystery. Ridership climbed from 42.0M (2022) to 53.5M (2023), then jumped to 61.6M in 2024 — the first full year with the Valley Line Southeast LRT, which opened in November 2023. That pushed the city past its pre-pandemic level while every larger system was still 15 to 25 points short. Its data is also the most trustworthy of the six: the city's open-data feed and Statistics Canada's independent transit survey agree within 0.1 percent in every month we checked.
But the exception has an expiry date on it. Flat in 2025. Down 4.3 percent so far in 2026. Edmonton finished the recovery and then joined the decline.
Per resident, nobody recovered
There's one more honest cut of the data, and it's the least flattering of all. Every one of these metro areas has far more people than it did in 2019: Calgary's population is up 22 percent, Edmonton's 18, Vancouver's and Ottawa–Gatineau's about 14, Toronto's 11, Montreal's 6 (Statistics Canada metro-area estimates). Divide trips by people and the recovery vanishes entirely. Per resident, nobody is anywhere near the line:
| City | Population growth since 2019 | Raw trips (2019 = 100) | Per resident (2019 = 100) |
|---|---|---|---|
| Edmonton | +18% | 112 | ~95 |
| Calgary (2024) | +19% | 95 | ~80 |
| Vancouver | +14% | 87 | ~77 |
| Toronto | +11% | 79 | ~71 |
One caveat: each agency's service area is smaller than its census metro area, so the per-resident column is an approximation, but the direction isn't in doubt.
So the full picture has three layers, each worse than the last. In raw trips, one city out of six beat 2019. Per resident, none did. And as of 2026, the raw numbers are falling everywhere too. Canadians, per person, are simply using transit less than they did before the pandemic, in every city, including the winner.
What about Montreal and Ottawa?
They're in the story but not the chart, and the reason is the data, not the cities.
Montreal (STM) publishes ridership only in annual-report PDFs, and its own history contains a break it printed itself: the 2018 report shows two figures for the same year, 450.4 million on a ticket-sales basis and 365.2 million on an electronic-validation basis, 19 percent apart. Statistics Canada's current figure for the STM runs about 25 percent above the STM's own annual report, consistent with the two bases still coexisting. For the record, on the validation basis STM ridership was 374.9M in 2019, 314.6M in 2024 and 293.9M in 2025, and the regional authority attributes the 2025 drop partly to strikes and REM outages. Directionally that matches Toronto: below 2019, and falling again. But when a publisher's own figures disagree by a quarter, we don't chart them.
Ottawa (OC Transpo) published no primary annual ridership report between 2021 and the launch of its monthly open-data KPI series, whose history starts in February 2024. Its 2019 baseline exists only in a table compiled second-hand by Ontario's Financial Accountability Office. A 2019 = 100 index is only as good as its 2019 value, so Ottawa gets text, not a line. What its official monthly data does show: roughly flat year-over-year through April 2026, with the published 2026 months running below 2025.
Calgary broke its own ruler
What happened in Calgary in 2025 is a case study in why "just chart the numbers" is never that simple. That year Calgary Transit finished installing automated passenger counters on the CTrain, reported 93.1 million trips under the new counting method, and restated 2024 from the 101.1 million in its open-data feed down to 93.7 million. Same city, same riders, same year: 7.3 percent apart depending on which counter you believe. The old and new series cannot be joined, so Calgary's line stops at 2024 with the break disclosed. On the new method, Calgary was down 0.6 percent in 2025, a dip the agency attributes to a February extreme-cold event, fall route cuts driven by workforce shortages, and the October teacher strike.
The uncomfortable footnote: Calgary's open-data feed hasn't published a usable monthly number since June 2025. A city that restates its recent history 7 percent in one direction, then goes quiet for a year, is exactly why this article spends so many words on sourcing.
So why did the recovery stop?
The obvious suspect is remote work: the cities stuck furthest below 2019 ran on downtown office commuters, and the cities that recovered best supposedly never emptied their offices to the same depth. Rather than assert that, we tested it against the only city-level measurement that exists: the 2021 Census place-of-work data (Statistics Canada table 98-10-0455-01), which records what share of each metro's workers worked at home.
The suspect explains the extremes and not the middle. At the bookends it fits perfectly: Ottawa–Gatineau had the country's deepest work-from-home share (39.7 percent of workers) and has the deepest ridership hole, more than a quarter below 2019 on the only baseline that exists. Edmonton had the shallowest share (20.7 percent) and is the only city that fully recovered. Toronto fits too: second-highest work-from-home share (35.4 percent), second-weakest recovery. But between the bookends the theory falls apart. Calgary's work-from-home share (28.1 percent) was higher than both Vancouver's (26.5) and Montreal's (25.8), yet Calgary recovered to about 95 while Montreal is stuck around 78. If remote work were the whole story, Calgary should look like Montreal. It doesn't, by seventeen index points. For where work from home stands nationally in 2026, see 17 percent of Canadian workers still do most of their hours from home.
One caveat, stated once: that census was taken in May 2021, under Ontario's stay-at-home order and Quebec's curfews, so it captures peak lockdown rather than today's hybrid equilibrium, and its "worked at home" category includes always-home jobs. It's the best city-level evidence there is, and it's thin. Anyone selling you a single cause for a four-city, three-province reversal is ahead of the data.
What the ridership files alone can say is narrower and, frankly, more useful: the era of assuming riders will drift back on their own is over. Since roughly 2023 the recovery curve has flattened in every city, and in 2026 it bent downward in all of them at once.
That matters because "the riders are coming back" is a budget line, not just a narrative. Fare revenue projections, service-hour plans and provincial operating deals across the country are built on ridership curves that point up. The operators' own data now shows those curves pointing slightly down, from starting levels that are still 13 percent below pre-pandemic in Vancouver and 21 percent below in Toronto. Somebody's spreadsheet is wrong, and it isn't the fare gates'.
Methodology and data quality
Read next