Article · Economy · 4 min read
43 of 44 Canadian Social Assistance Scenarios Fell Below the Poverty Line in 2025
Across every province, Maytree modelled 44 household scenarios against Canada's official poverty line in 2025. Forty-three came in below what the basics cost. The one exception, in Quebec, reaches just 3 percent of the province's social assistance caseload.
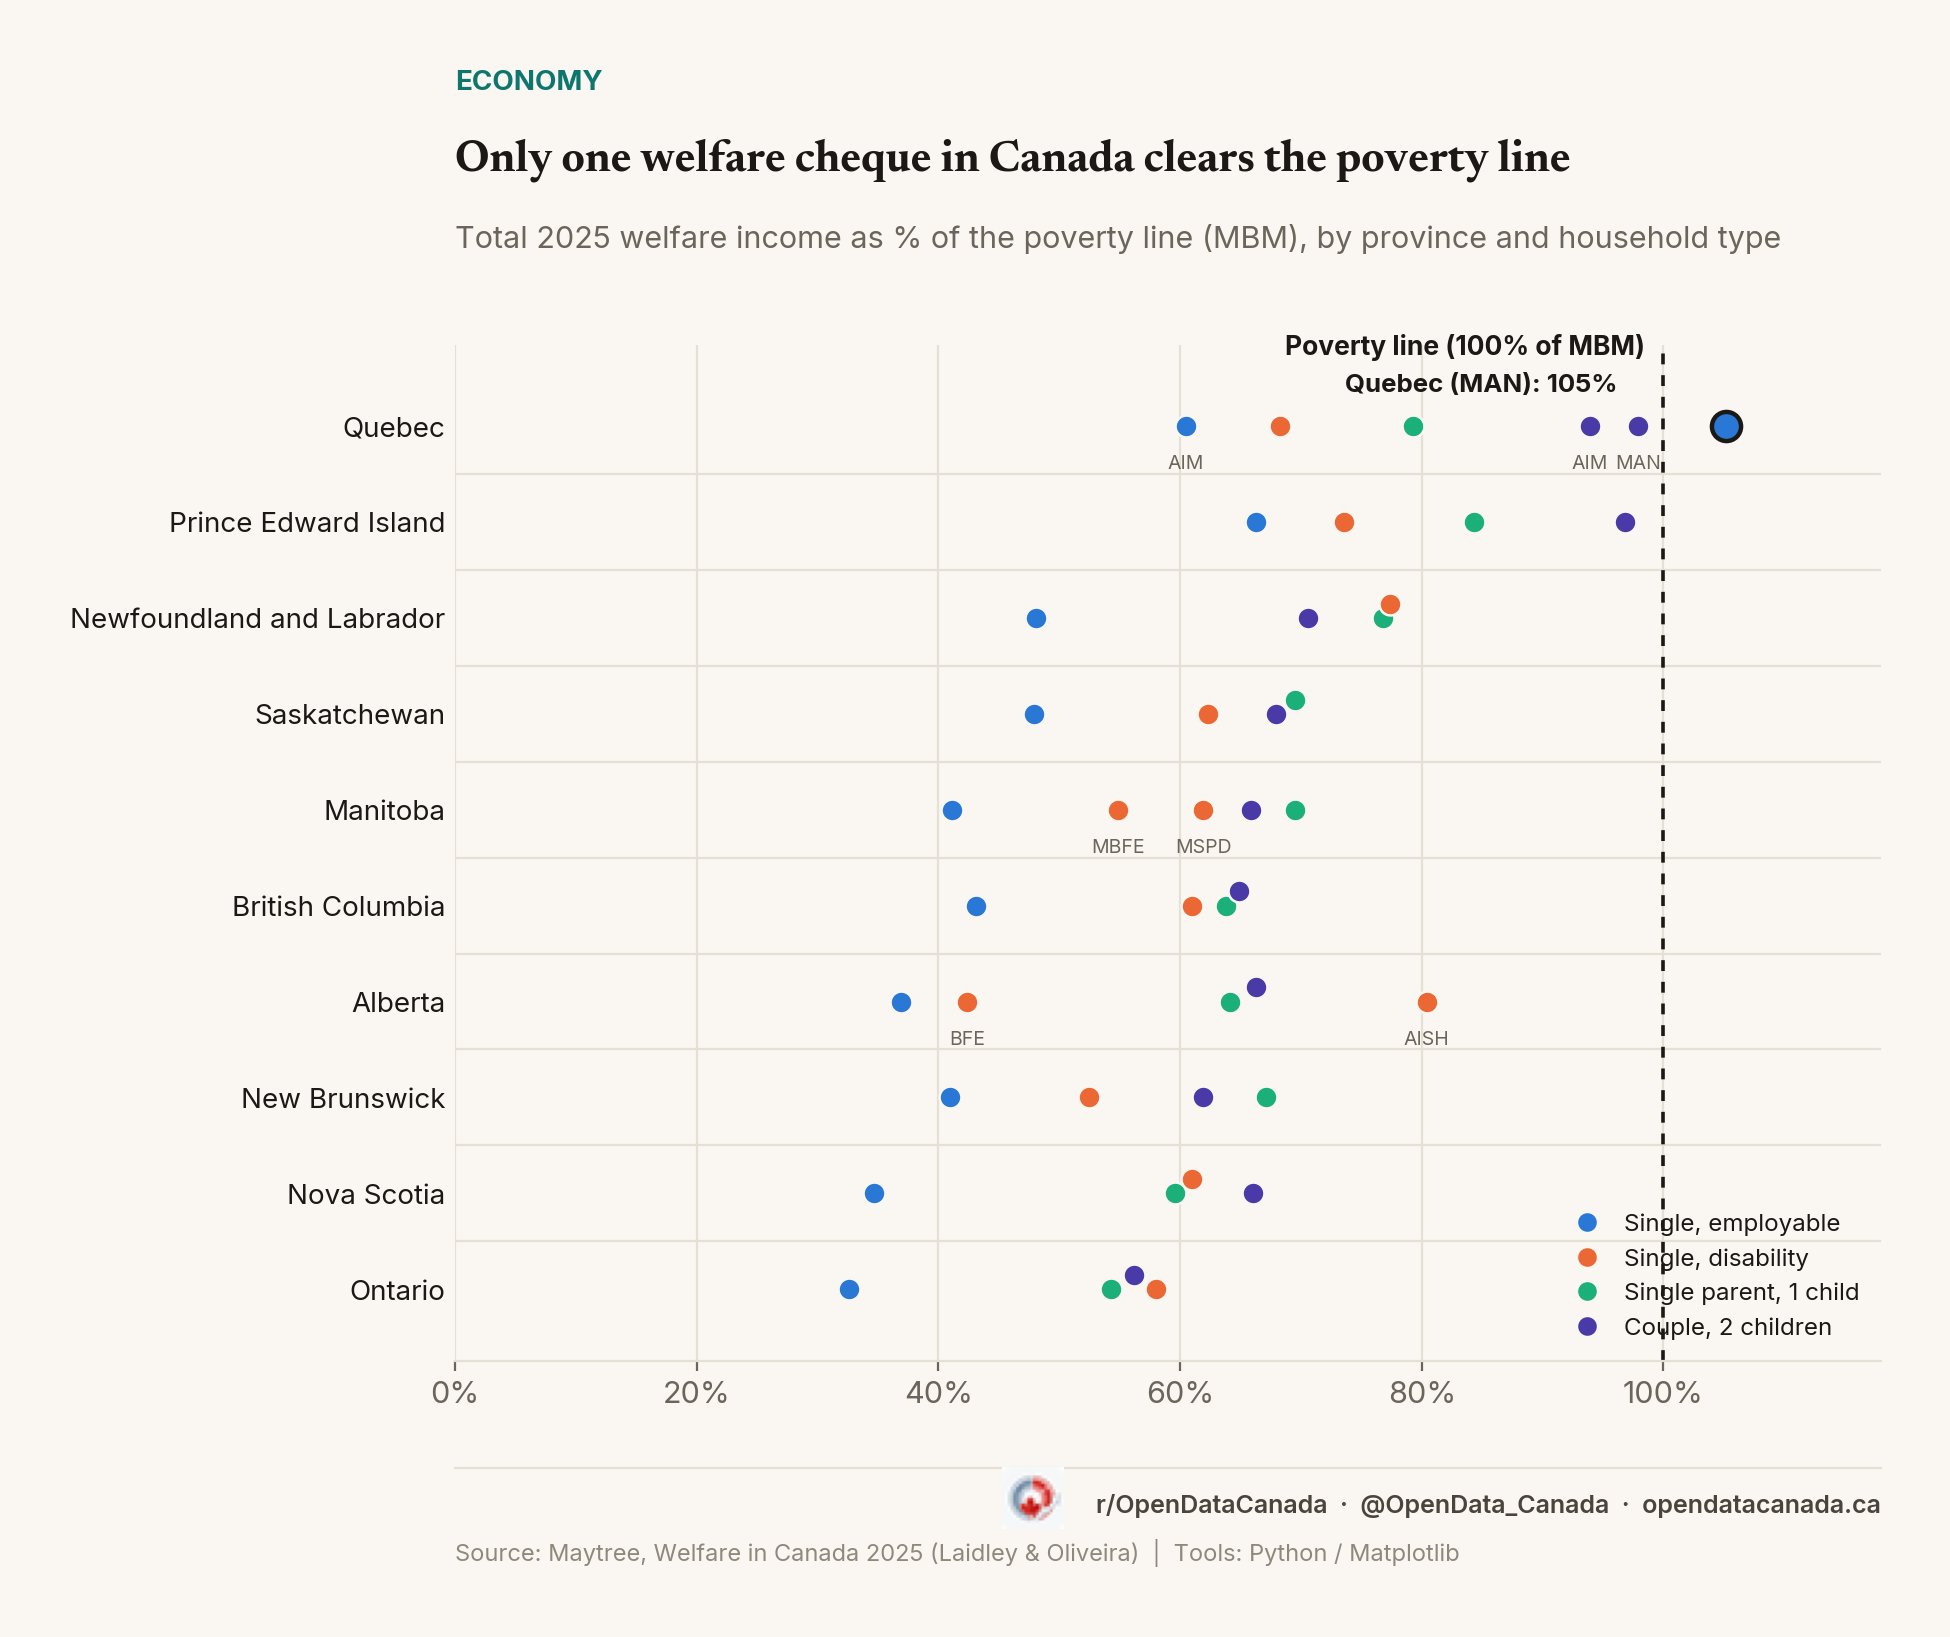
Every year, Maytree, a Toronto-based anti-poverty policy foundation that has tracked this data since 2018, builds a model household scenario for each province (a single adult, a single parent, a person with a disability, a couple with two kids) and adds up everything they'd actually receive: basic social assistance, provincial supplements, the GST credit, the Canada Child Benefit, the Canada Carbon Rebate. "Welfare income," as Maytree defines it, means that full total, not just the provincial assistance cheque. Then it checks that total against the Market Basket Measure, Canada's official poverty line, calculated for that province and household size.
In 2025, it ran that check 44 times. Forty-three came in under the line.
The one exception is a single, employable adult in Quebec receiving the province's Manpower Training measure (MAN), a program tied to participation in employment training. That household's total welfare income was 105 percent of the poverty line. Every other household modelled anywhere in the country, including three other Quebec programs, landed below 100 percent.
The exception isn't really an exception
The Quebec number looks like good news until you check who actually gets it. Only about 3 percent of Quebec's social assistance caseload received MAN benefits in 2025, according to Maytree. Most single, employable adults in the province are on the Aim for Employment program (AIM) instead, which paid just 60 percent of the poverty line that year, barely better than the national worst performers.
The 105 percent figure therefore does not represent the typical experience of people receiving social assistance in Quebec. It reflects a narrow, participation-gated program that happens to clear a bar that nothing else in the country does, for a small slice of the people it could theoretically help.
Where the floor actually is
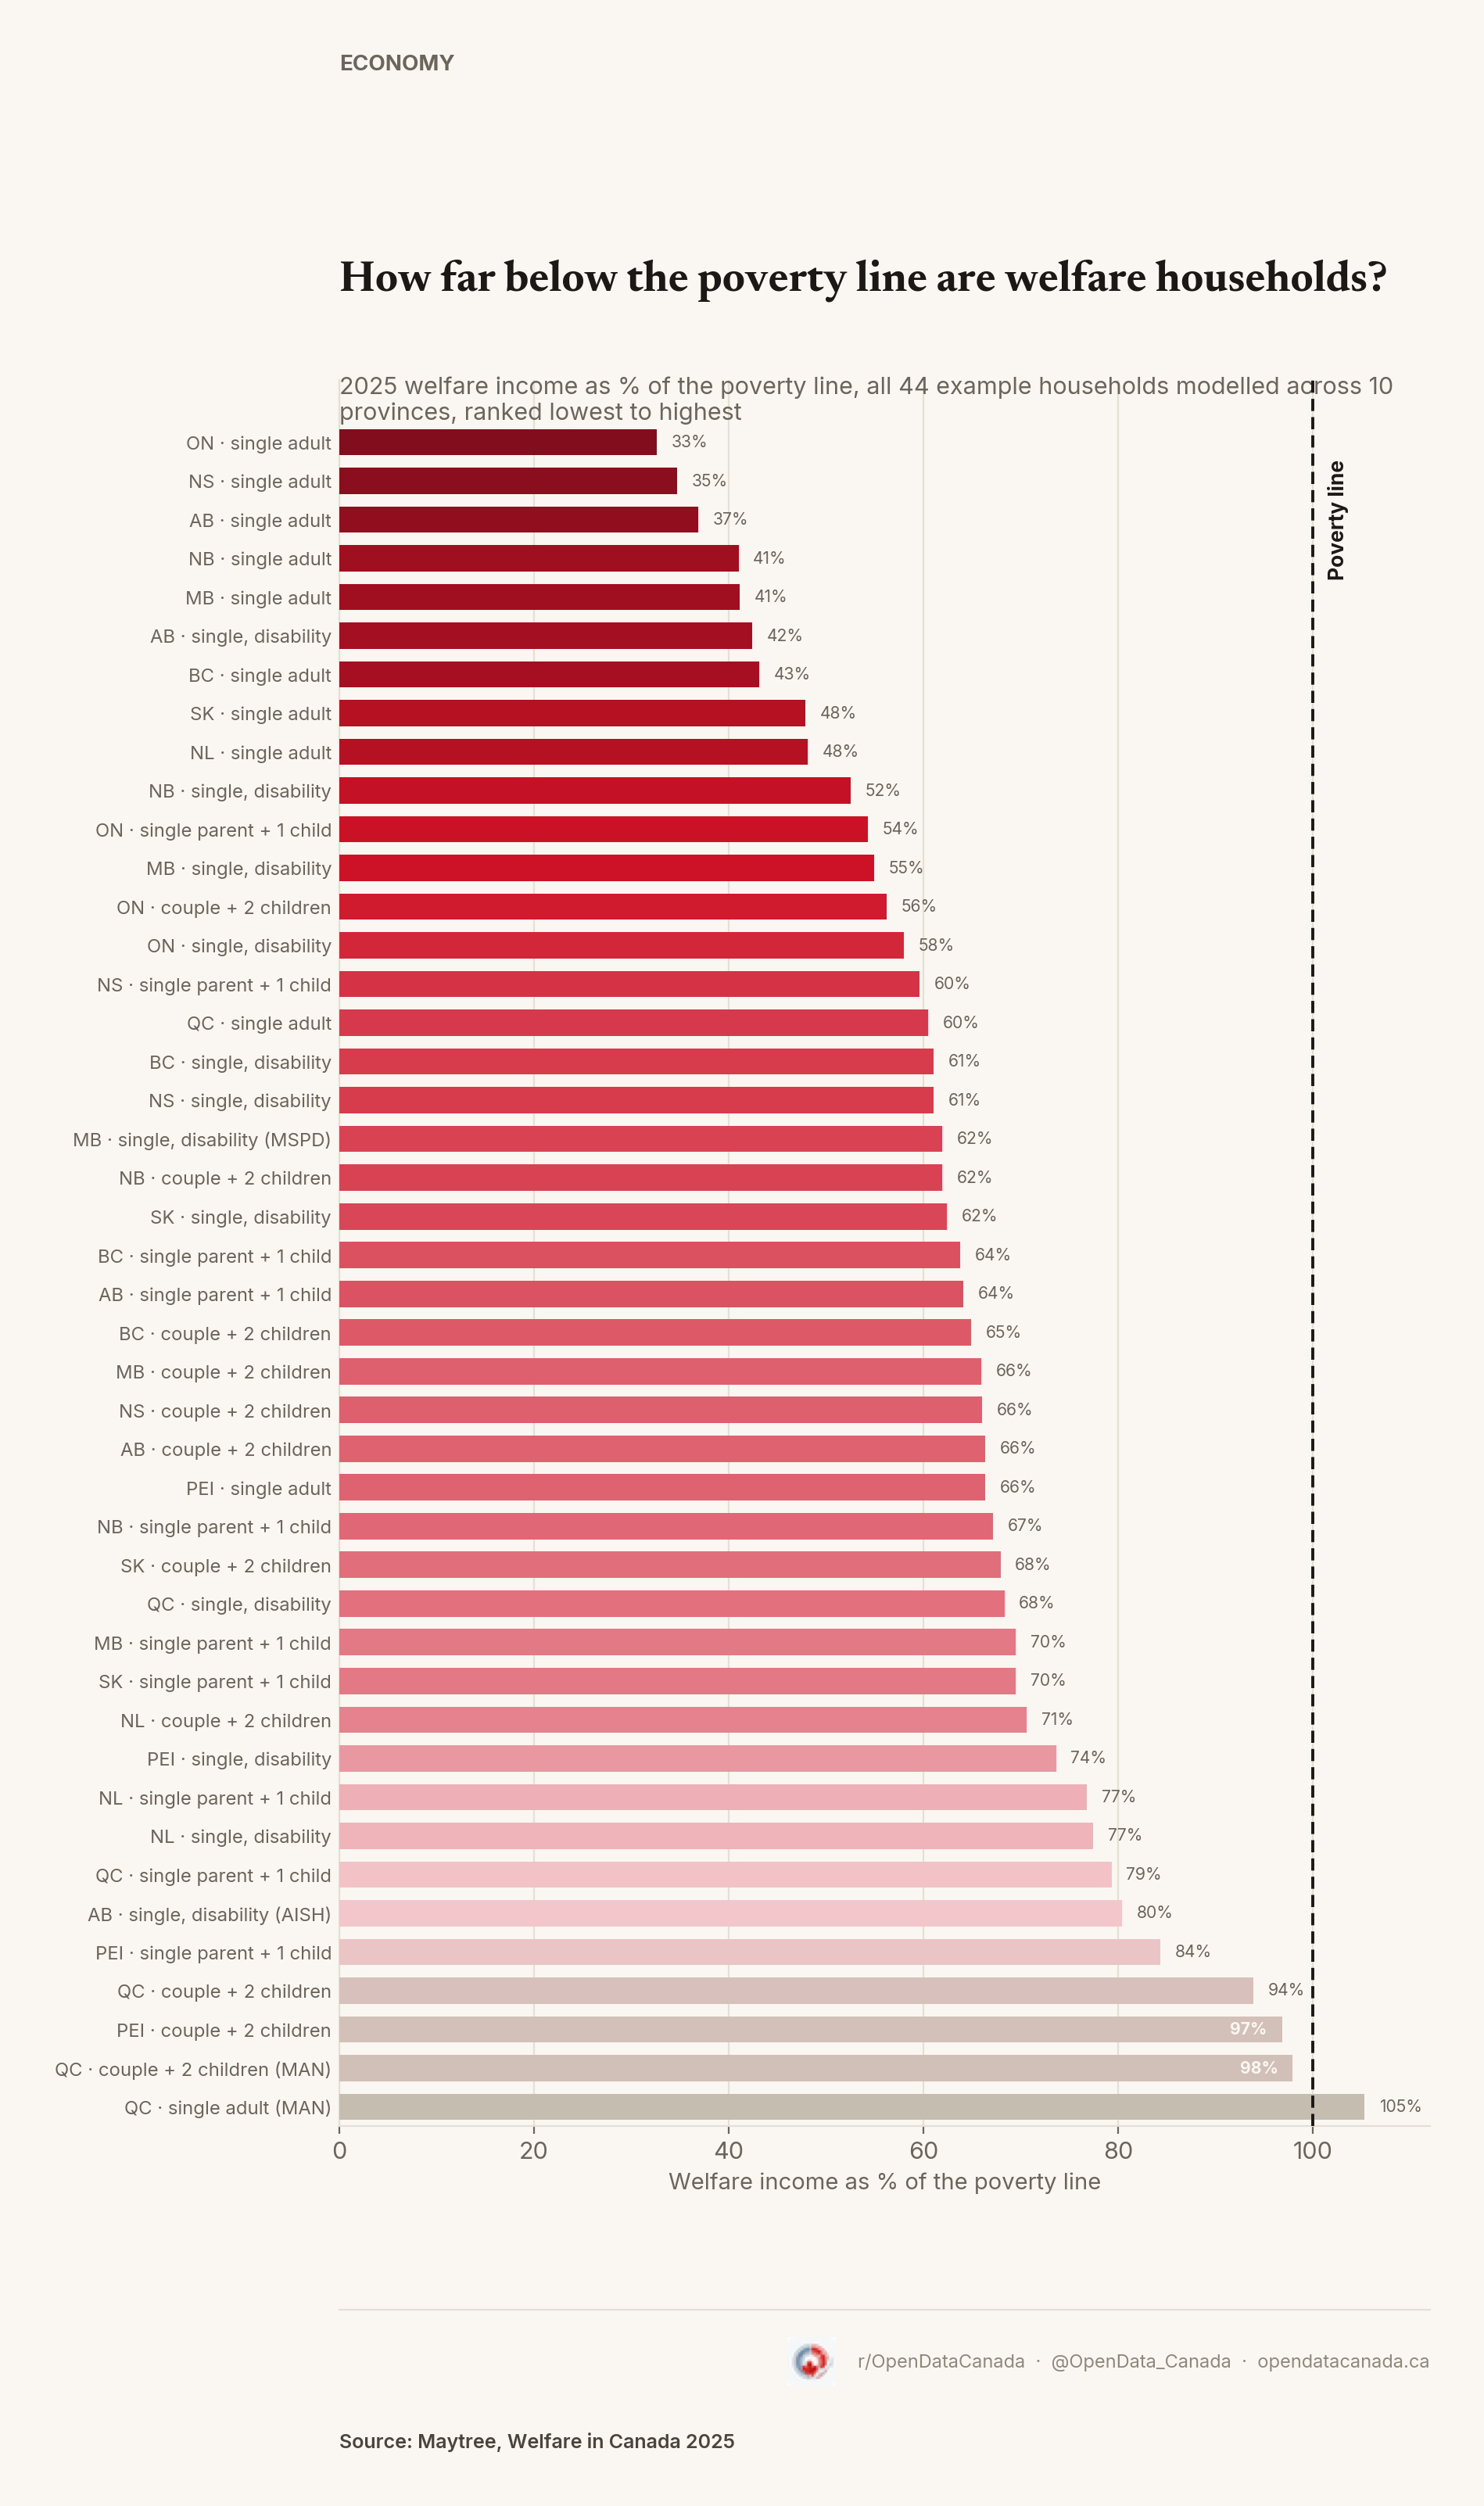
The worst-off group nationally is single, employable adults, on the assumption that this group can and should work its way off assistance. Five of the eleven programs modelled for this group pay 41 percent of the poverty line or less:
- Ontario: 33% of the poverty line, the lowest in Canada
- Nova Scotia: 35%
- Alberta: 37%
- New Brunswick: 41%
- Manitoba: 41%
People with disabilities do somewhat better on average, but the range is enormous. Alberta runs two disability programs side by side: AISH (Assured Income for the Severely Handicapped) pays 80 percent of the poverty line, while the Barriers to Full Employment (BFE) stream, for people whose disability is judged less severe, pays 42 percent. Same province, same poverty line, 38-point gap depending on which category a caseworker puts you in.
Manitoba runs a similar split, but far narrower. Its enhanced Manitoba Supports for Persons with Disabilities (MSPD) program, introduced in 2023, pays 62 percent of the poverty line, against 55 percent under the standard disability rate, a 7-point gap, not Alberta's 38.
Families come closest to the line without crossing it. A couple with two children in Prince Edward Island reached 97 percent in 2025; in Quebec, the AIM and MAN streams reached 94 and 98 percent respectively. Ontario's equivalent household reached only 56 percent, the lowest in the country for that household type.
The line itself moves by province
The poverty line these households are measured against isn't one number. The Market Basket Measure is calculated separately for each province, and it moves with local prices for the same basket of housing, food, transportation, and other basics.
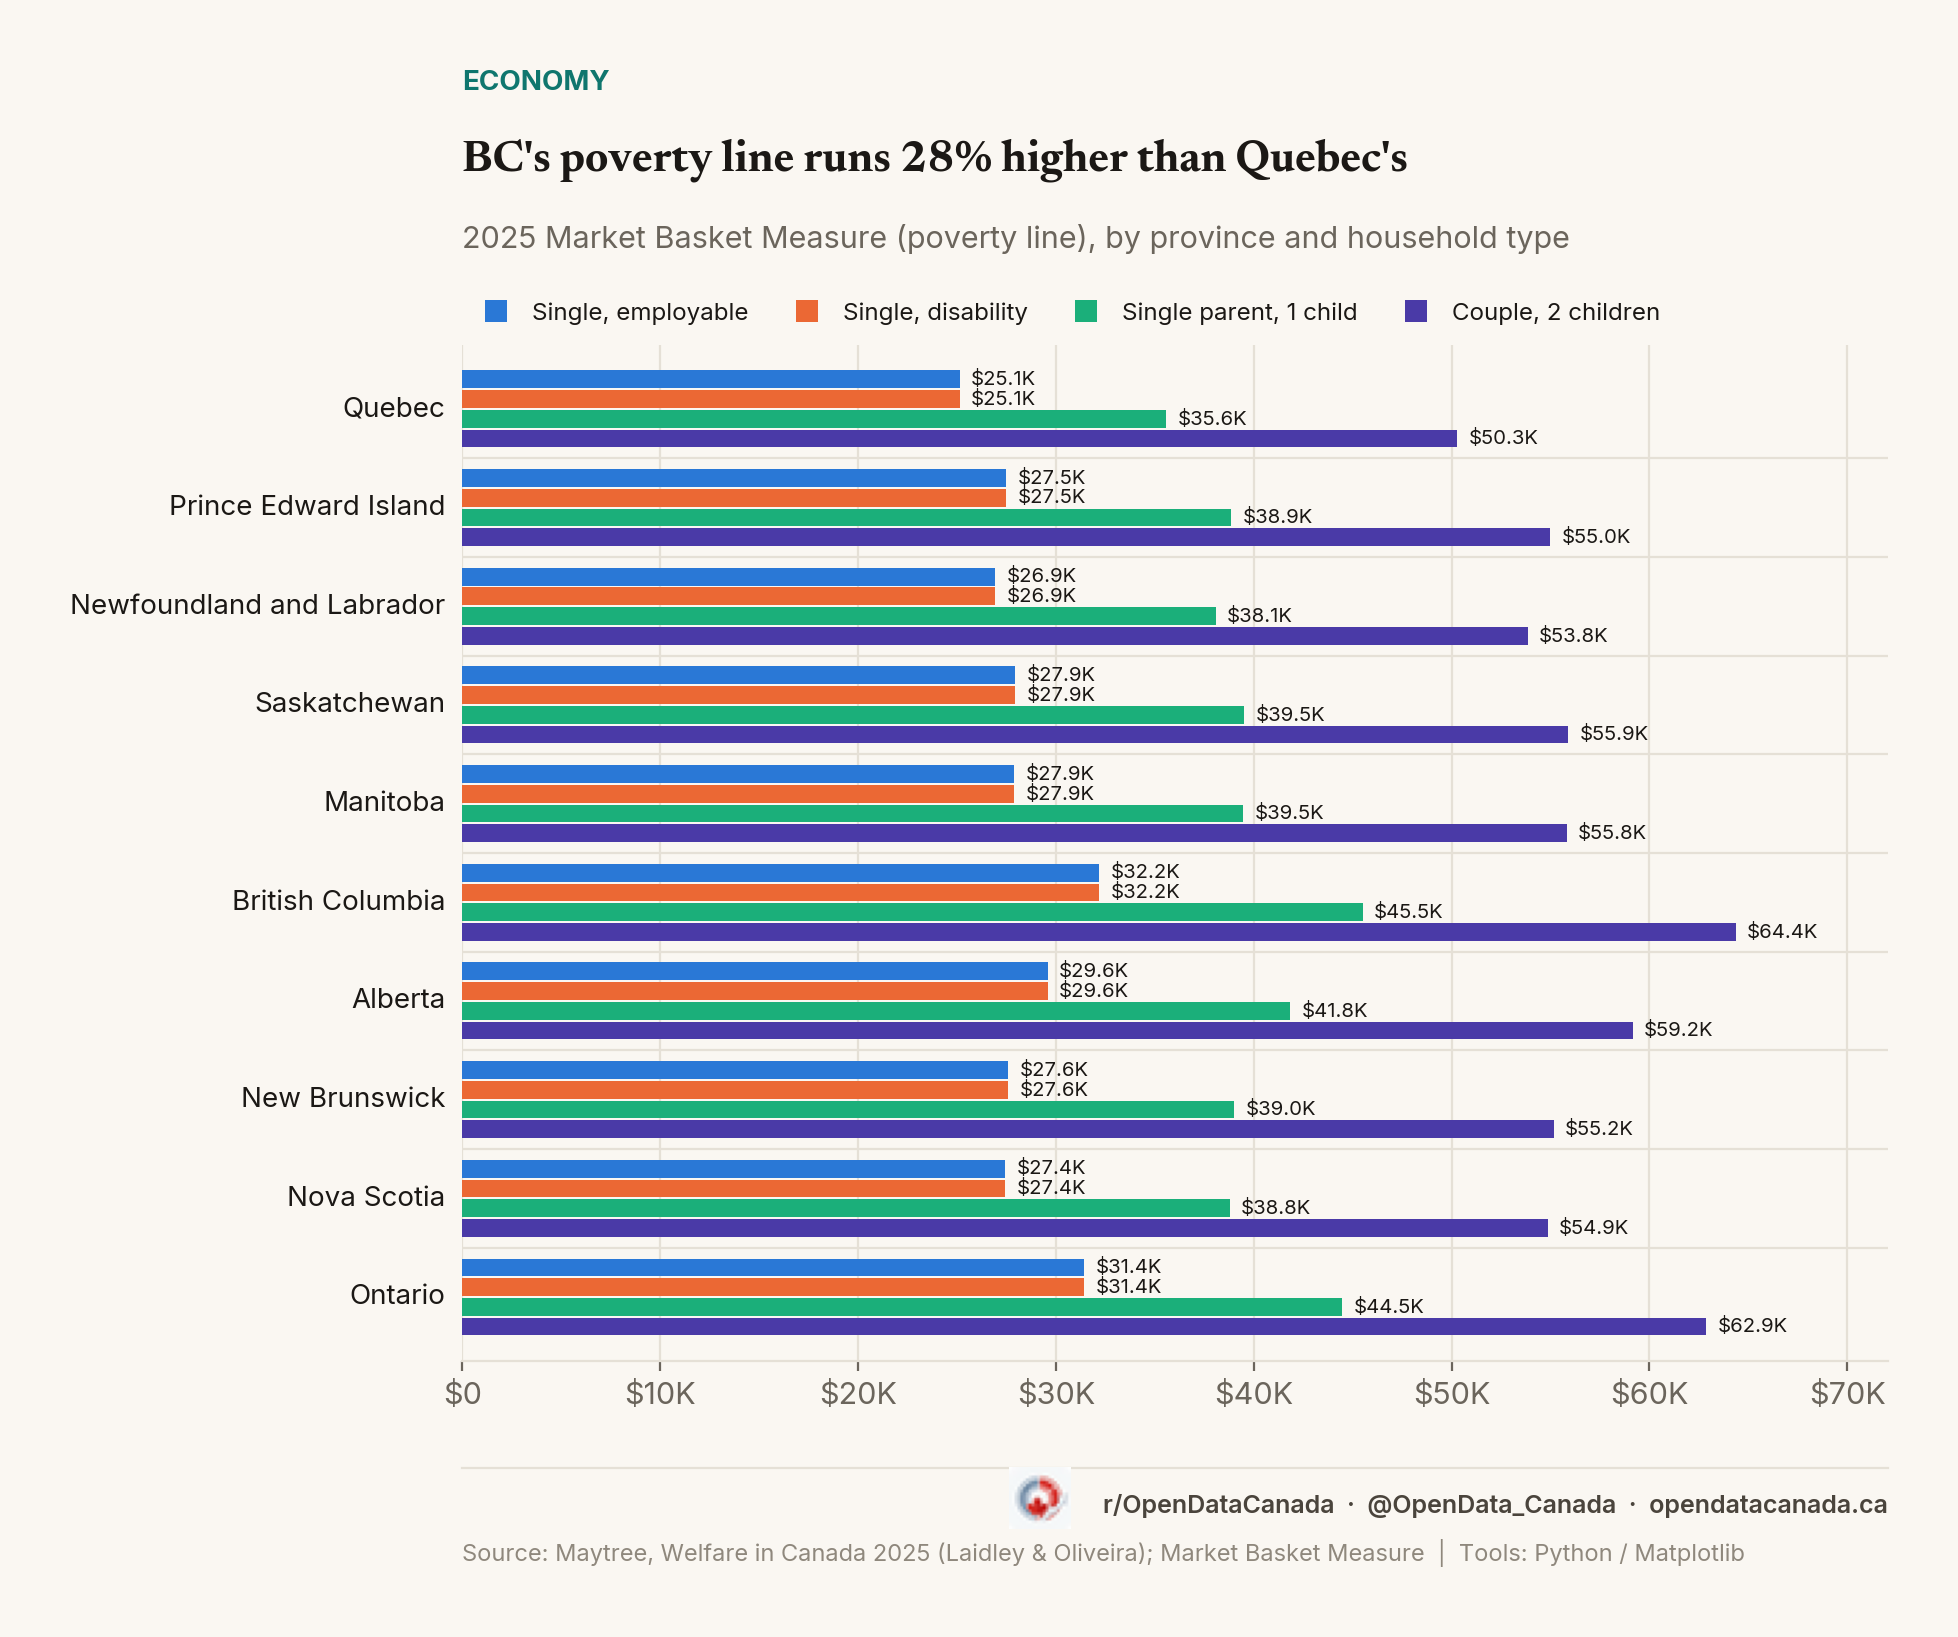
British Columbia has the highest poverty line in the country for every one of the four household types Maytree models, 28 percent higher than Quebec's, which has the lowest, for the exact same households. A single, employable adult needs roughly 28 percent more income in BC than in Quebec just to clear the local cost of the basics.
That gap matters for reading the adequacy numbers above. Quebec's welfare rates aren't just closer to their poverty line by luck. They're being measured against the cheapest basket in the country. As an illustration of how much that regional difference matters, and not a recalculation of Canada's official poverty measure, applying BC's poverty threshold to Quebec's MAN income would put it at roughly 82 percent of the poverty line instead of 105 percent.
Why this matters beyond one report
None of this is new to Maytree, which has published the underlying figures every year since it started this project. What's less visible is how consistent the shortfall is once you look at all 44 numbers side by side rather than one province's headline. This isn't a couple of provinces falling short while most clear the bar. It's the reverse. Adequacy above the poverty line is the anomaly, confined to one program, in one province, for one household type, reaching a sliver of the people who rely on social assistance.
Provincial welfare rates are set by provincial governments, revised (or not) on their own schedule, and are not required to track the cost of living. The Market Basket Measure, by contrast, is recalculated regularly against actual local prices. Because the two are updated on different schedules, their values can diverge substantially over time.