Article · Economy · 5 min read
Canada's Job Market Is Changing Unevenly
Total job vacancies barely moved in the second quarter. But vacancies moved in different directions by education and occupation: down 5.8 percent for positions requiring a bachelor's degree, up 3.8 percent for positions requiring a trade certificate.
Statistics Canada counted 510,200 job vacancies across the country in the second quarter of 2026. That's close to unchanged from a year earlier, and up about 2,500, or 0.5 percent, from the first quarter. The vacancy rate held at 2.8 percent, and nationally there were three unemployed people for every open position.
Split the vacancies by the education employers said the job required, and the picture changes.
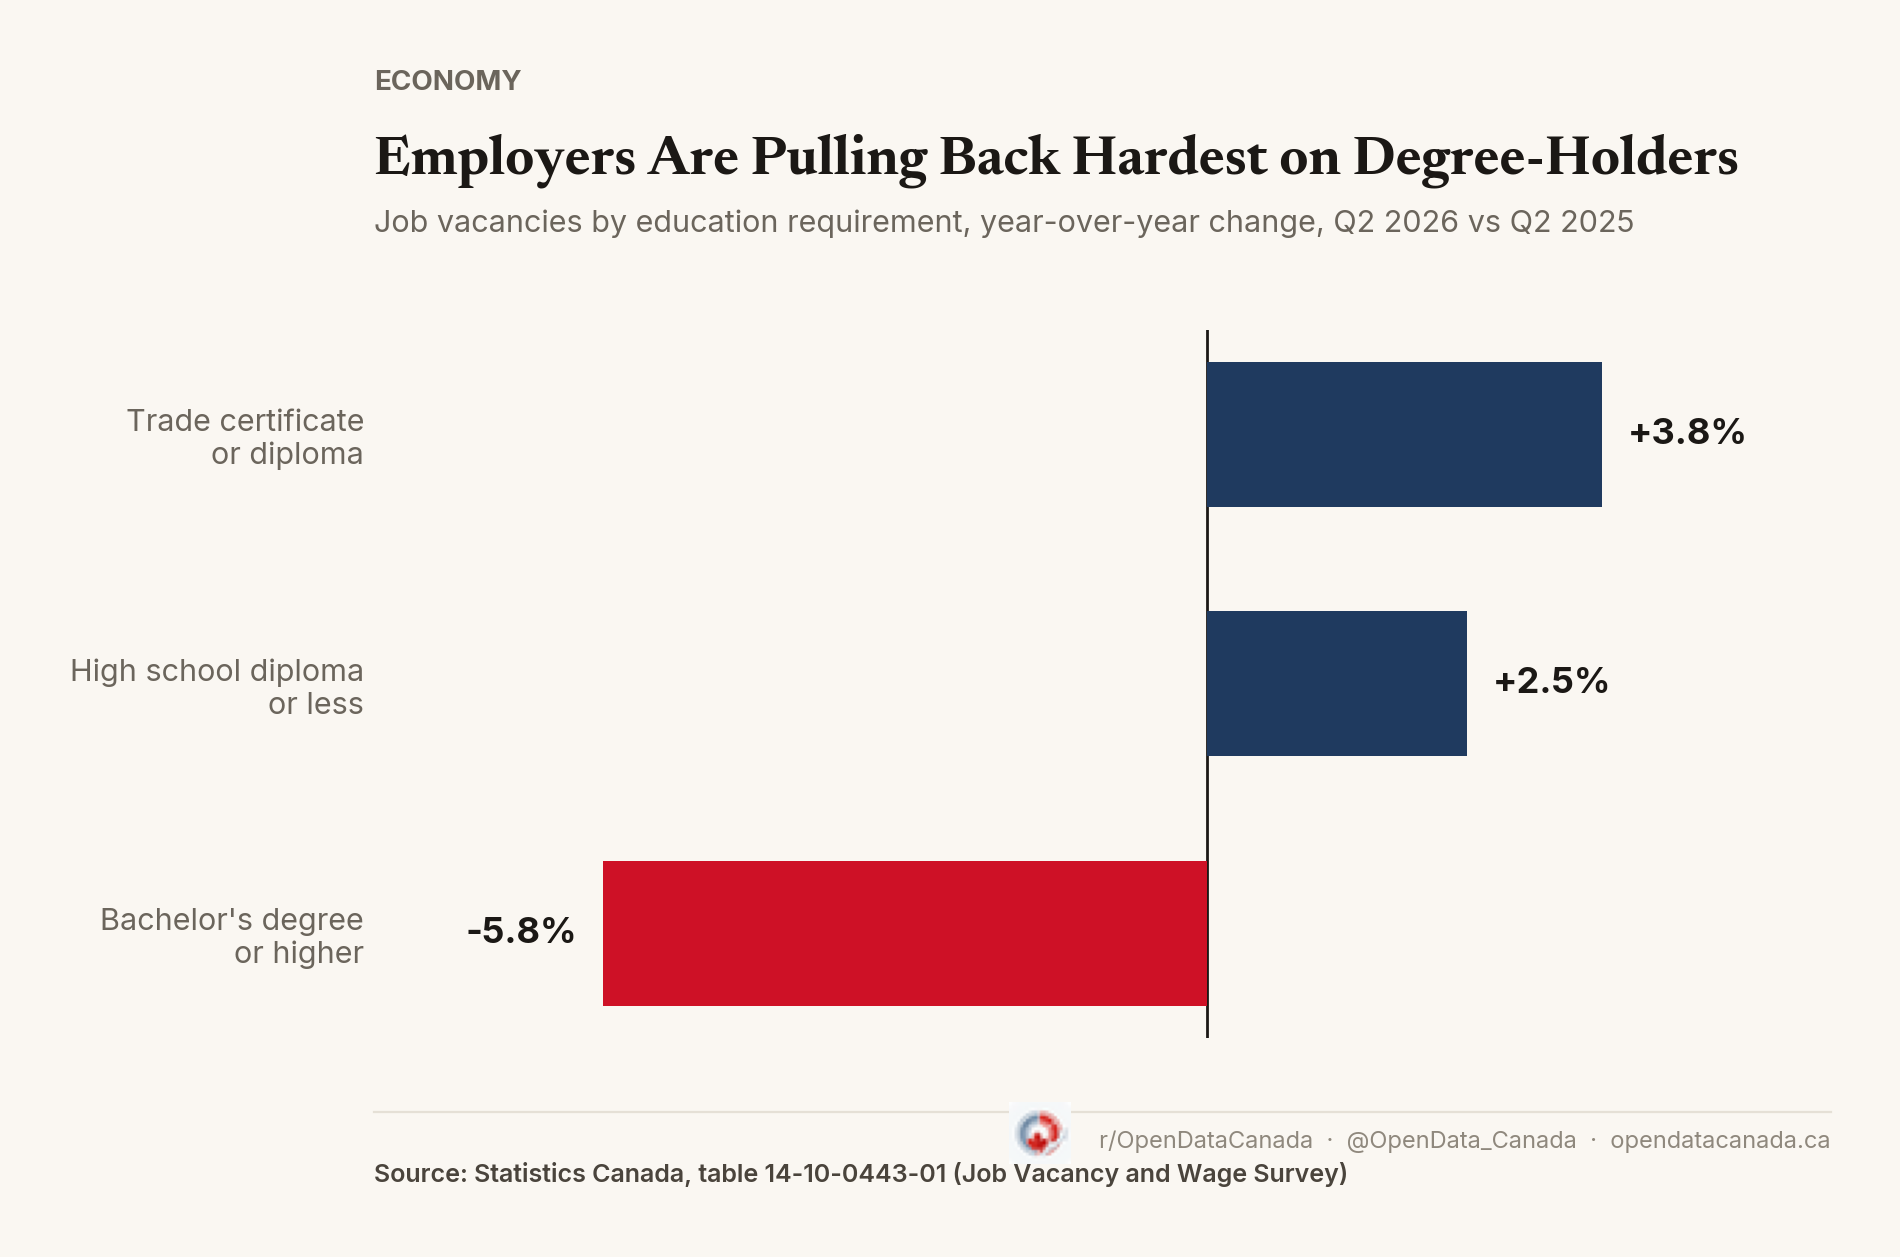
Vacancies requiring a bachelor's degree or higher fell 5.8 percent from a year earlier. Vacancies requiring a trade certificate or diploma rose 3.8 percent. Vacancies requiring high school or less rose 2.5 percent.
The unemployed-to-vacancy ratios were also different. For every open position requiring a trade certificate or diploma, Statistics Canada counted 1.7 unemployed people nationally, the lowest ratio of any education level in the survey. For positions requiring a bachelor's degree or higher, the ratio was 4.9. High-school-or-less positions came in at 2.4. By every measure in this survey — vacancy growth and competition for the jobs that exist — a trade certificate bought more hiring interest this quarter than a bachelor's degree did.
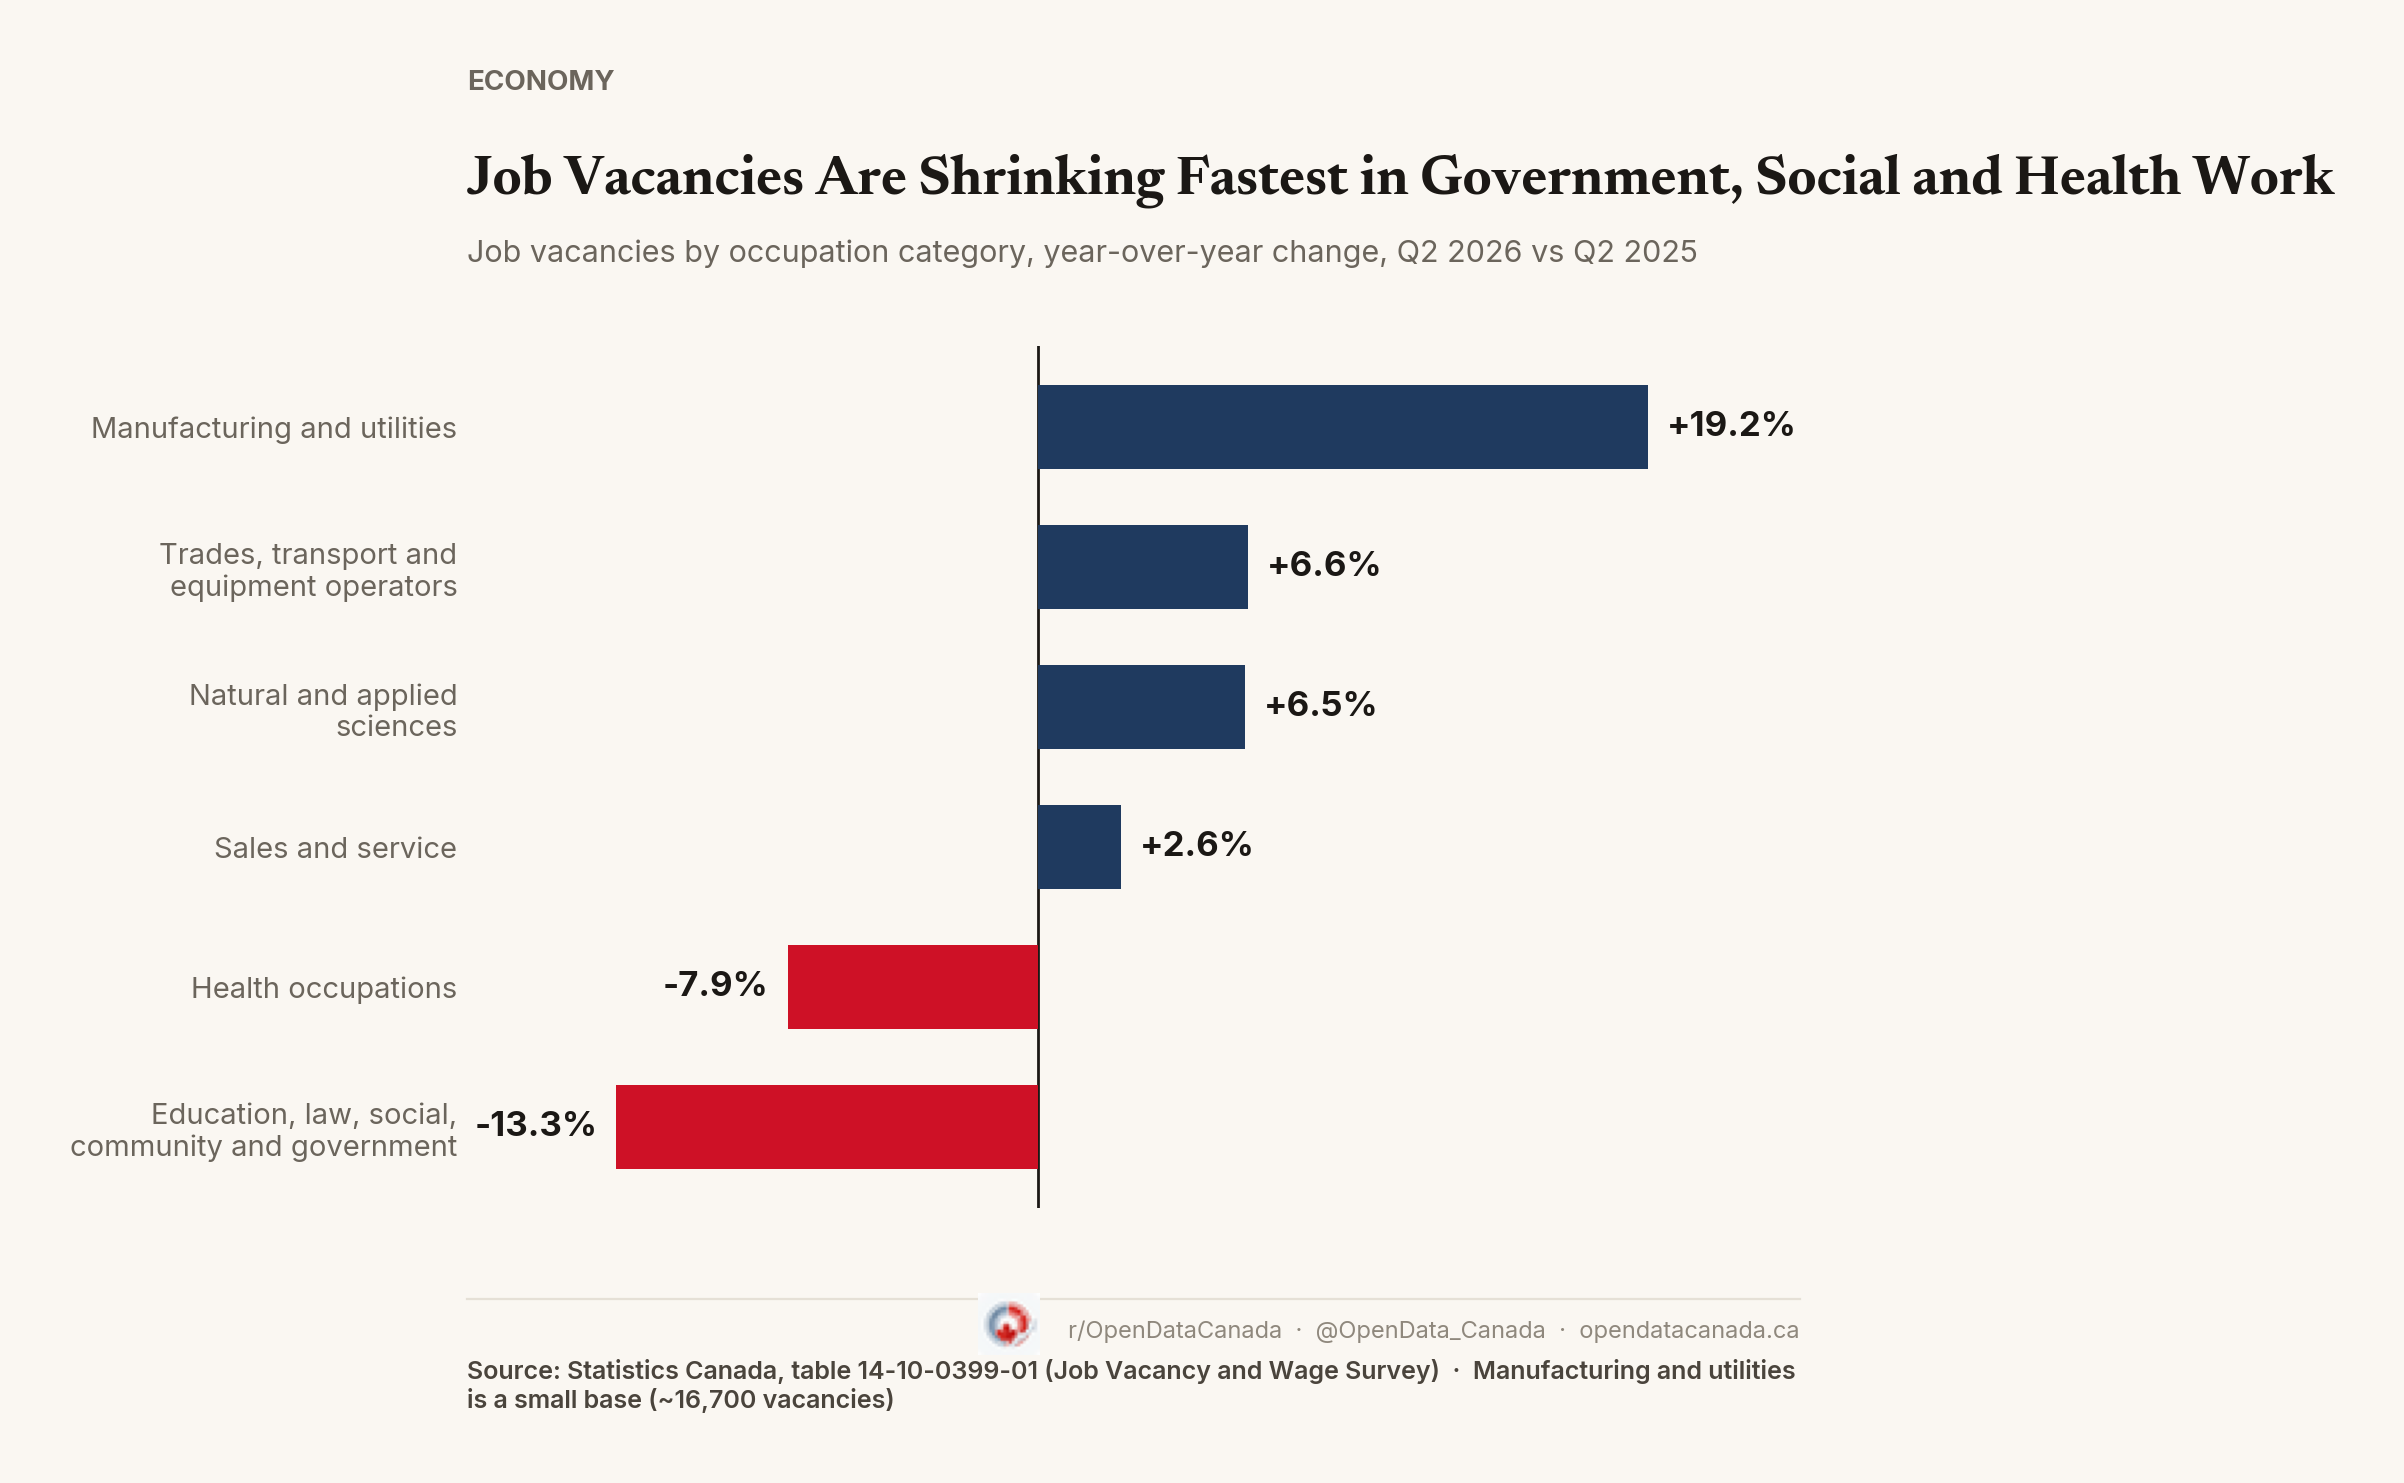
The occupation numbers were uneven as well. Vacancies in education, law and social, community and government services fell 13.3 percent, the largest drop of any major group. Health occupations fell 7.9 percent. Sales and service vacancies rose 2.6 percent. Natural and applied sciences rose 6.5 percent. Trades, transport and equipment operators rose 6.6 percent.
Manufacturing and utilities posted the largest percentage increase, up 19.2 percent. It is also one of the smaller occupational categories in the survey, so relatively small changes in the number of vacancies can produce larger percentage movements.
The average hourly wage offered on vacant positions was $28.55 in the second quarter, up 2.0 percent from a year earlier. The average hourly wage for all employees rose 3.6 percent over the same period, according to the Labour Force Survey.
One quarter of vacancy data doesn't establish a trend on its own, and the broad occupational categories bundle a wide range of jobs under a single heading, so changes within individual occupations can be hidden by the category total. But the divergence shows up in two independent StatCan tables and holds across every angle in this survey: employers' hiring appetite is not tracking the value a university degree is supposed to guarantee.