Budget 2026
Ottawa's own analysis finds $99.5 billion in budget measures favour men
Finance Canada rates the gender impact of every budget measure. Adding up the five-year costs shows $99.5 billion in measures expected to mostly benefit men, against $11.1 billion for women.
Federal budgets include a section that most readers never reach. In Budget 2026 it is Annex 4, the "Impacts report", and it rates each new measure on two scales: whether the people who benefit are mostly men or mostly women, and whether they are mostly high-income or low-income.
The annex rates 249 measures one by one. It does not add up the money behind each rating. Matching 195 of those measures to the budget's five-year cost tables captures 99.8% of the value of all new measures, enough to show how much money sits behind each rating.
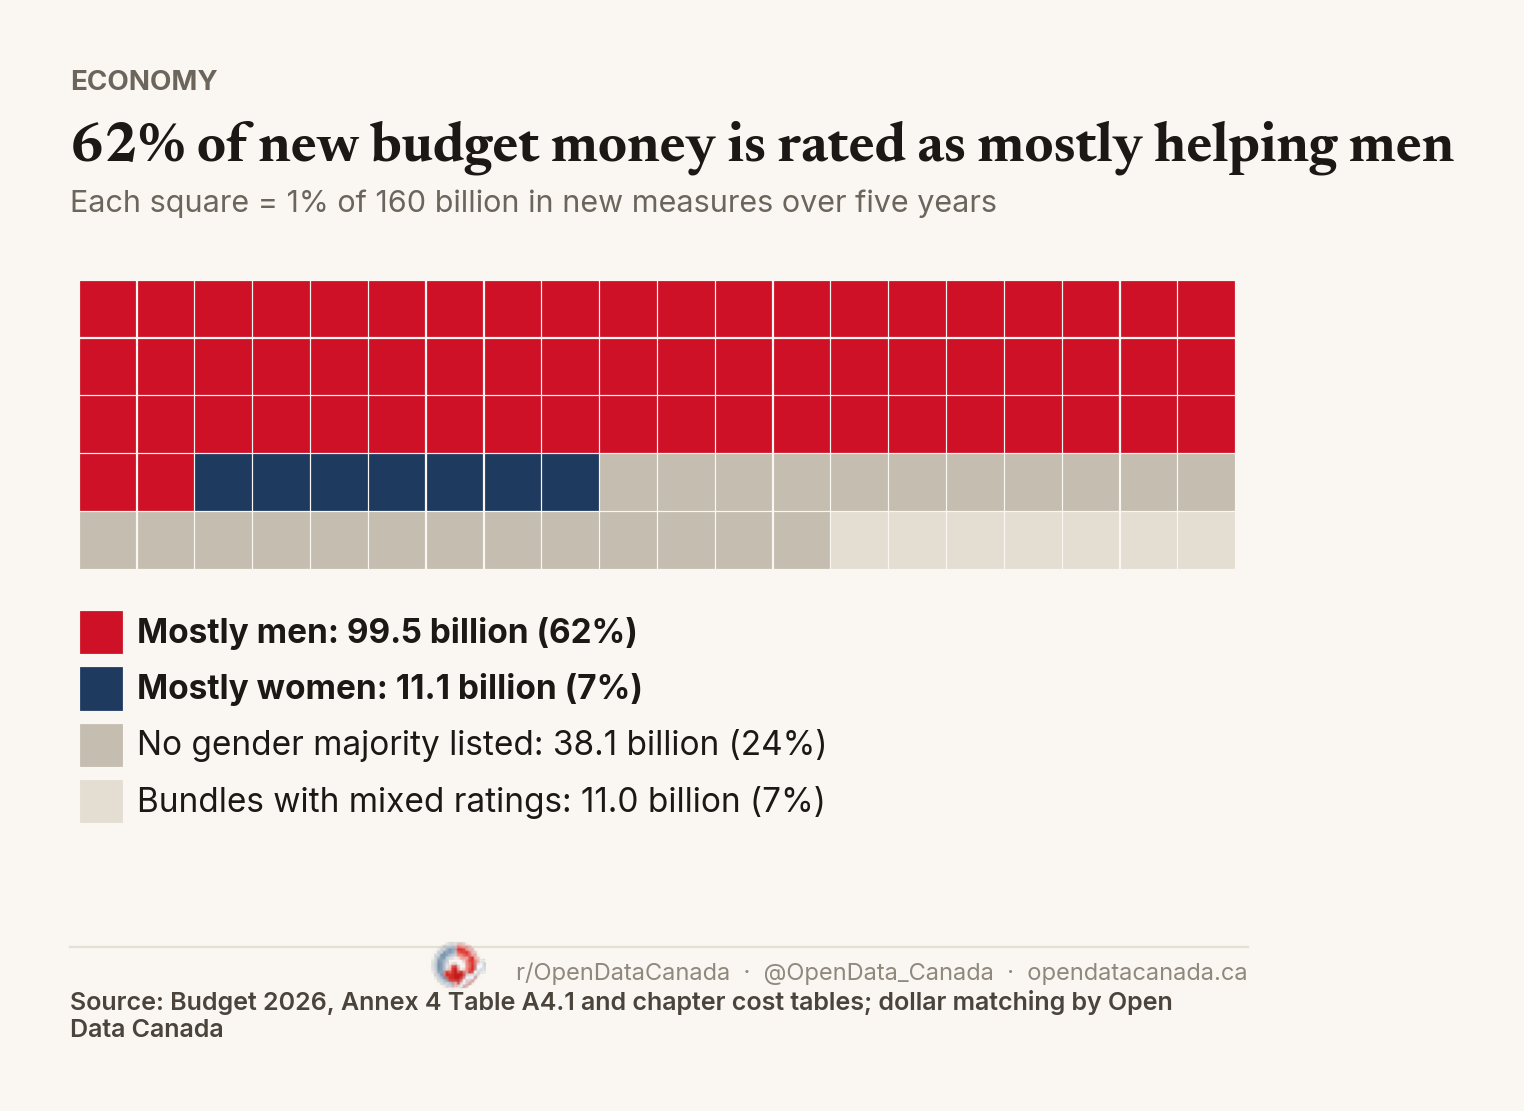
Of the $160 billion in new measures over five years, $99.5 billion, or 62%, goes to measures the government itself says mostly benefit men. Measures it says mostly benefit women get $11.1 billion, or 7%. That is about $9 of measures rated mostly men for every $1 rated mostly women. It is not money paid to men: a "majority men" rating means men are expected to get 60% to 79% of the benefit, and the full cost of the measure is counted in that group.
By count, the gap looks smaller: 72 measures are rated mostly men and 19 mostly women. The difference is size. The measures that lean toward men are the budget's biggest.
One tax break outweighs everything rated for women
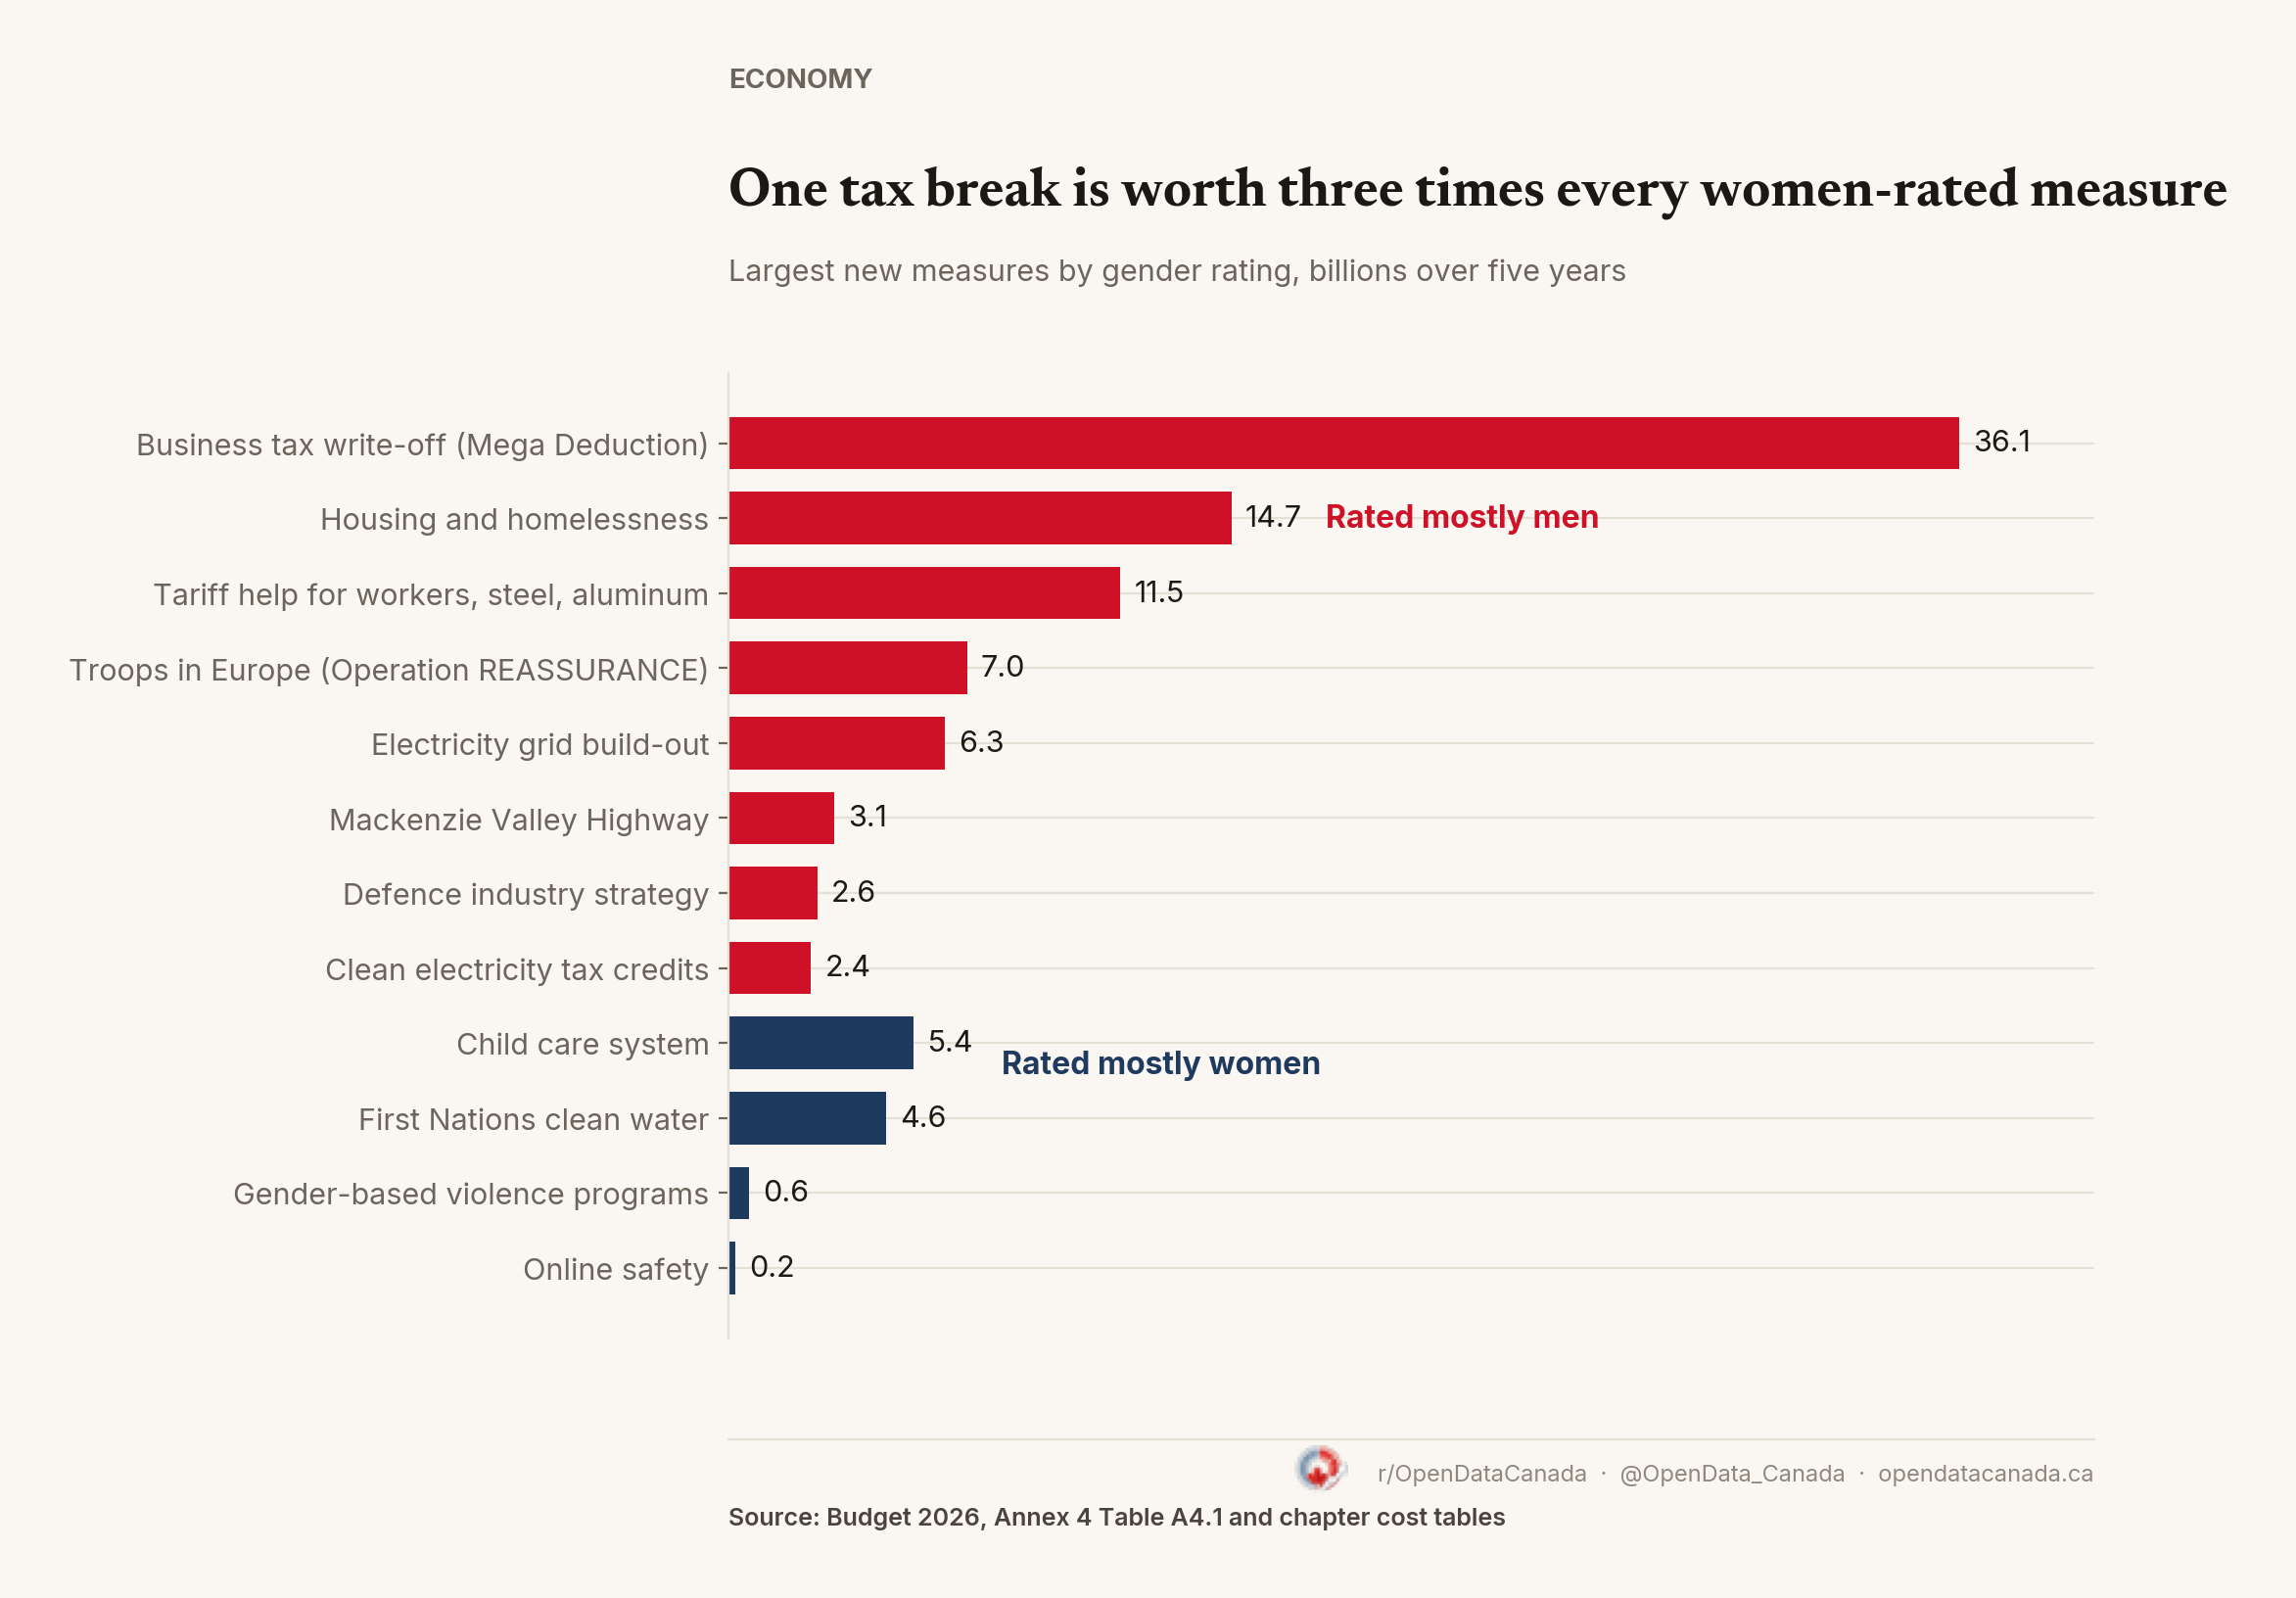
The Productivity Mega Deduction, which lets businesses write off new equipment in the year they buy it, costs $36.1 billion over five years. Annex 4 rates it as mostly benefiting men and higher-income people, and gives the reason plainly: "Owners and shareholders of businesses tend to be men, older, and have higher incomes." (For the rest of the budget, see Budget 2026 explained in 7 charts.)
That one tax break is worth more than three times all the measures rated mostly women combined. Take it out entirely and the gap is still close to 6 to 1.
The largest measure rated mostly women is $5.4 billion in new money to stabilise the national child care system, on top of what Ottawa already spends on it. The annex says it mainly helps mothers and early childhood educators. Next is $4.6 billion for clean water in First Nations communities, rated mostly women because women, Elders and caregivers bear most of the burden when water is unsafe. The rating describes who benefits, not how much a project matters. Three measures are rated as predominantly helping women, meaning 80% or more: $607 million for gender-based violence programs, plus the Menstrual Equity Fund and women's health research, which share a $93 million line with the Women's Program.
Nearly every dollar tilted to the well-off is also tilted to men
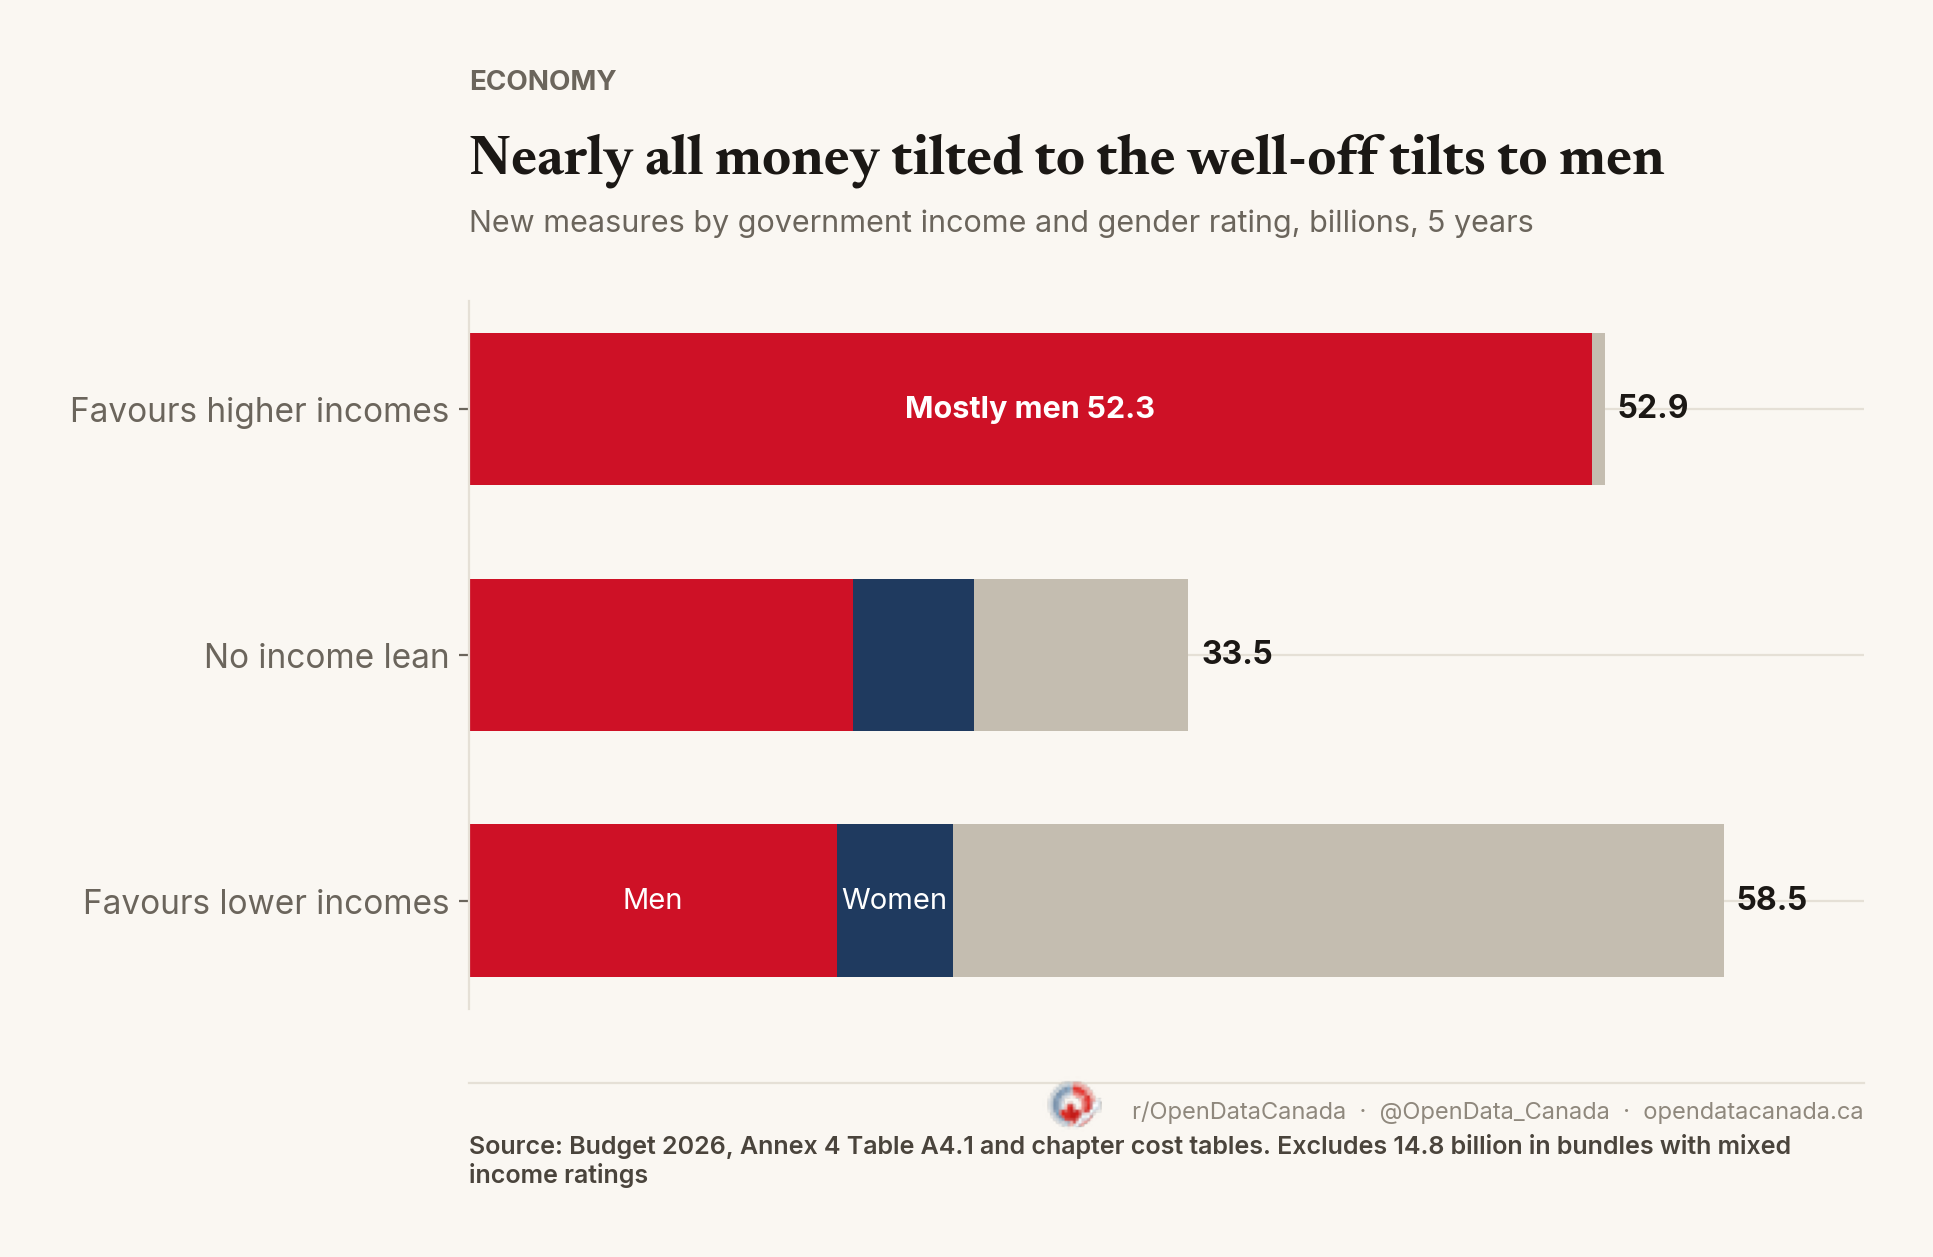
On income, the budget looks balanced. Measures rated as favouring higher-income people total $52.9 billion, and measures favouring lower-income people total $58.5 billion.
The overlap with gender is near total. Of the $52.9 billion tilted toward higher incomes, $52.3 billion, or 99%, is also rated mostly men. None of the 19 measures rated mostly women is rated as favouring higher incomes.
The steepest rating, "strongly regressive", covers just three measures worth $1.6 billion. One is the new capital gains exemption that lets founders and investors shelter up to $15 million in gains. Annex 4 says those who benefit are over 75% men and that nearly 84% would have income above $200,000. Its cost is small at first: $485 million of its $565 million lands in 2030-31, the last year of the plan.
"Men" often means the industries men work in
The men-leaning total is not all tax breaks for owners. Much of it follows the workforce:
- Tariff help for workers and steel, aluminum and copper firms, $11.5 billion. The annex cites Statistics Canada: men are nearly three times as likely as women to work in industries that depend on U.S. demand (13.3% against 4.9%).
- Troops in Europe, $7.0 billion. Women are 16.7% of Canadian Armed Forces members.
- The electricity grid, $6.3 billion. The annex expects the benefit to reach men indirectly, through construction and clean energy jobs.
- Housing and homelessness, $14.7 billion. This one is rated both mostly men and strongly progressive. Men are more likely to be homeless, and more likely to work in construction.
So the 62% partly reflects what this budget chose to spend on: tariffs, defence, energy and building. Those are sectors where most workers are men. A budget built around child care or health care would rate the other way.
The ratings are Finance Canada's own, and they are estimates of who benefits, not counts of who receives a cheque. The annex says only about half of measures had this analysis done at the early stage, when it could still shape the design. For the rest, the rating describes a decision already made.
What the totals show is a budget whose biggest bets go to business owners and industries where men hold most of the jobs, and the government's own analysis says so.