Economy · Live monthly · 4 min read
Vegetable oil is up 138% since 2020 — what got more expensive in Canada in June 2026
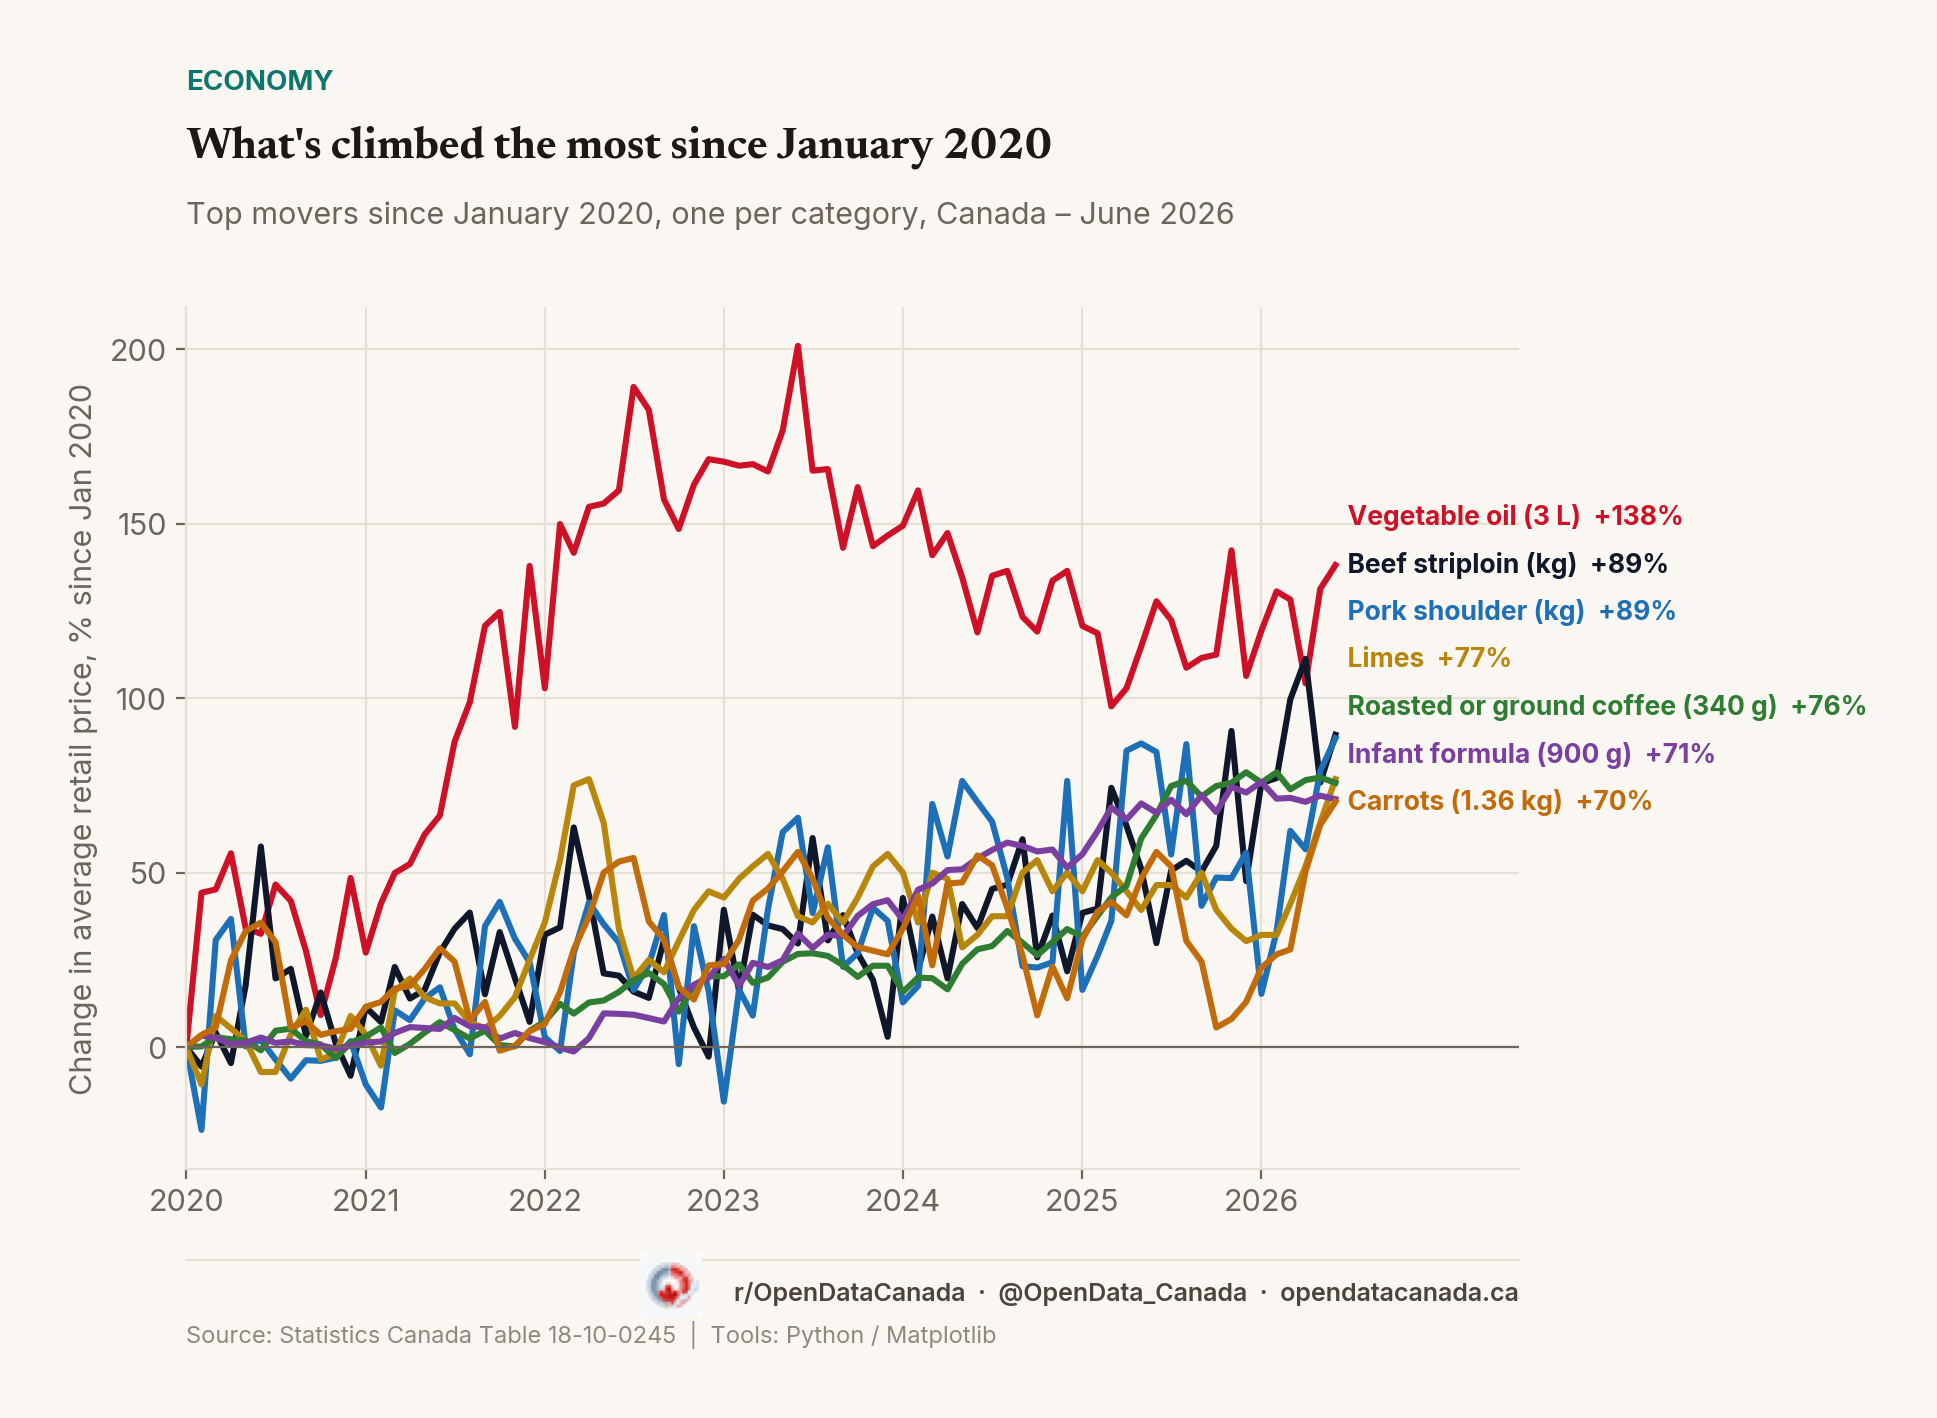
Vegetable oil has climbed 138% since January 2020, the steepest sustained increase among items StatCan tracks, and now averages $10.12 a litre. Beef striploin is up 89.5% over that same stretch and 46% in the past year alone, reaching $38.05. Month to month, cantaloupe jumped 25.1% to $3.84 in June even as broccoli and tomatoes both got cheaper. The swings show how uneven grocery inflation remains from one item to the next.
Published 2026-08-05 · Open Data Canada
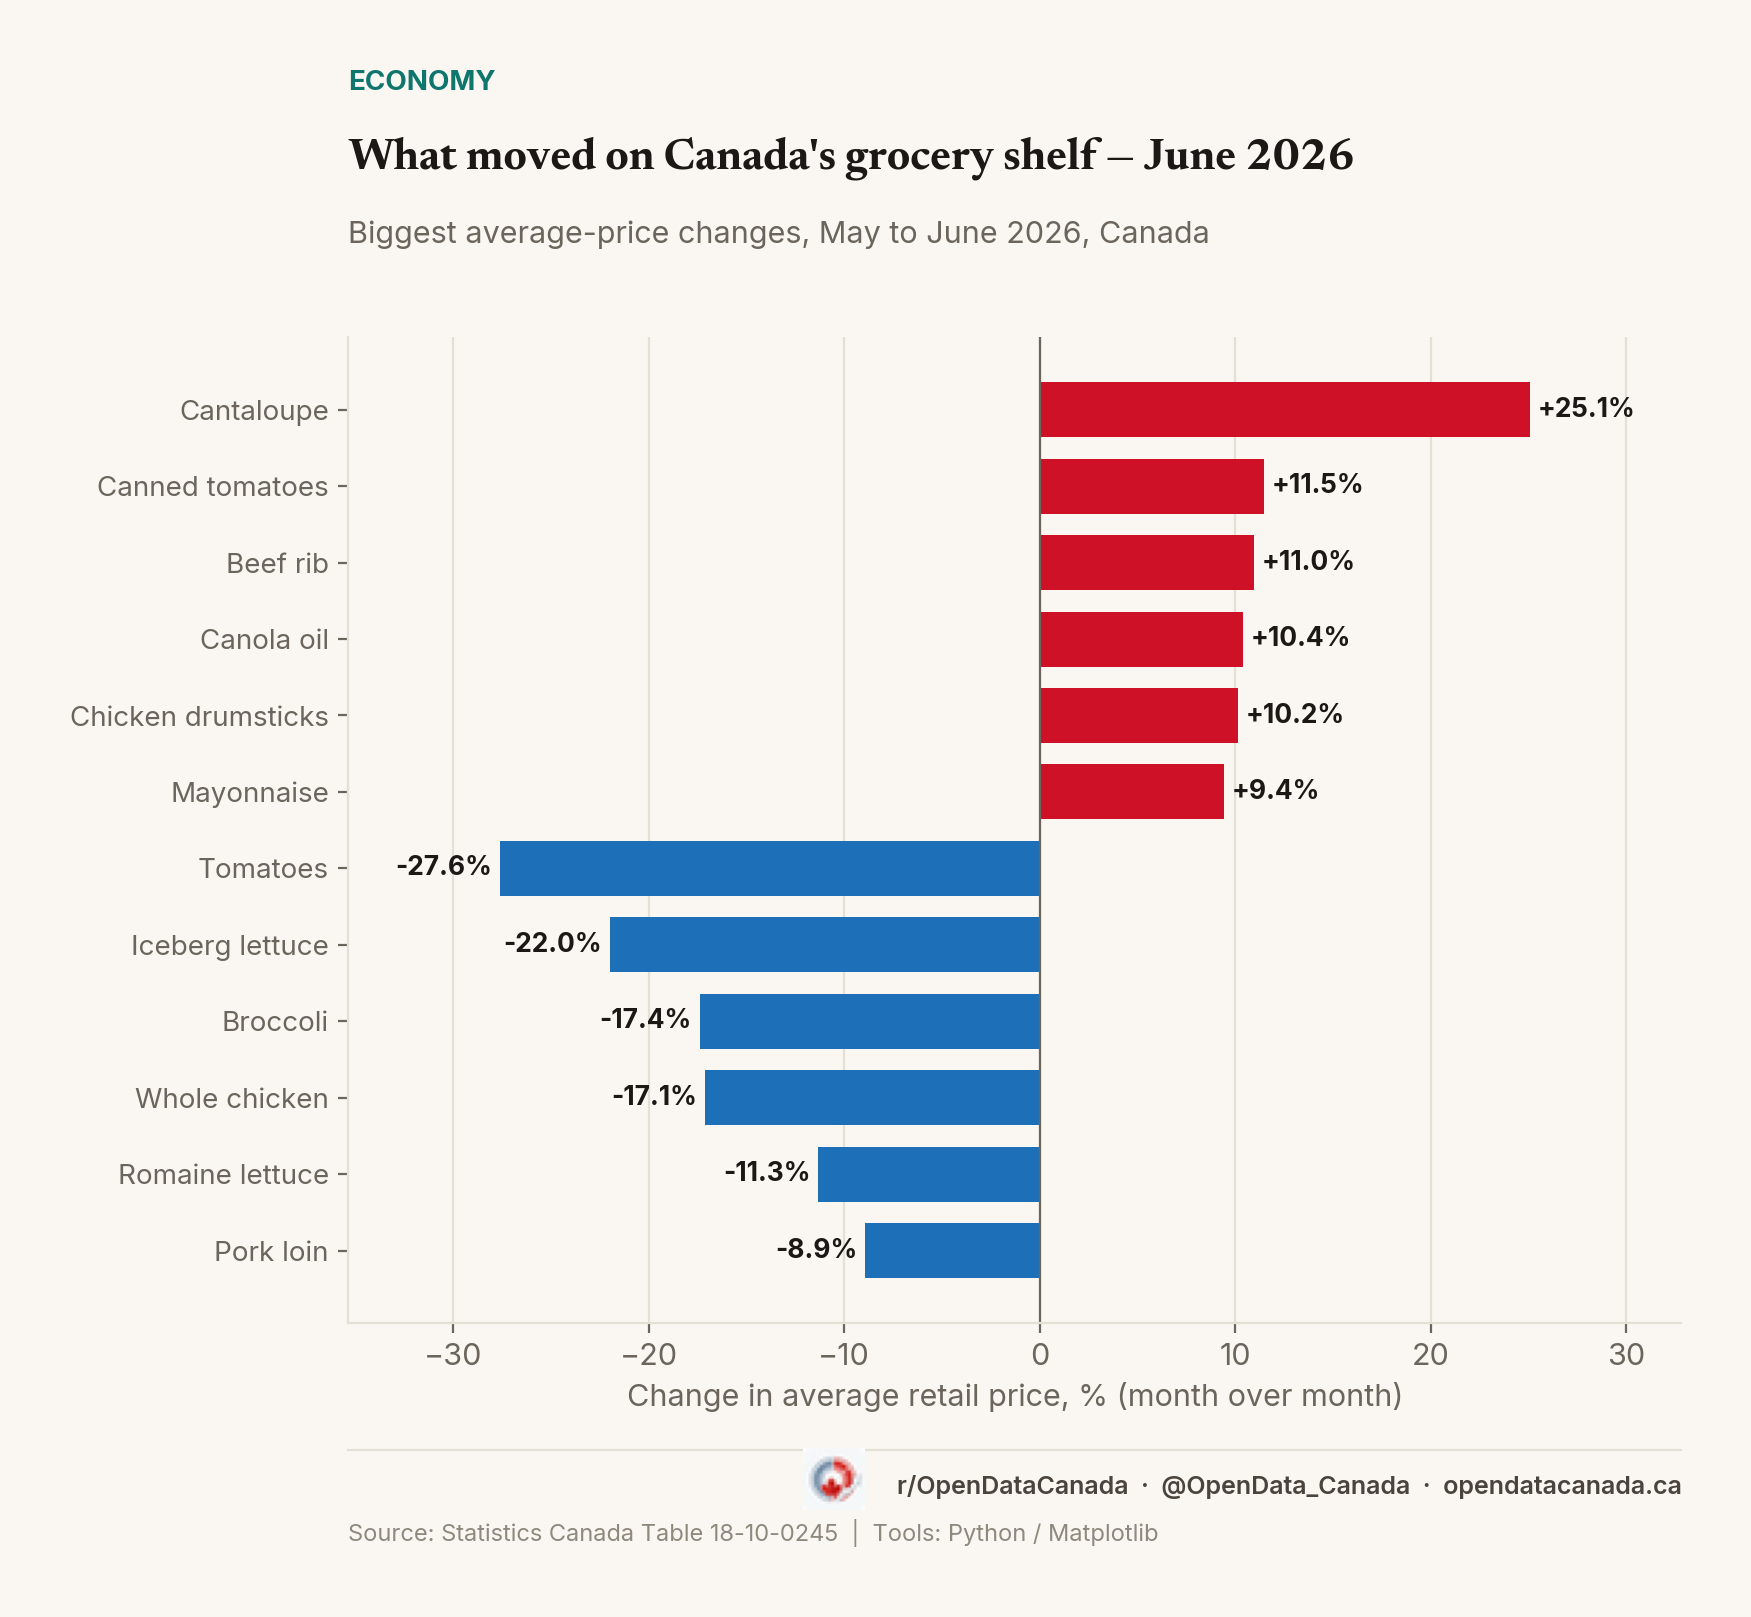
| Item | Price | MoM |
|---|
| Cantaloupe | $3.84 | +25.1% |
| Canned tomatoes | $2.33 | +11.5% |
| Beef rib | $34.55 | +11.0% |
| Canola oil | $10.85 | +10.4% |
| Chicken drumsticks | $8.03 | +10.2% |
| Mayonnaise | $6.27 | +9.4% |
| Pork rib | $10.04 | +9.1% |
| Sweet potatoes | $4.65 | +8.4% |
| Item | Price | MoM |
|---|
| Tomatoes | $5.03 | -27.6% |
| Iceberg lettuce | $3.19 | -22.0% |
| Broccoli | $2.80 | -17.4% |
| Whole chicken | $7.06 | -17.1% |
| Romaine lettuce | $3.76 | -11.3% |
| Item | Price | YoY |
|---|
| Beef striploin | $38.05 | +46.0% |
| Cantaloupe | $3.84 | +21.5% |
| Strawberries | $4.08 | +21.4% |
| Limes | $0.99 | +20.7% |
| Romaine lettuce | $3.76 | +18.6% |
| Celery | $3.78 | +17.8% |
| Chicken thigh | $13.45 | +17.7% |
| Iceberg lettuce | $3.19 | +16.8% |
| Item | Price | since 2020 |
|---|
| Vegetable oil | $10.12 | +138.1% |
| Beef striploin | $38.05 | +89.5% |
| Pork shoulder | $10.01 | +88.5% |
| Beef top sirloin | $27.94 | +82.7% |
| Beef stewing | $25.31 | +82.0% |
| Limes | $0.99 | +76.8% |
| Roasted or ground coffee | $9.35 | +75.8% |
| Ground beef | $16.61 | +73.7% |
Show the full ranking — all 110 items tracked, since January 2020
| Item | Price | since 2020 |
|---|
| Vegetable oil | $10.12 | +138.1% |
| Beef striploin | $38.05 | +89.5% |
| Pork shoulder | $10.01 | +88.5% |
| Beef top sirloin | $27.94 | +82.7% |
| Beef stewing | $25.31 | +82.0% |
| Limes | $0.99 | +76.8% |
| Roasted or ground coffee | $9.35 | +75.8% |
| Ground beef | $16.61 | +73.7% |
| Infant formula | $49.94 | +71.0% |
| Carrots | $4.87 | +70.3% |
| Canned tomatoes | $2.33 | +67.6% |
| Canola oil | $10.85 | +62.9% |
| Orange juice | $6.09 | +62.8% |
| Pasta sauce | $3.47 | +60.6% |
| Deodorant | $8.17 | +57.4% |
| Toothpaste | $4.58 | +53.7% |
| Apple juice | $4.28 | +51.8% |
| Salsa | $4.93 | +51.2% |
| Olive oil | $11.79 | +51.0% |
| Beef rib | $34.55 | +50.1% |
| Grapes | $9.02 | +49.6% |
| Apples | $6.33 | +47.9% |
| Frozen french fried potatoes | $3.38 | +47.0% |
| Yogurt | $3.86 | +46.8% |
| Canned baked beans | $1.72 | +44.5% |
| Meatless burgers | $7.03 | +44.4% |
| Dry or fresh pasta | $3.39 | +44.3% |
| Butter | $5.94 | +43.1% |
| Cantaloupe | $3.84 | +41.7% |
| Canned beans and lentils | $1.74 | +41.5% |
| Eggs | $4.88 | +41.4% |
| Onions | $4.86 | +41.3% |
| Margarine | $6.14 | +40.8% |
| Frozen green beans | $4.70 | +39.9% |
| Mayonnaise | $6.27 | +39.6% |
| Ketchup | $4.62 | +38.7% |
| Salad dressing | $3.47 | +38.2% |
| Frozen broccoli | $4.10 | +37.6% |
| Canned pear | $3.01 | +37.4% |
| Pears | $5.74 | +37.3% |
| Shampoo | $7.36 | +37.1% |
| Chicken thigh | $13.45 | +36.4% |
| Onions | $5.44 | +36.0% |
| Cereal | $4.20 | +35.9% |
| Canned corn | $1.63 | +35.8% |
| Chicken drumsticks | $8.03 | +35.4% |
| Lemons | $1.12 | +34.9% |
| Frozen mixed vegetables | $4.28 | +34.6% |
| Potatoes | $5.18 | +34.5% |
| Oranges | $4.73 | +34.4% |
| Tea (20 bags) | $4.61 | +34.0% |
| Cookies and sweet biscuits | $3.47 | +34.0% |
| Milk | $7.03 | +33.7% |
| Celery | $3.78 | +33.6% |
| Tofu | $2.92 | +32.7% |
| Peanuts | $4.34 | +32.7% |
| Oranges | $5.50 | +32.5% |
| Peanut butter | $6.12 | +32.2% |
| Cream | $4.89 | +31.8% |
| Milk | $5.50 | +30.6% |
| Frozen corn | $3.89 | +30.5% |
| Whole chicken | $7.06 | +28.4% |
| Frozen strawberries | $5.40 | +28.3% |
| Frozen peas | $3.85 | +27.9% |
| Milk | $3.21 | +27.9% |
| Frozen spinach | $2.10 | +27.3% |
| Romaine lettuce | $3.76 | +27.0% |
| Sweet potatoes | $4.65 | +26.7% |
| White sugar | $2.87 | +26.4% |
| Cabbage | $2.87 | +25.9% |
| Brown rice | $5.78 | +25.7% |
| Iceberg lettuce | $3.19 | +25.6% |
| Canned salmon | $5.56 | +25.5% |
| Sunflower seeds | $5.07 | +25.2% |
| White bread | $3.61 | +23.2% |
| Chicken breasts | $14.63 | +22.8% |
| Frozen pizza | $4.78 | +21.9% |
| Crackers and crisp breads | $2.89 | +21.4% |
| Block cheese | $7.03 | +19.8% |
| Wieners | $4.01 | +19.7% |
| Flatbread and pita | $3.50 | +19.0% |
| Canned soup | $1.39 | +18.8% |
| Mushrooms | $2.28 | +18.1% |
| Dry beans and legumes | $3.55 | +17.5% |
| Bananas | $1.87 | +16.9% |
| Broccoli | $2.80 | +16.7% |
| Squash | $4.88 | +16.5% |
| Potatoes | $5.54 | +16.4% |
| White rice | $9.46 | +16.2% |
| Salmon | $27.92 | +15.9% |
| Bacon | $6.67 | +15.2% |
| Nut milk | $4.38 | +14.7% |
| Canned peach | $2.51 | +14.6% |
| Baby food | $1.51 | +14.4% |
| Wheat flour | $5.32 | +13.9% |
| Soy milk | $4.35 | +13.3% |
| Pork rib | $10.04 | +12.9% |
| Avocado | $1.95 | +12.1% |
| Salad greens | $4.52 | +11.9% |
| Pork loin | $8.87 | +11.6% |
| Hummus | $3.74 | +11.3% |
| Dried lentils | $3.60 | +9.1% |
| Laundry detergent | $13.59 | +7.9% |
| Shrimp | $7.69 | +7.7% |
| Almonds | $5.58 | +6.3% |
| Peppers | $7.59 | +2.7% |
| Canned tuna | $1.64 | +1.2% |
| Strawberries | $4.08 | -9.5% |
| Tomatoes | $5.03 | -24.9% |
| Cucumber | $1.28 | -34.0% |
Methodology. Figures are monthly average retail prices for Canada from Statistics Canada Table 18-10-0245 (Monthly average retail prices for selected products), built from retailer transaction data and covering about 110 grocery and household items. Month-over-month compares May 2026 with June 2026; year-over-year compares the same month a year earlier; "since 2020" indexes January 2020 to the latest available month. Prices are national averages and will differ by store and province. Fresh produce (carrots, cantaloupe, citrus, etc.) has large seasonal price swings within every year, so its "since 2020" figure partly reflects which two months are being compared, not just a steady long-term rise — the historical trend chart above plots every month in between and shows that seasonal pattern directly. This page is regenerated automatically each month when Statistics Canada releases new data.