Article · Transit · 4 min read
New Brunswick Has Canada's Highest Road Fatality Rate — But the Ranking Changes When You Count Driving
New Brunswick had Canada's highest road fatality rate in 2023, 8.5 deaths per 100,000 people, more than double Ontario's 3.9. Switch to fatalities per kilometre actually driven and Atlantic Canada is still worst, but the order inside it shifts, and a couple of provinces move a lot: Alberta looks mid-table by population and drops close to the national average once its driving distances are counted. Nova Scotia moves the same way.
New Brunswick recorded 8.5 road deaths per 100,000 residents in 2023. That's the highest of any province, more than double Ontario's 3.9, the lowest in the country. The national rate is 4.9. Atlantic Canada owns the high end of this list: P.E.I. (8.1) and Newfoundland and Labrador (7.8) rank second and fourth, with Saskatchewan (7.6) squeezed between them. Quebec (4.3) sits just above Ontario at the low end. Nova Scotia (5.3) is the one Atlantic province that breaks the pattern, closer to the middle of the pack.
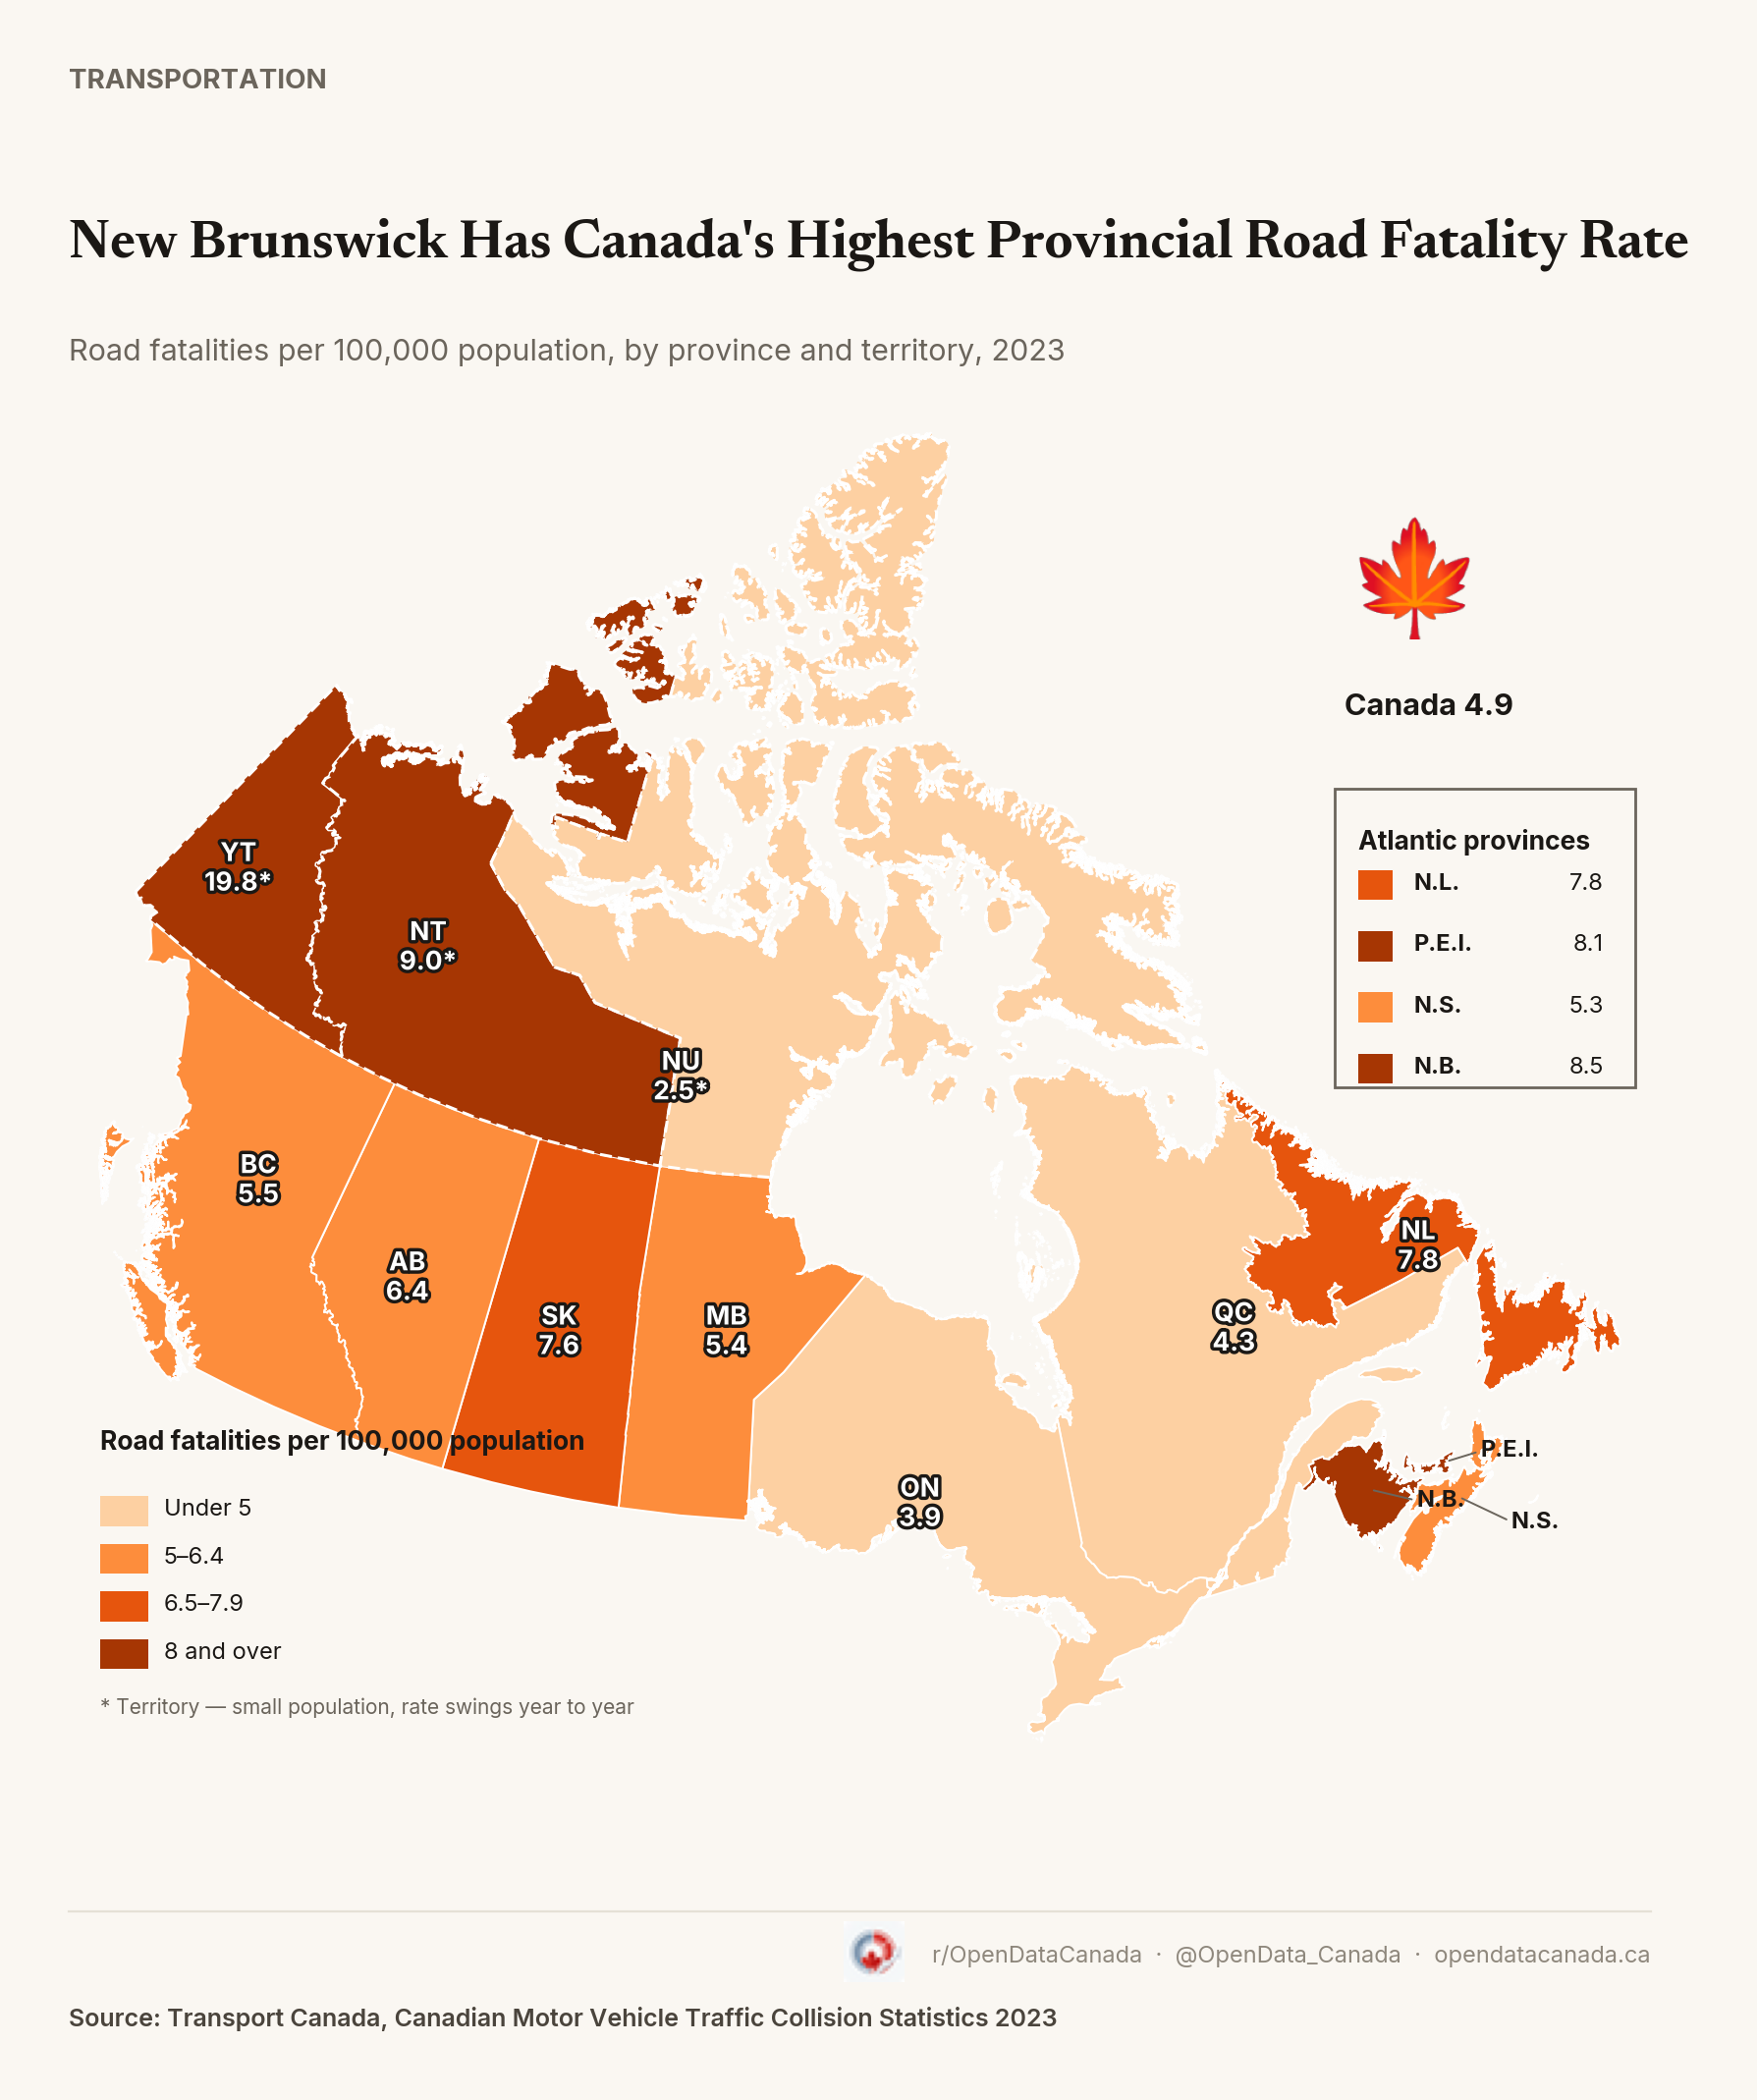
Road fatality rate by province and territory, 2023 (per 100,000 population). Data: Transport Canada, Canadian Motor Vehicle Traffic Collision Statistics 2023.
Same data, different ranking
That ranking counts deaths against population. Count them against actual driving instead, fatalities per billion vehicle-kilometres travelled, and the picture shifts. P.E.I. (8.4), Newfoundland and Labrador (8.3) and New Brunswick (8.1) form a tight cluster at the top; Atlantic Canada is still worst either way. But a couple of provinces jump around more than that. Alberta looks like a mid-table problem by population, 6.4, fifth-worst in the country, and falls close to the national average once its long driving distances get factored in, 4.9. Nova Scotia moves the same direction: 5.3 by population down to 4.6 per kilometre driven, toward the lower end of the ranking on that measure. Ontario is lowest under both (3.9 per capita, 3.4 per km). Ontario also ranks lowest among provinces on another per-capita measure: hospital spending.
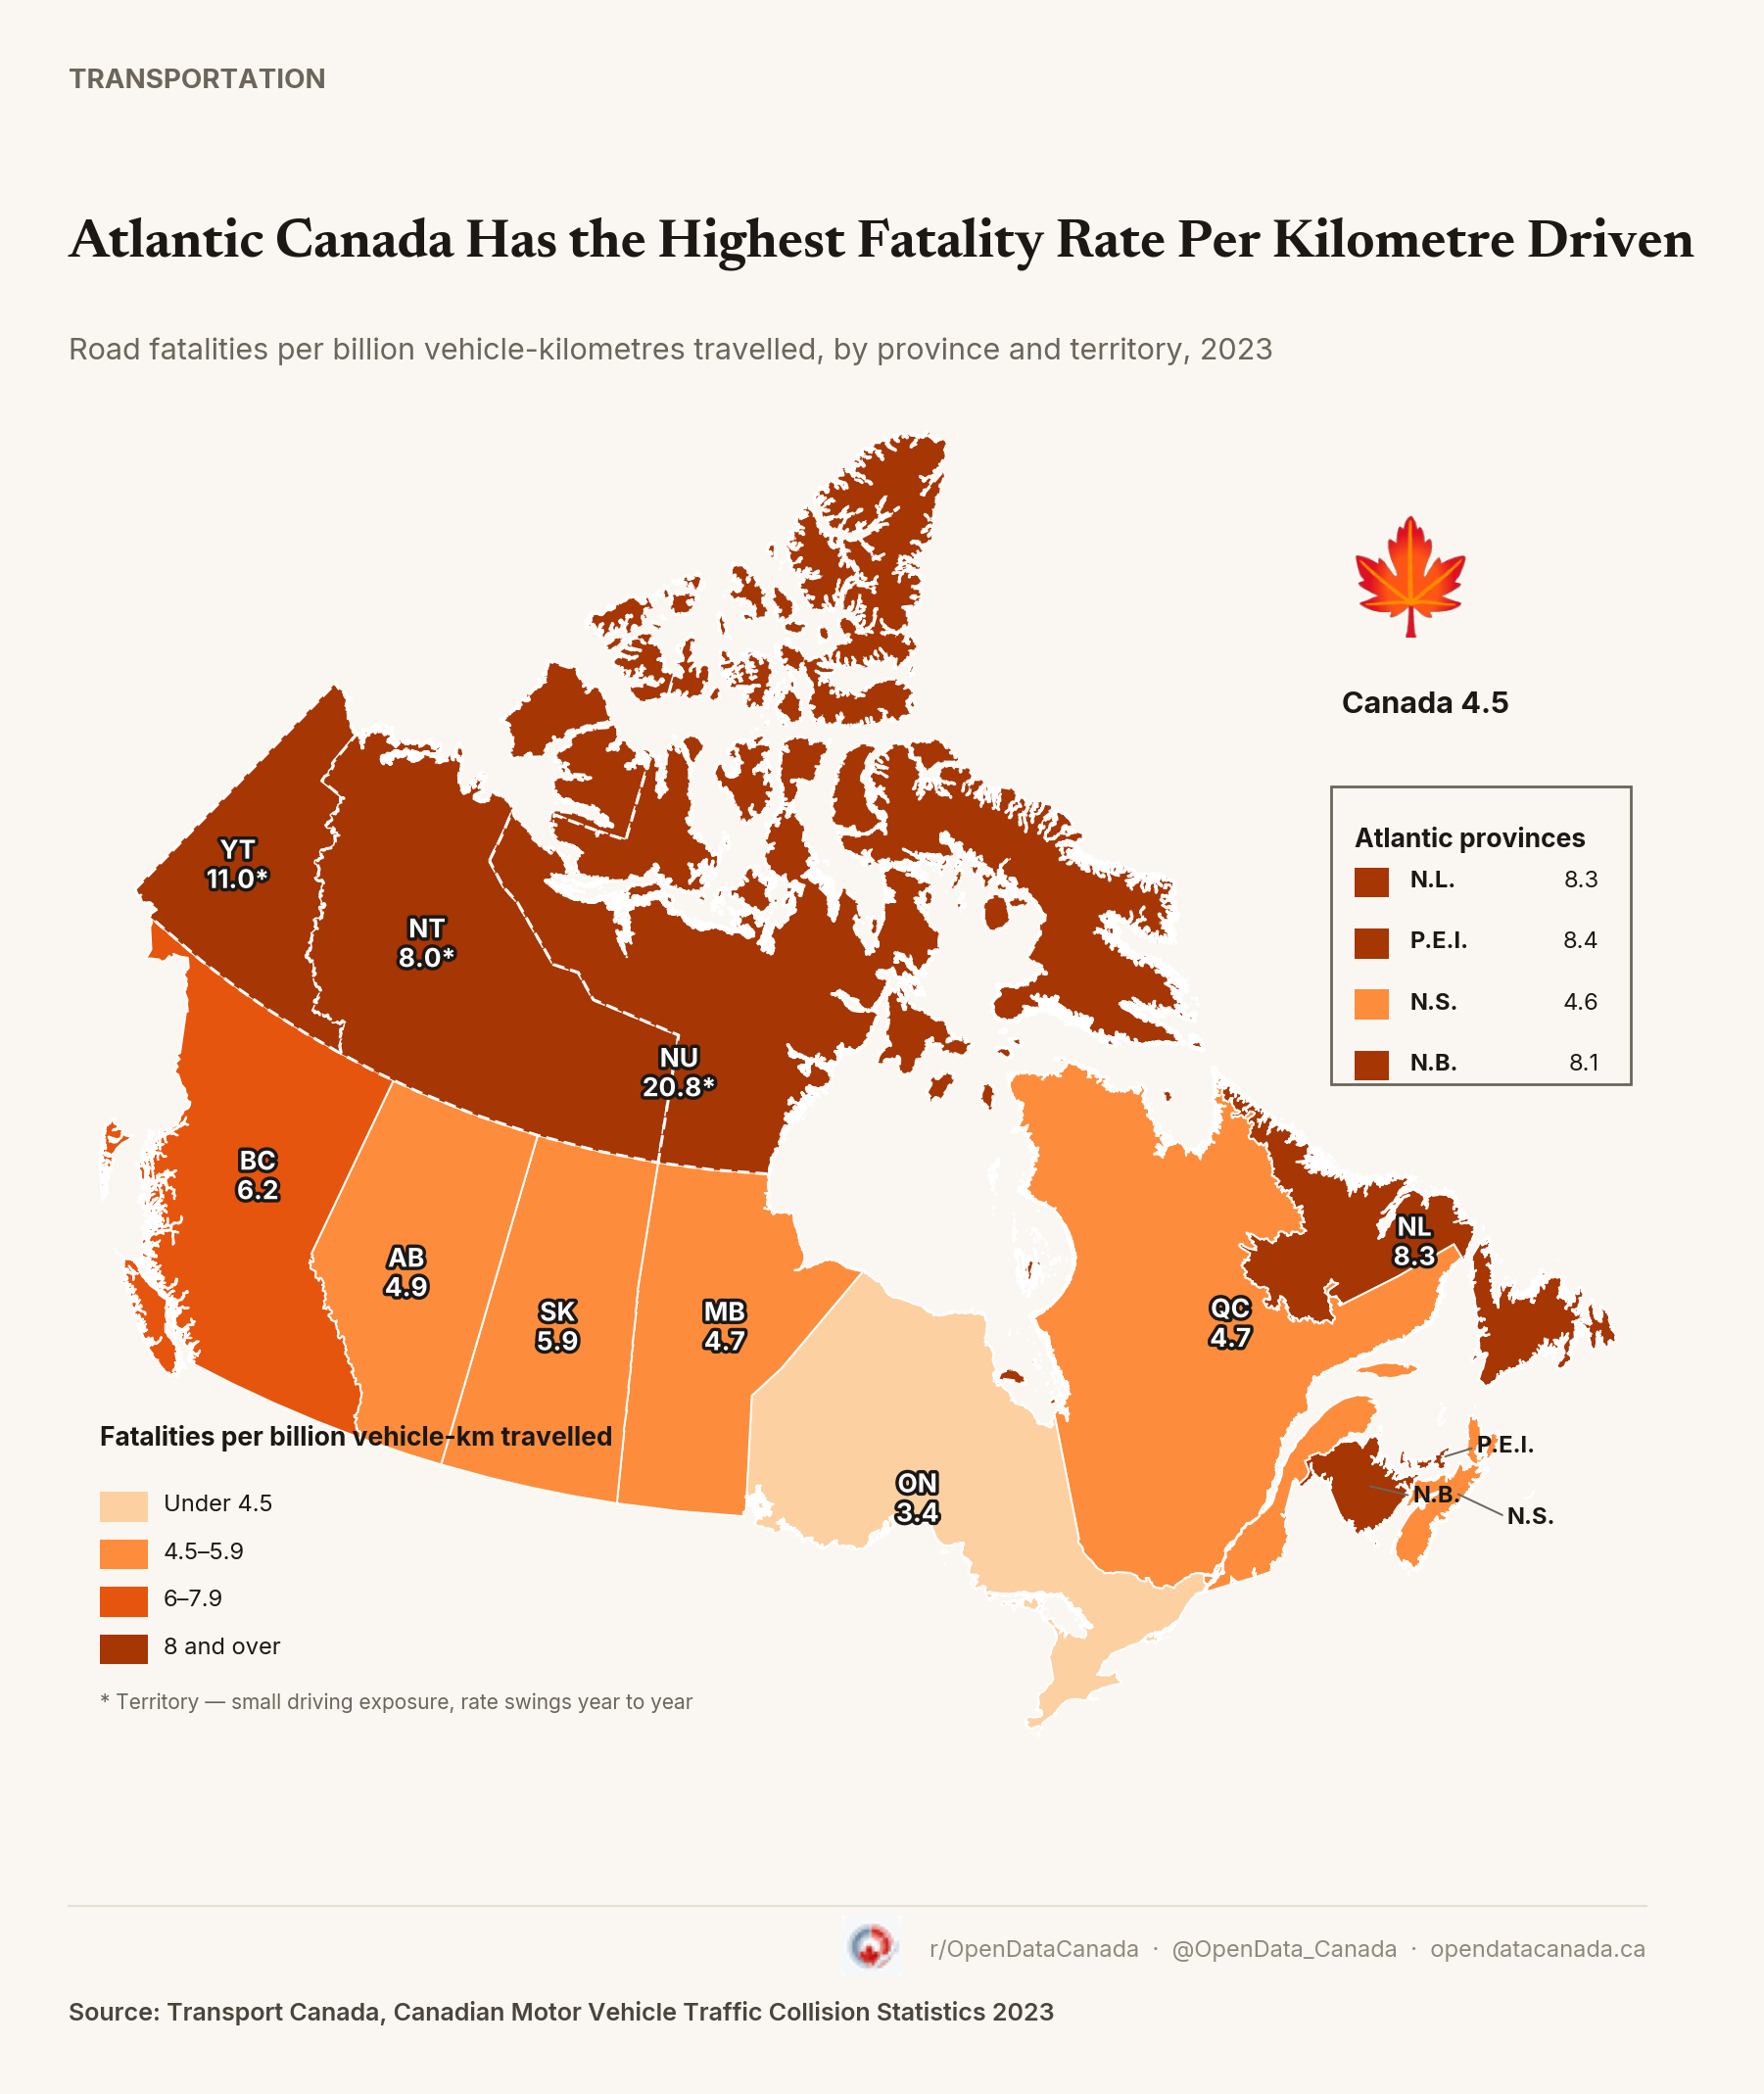
Road fatality rate by province and territory, 2023 (per billion vehicle-kilometres travelled). Data: Transport Canada, Canadian Motor Vehicle Traffic Collision Statistics 2023.
The two numbers aren't measuring the same thing. Fatalities per capita is close to a resident's odds of dying on the road in a given year. Fatalities per kilometre driven is closer to the odds per trip. A province can look bad on one and fine on the other depending on how much driving its residents actually do, which is most of what's happening with Alberta and Nova Scotia above.
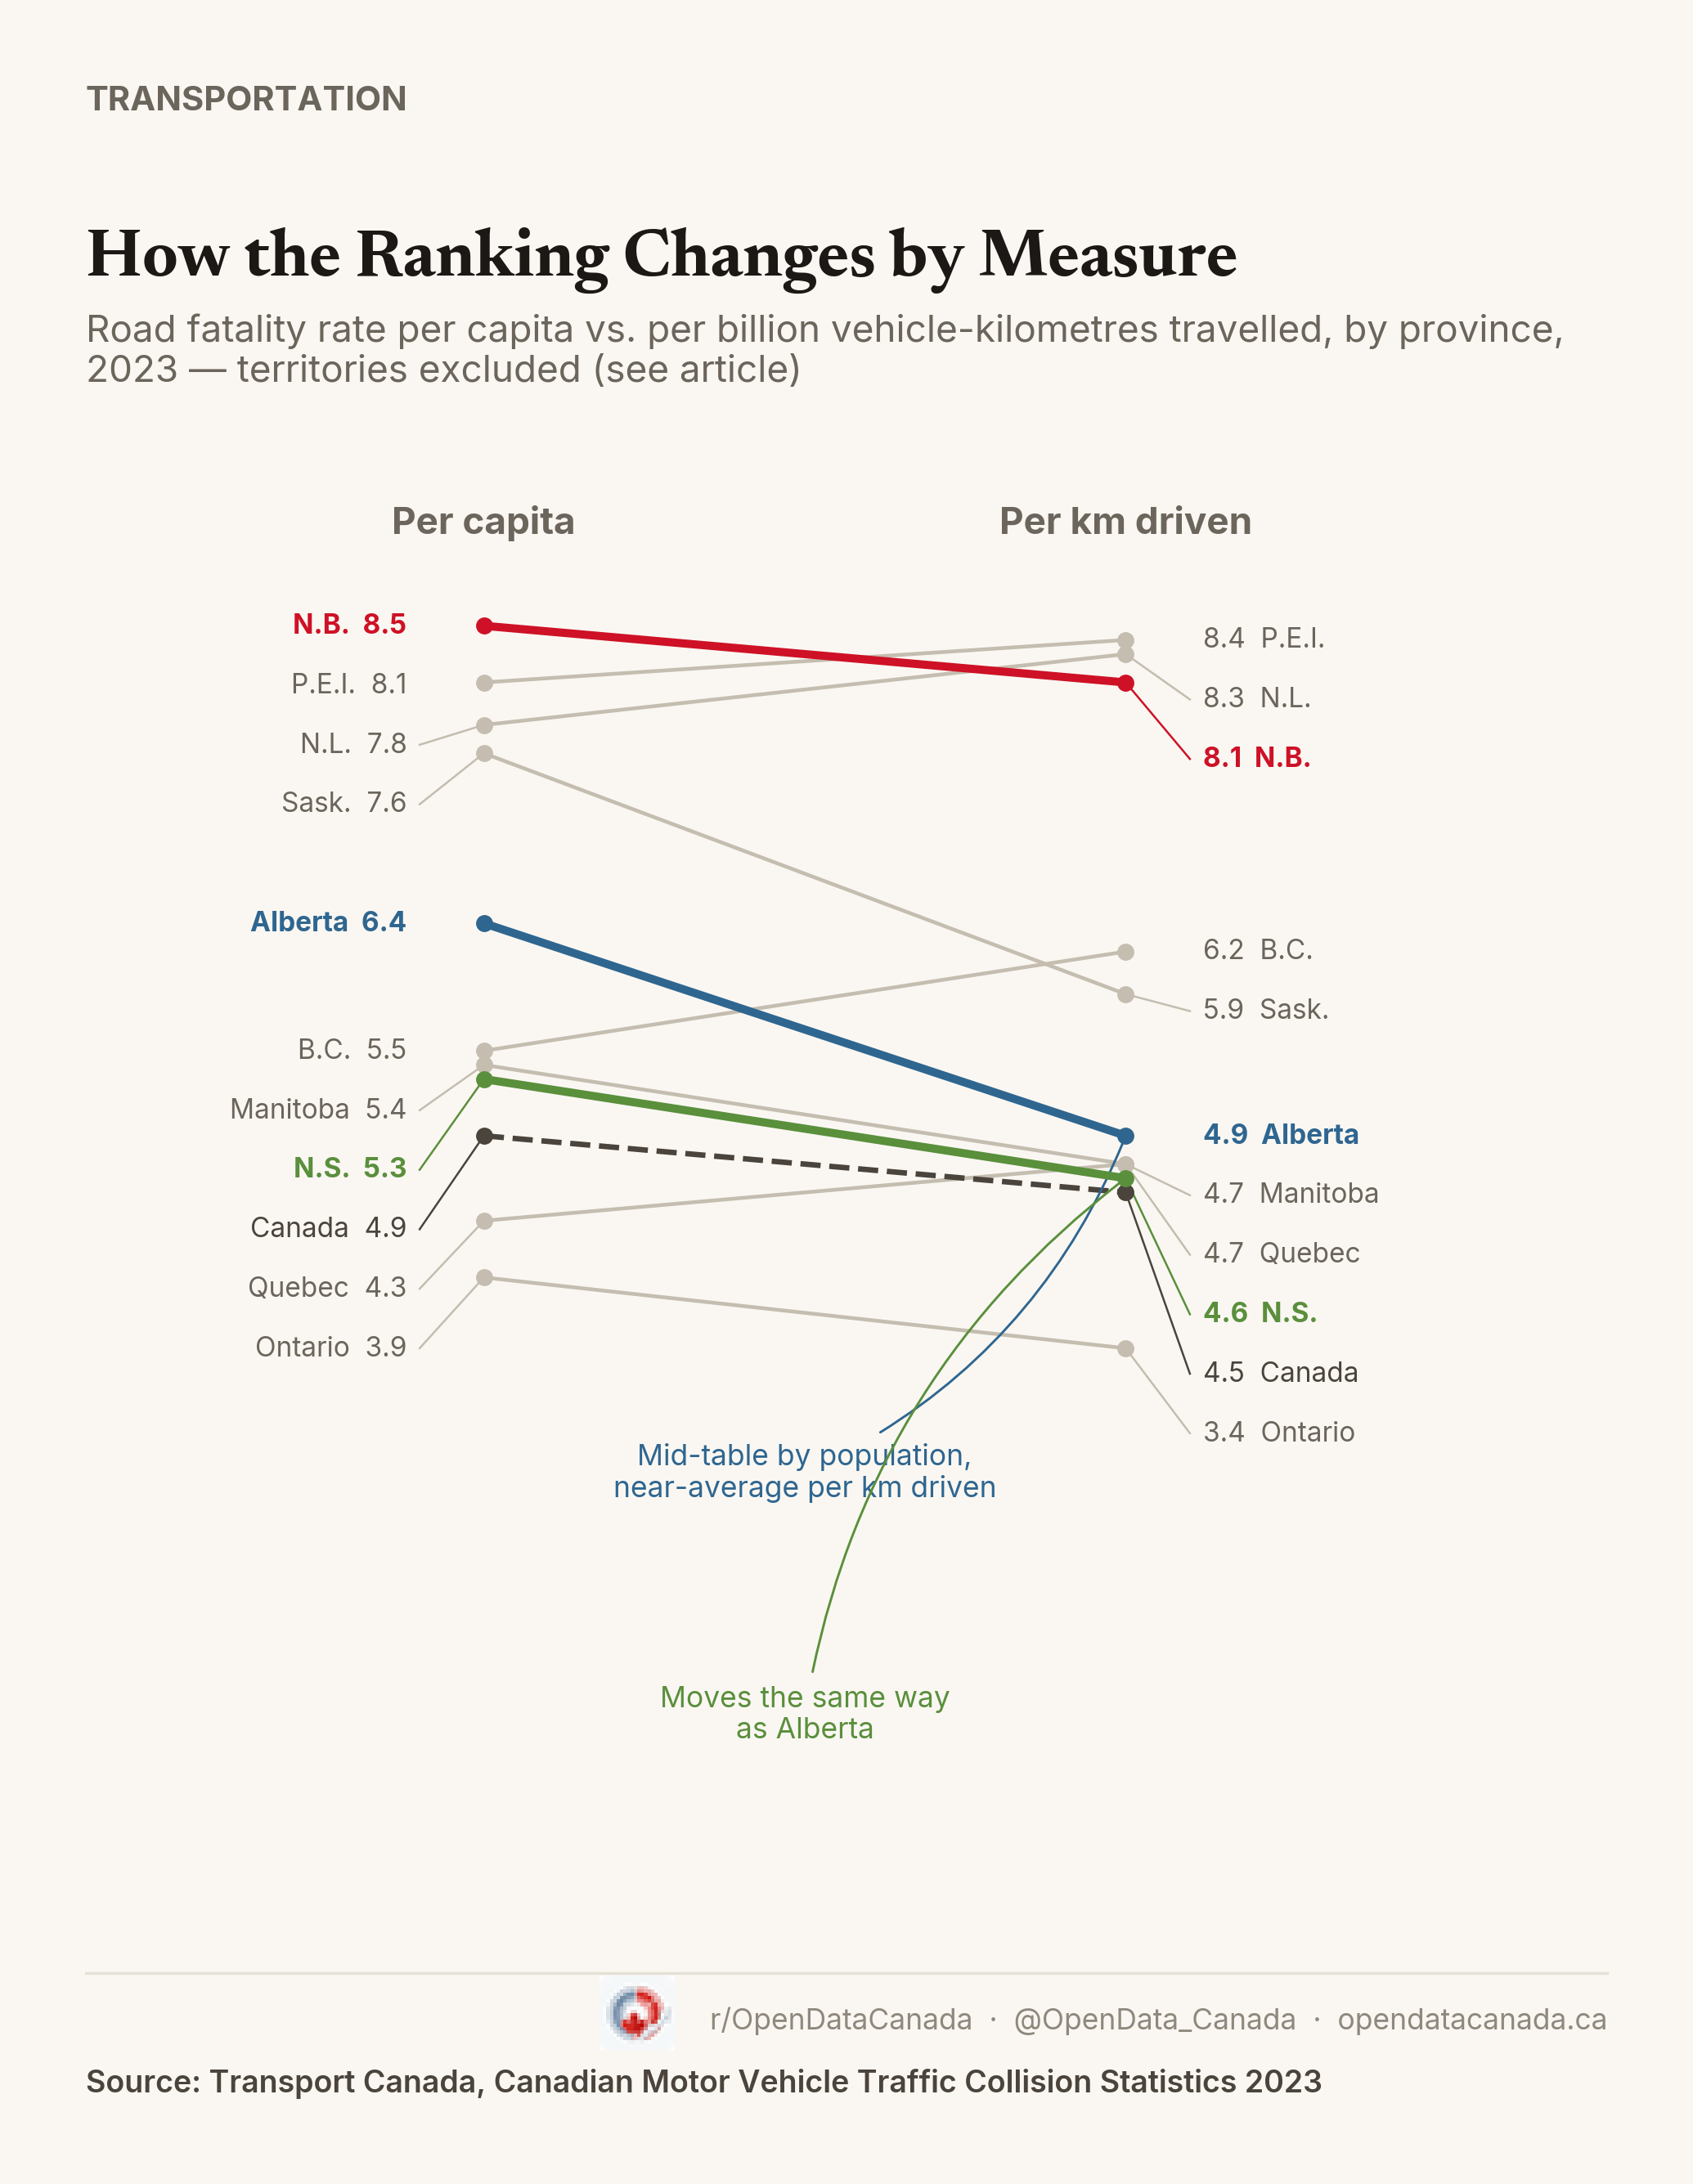
Per capita vs. per kilometre driven, by province, 2023. Data: Transport Canada, Canadian Motor Vehicle Traffic Collision Statistics 2023.
What about the territories?
Yukon, the Northwest Territories and Nunavut are left out of the provincial ranking above. That's our editorial choice for this piece, not something Transport Canada does itself: their populations and driving volumes are small enough that one bad year can swing the rate a long way, so a single year's number is a shakier basis for ranking them against the provinces.
The territories also show why the denominator matters, more than any province does. Nunavut has Canada's lowest per-capita rate, 2.5, but its highest per-km rate by a wide margin, 20.8, more than double any province, because so little driving actually happens there. Yukon runs high on both counts, 19.8 per capita and 11.0 per km. Both maps above show the territories with their real 2023 values, marked with a dashed border and an asterisk as a flag for how much that number can swing year to year.