Ontario spends the least per person on hospitals. Age doesn't explain it.
Ontario's government spent $1,967 per resident on hospitals in 2023, the lowest of any province and about $974 less than Nova Scotia. The obvious defence is that Ontario has a younger population. Adjusting for age barely moves the number.
Published 28 July 2026 · Open Data CanadaSource Canadian Institute for Health Information, National Health Expenditure Database 2025 (Series E2, Appendix D.30)
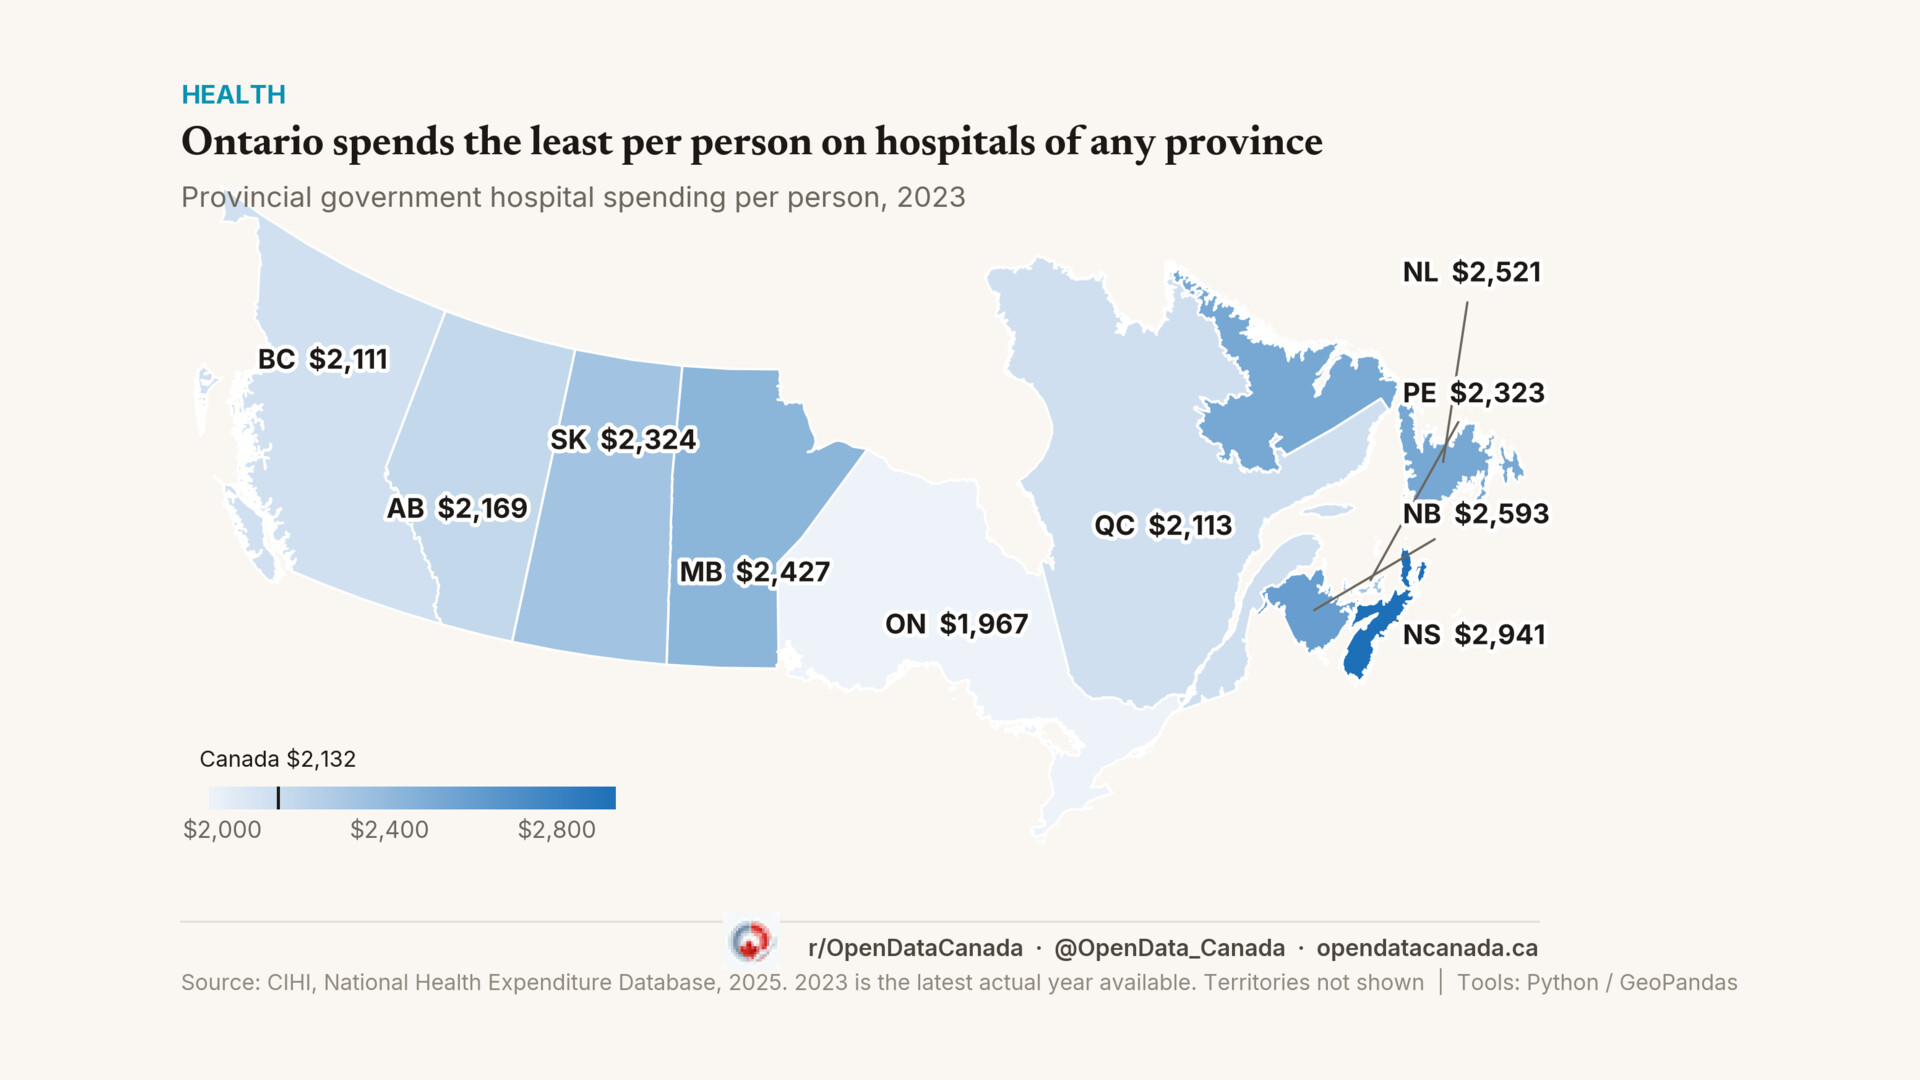
Ontario is the palest province on the map, and the gap to the next one is wider than the gap between most of the rest. Data: CIHI, National Health Expenditure Database, 2025. Territories not shown.
Ontario spends less per person on hospitals than any other province. In 2023, the most recent year for which the Canadian Institute for Health Information (CIHI) reports actual rather than projected figures, the Ontario government spent $1,967 per resident. The national figure was $2,132. Nova Scotia spent $2,941, about $974 more per person than Ontario.
That figure is what it costs to run hospitals: staff, supplies, and the drugs given to patients inside them. Construction and equipment are counted separately, so none of it is new buildings.
It isn't a photo finish. Ontario's nearest neighbours, British Columbia at $2,111 and Quebec at $2,113, both sit roughly $147 above it. No other province is close.
Older people use more hospital care, and Ontario's population is younger than the Atlantic provinces'. Perhaps Ontario just has fewer patients who need expensive care.
So we tested it. Age standardization recalculates every province's spending as if it had Canada's age structure, across 20 age groups, using CIHI's own population tables so that the spending and population figures come from one consistent source.
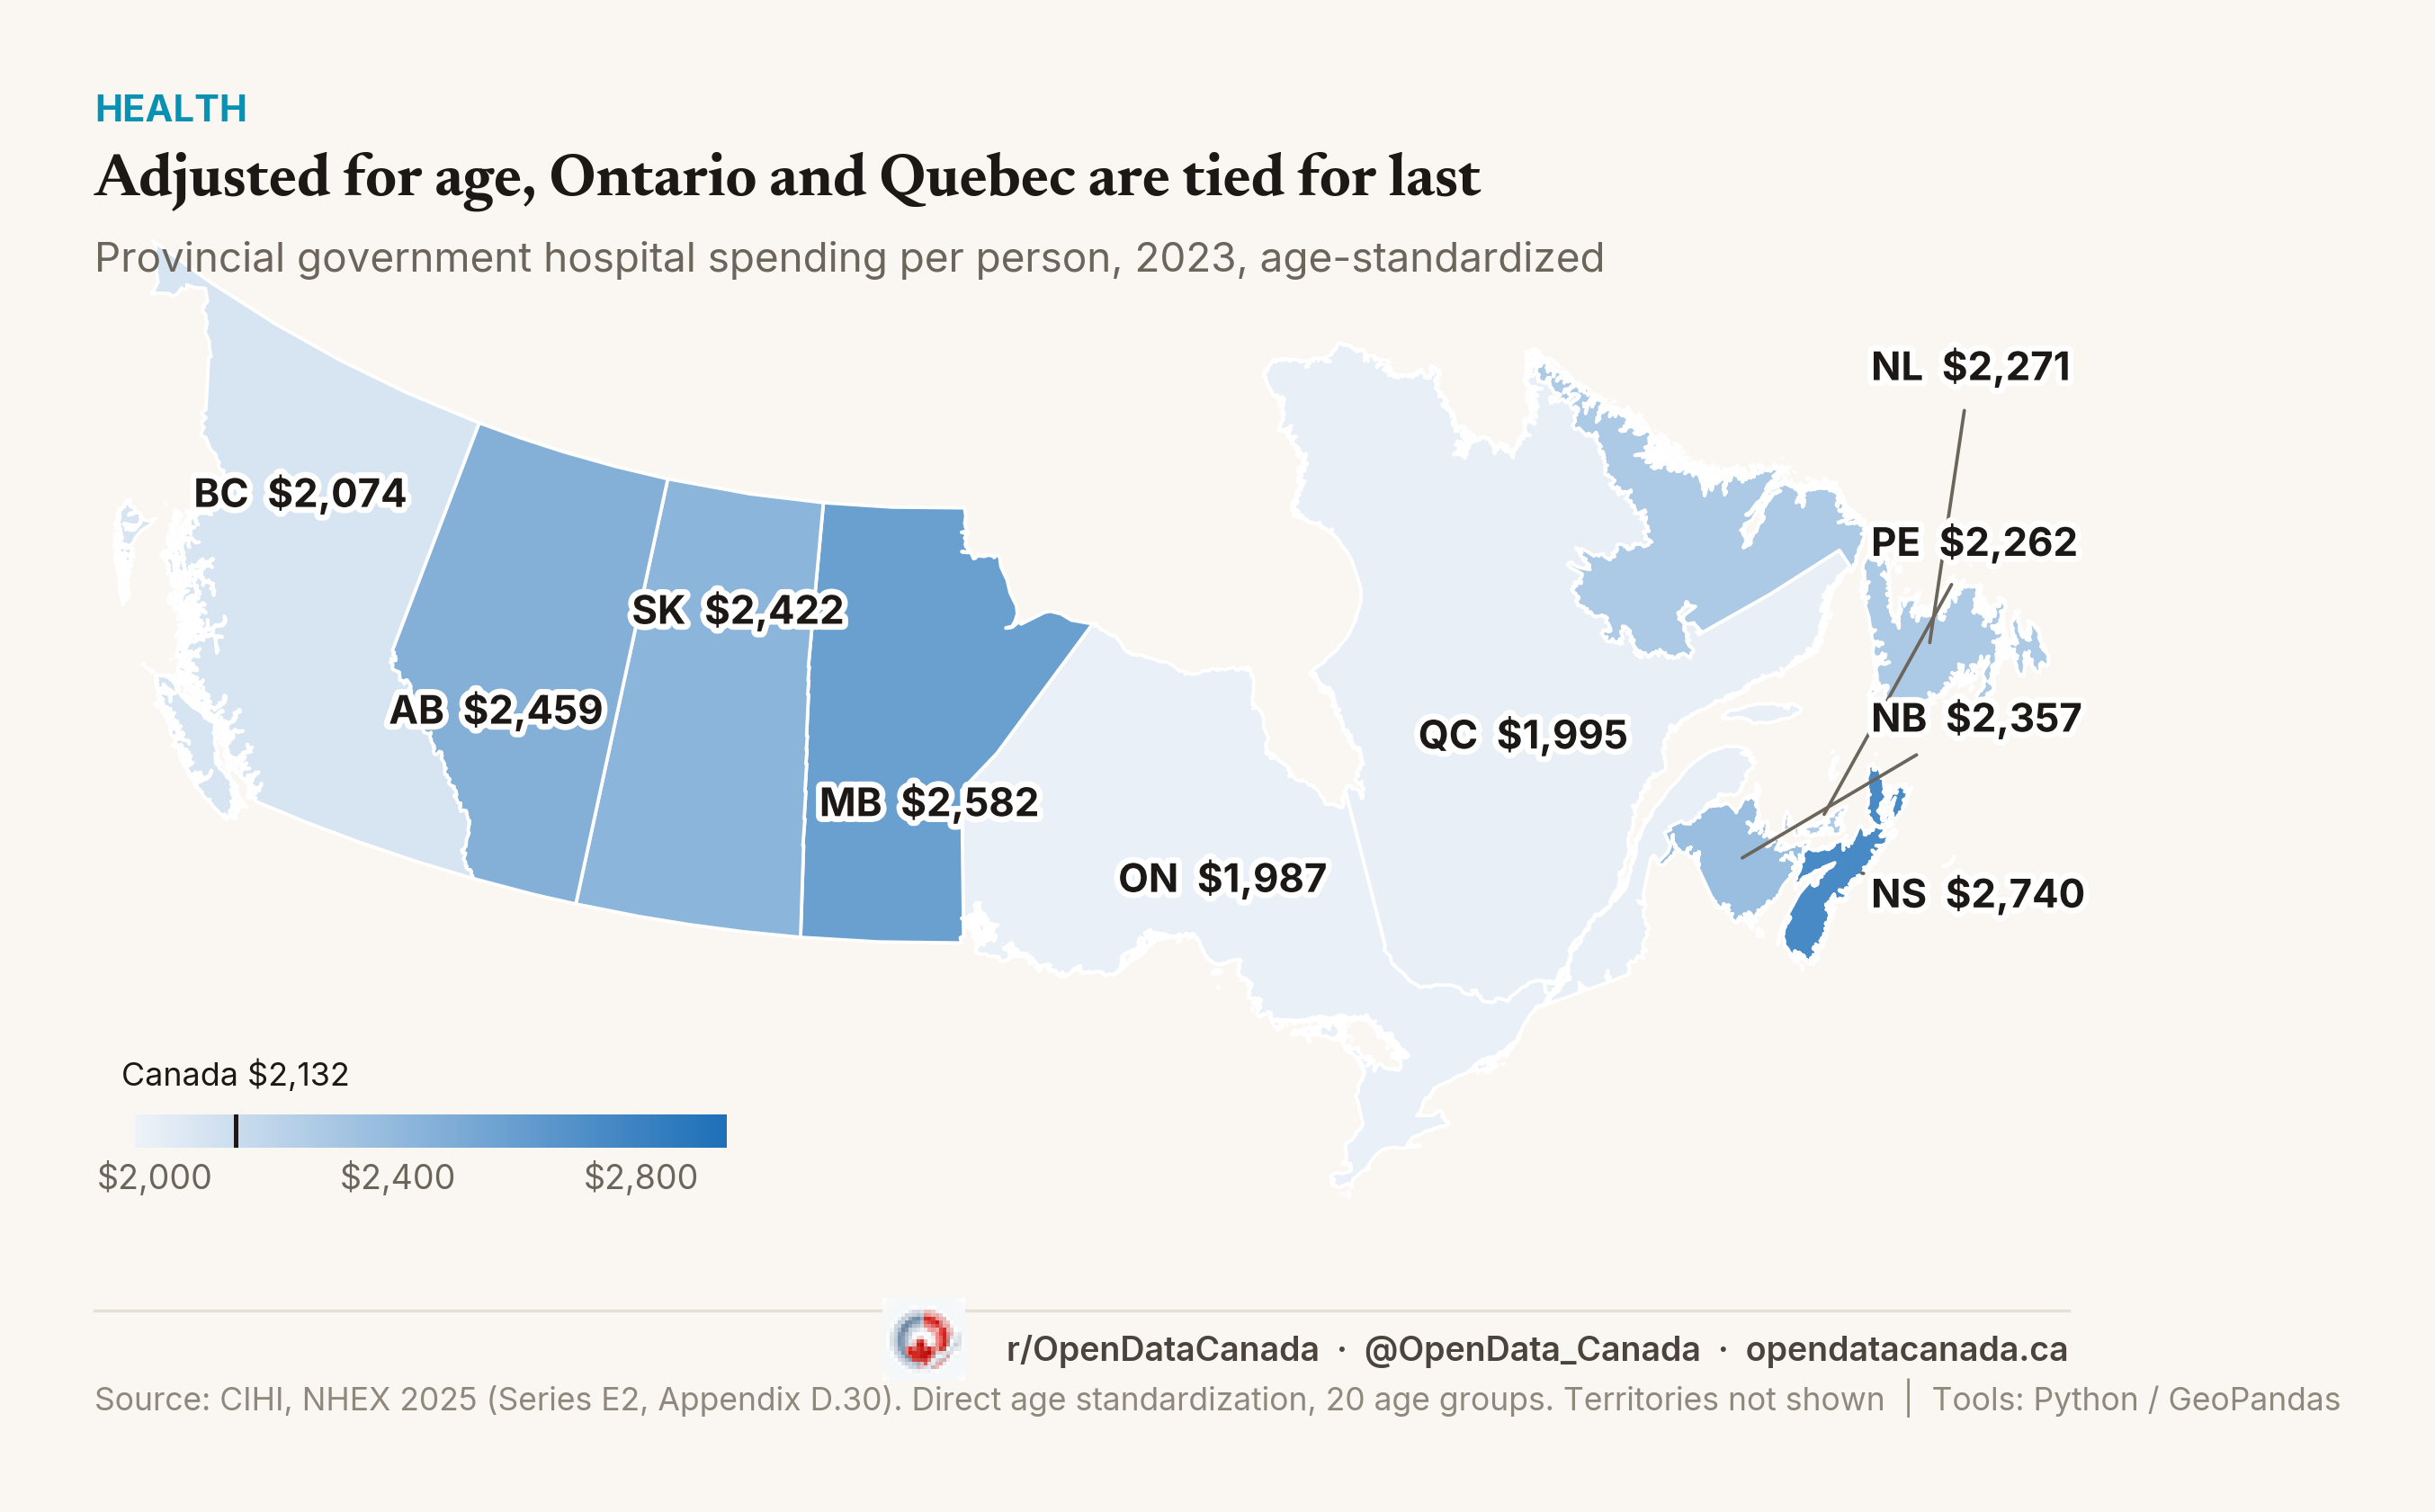
The adjustment moves some provinces hard. Alberta looks frugal, fourth-lowest in the country, until you account for only 15.0% of Albertans being 65 or older, the youngest province in Canada against a national share of 18.9%. Adjusted, Alberta rises $290 and lands eighth. Newfoundland and Labrador sheds $249 once its 24.3% senior share is taken out.
Ontario barely moves: $1,967 crude, $1,987 adjusted, a shift of $20. Ontario's hospital spending is low because Ontario funds hospitals at a low rate, not because Ontarians are young.
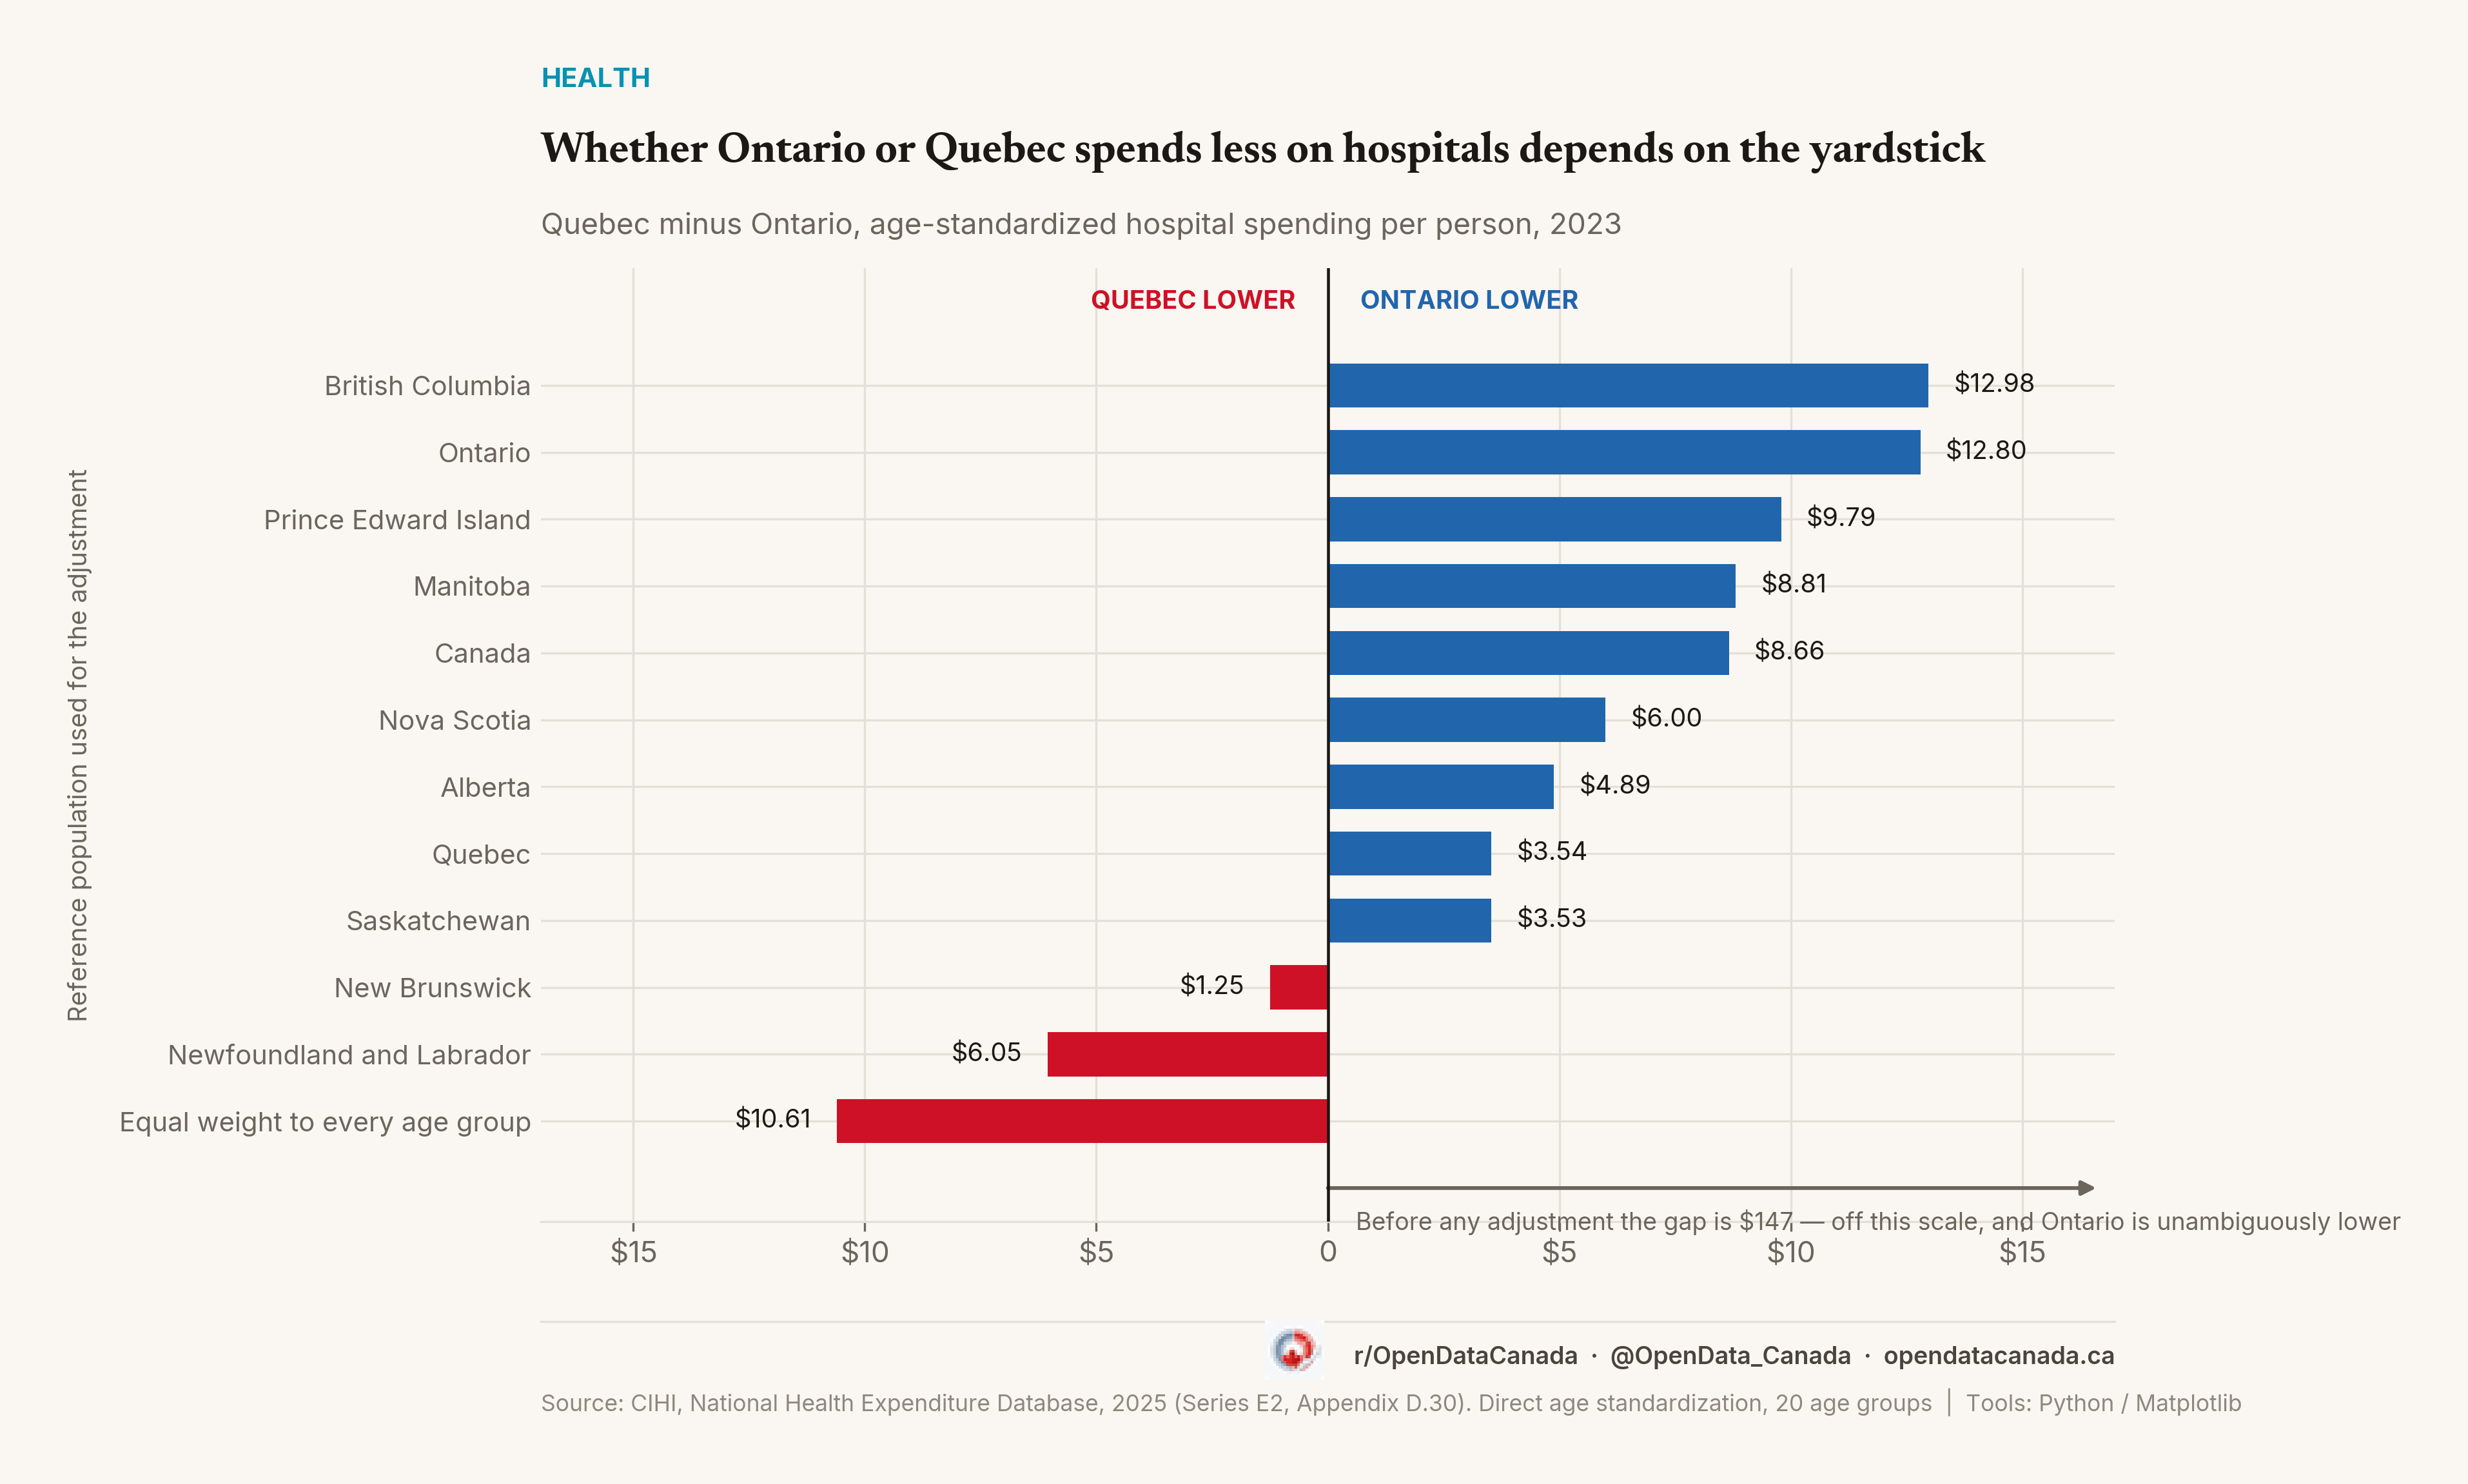
The one thing the adjustment changes is that Ontario no longer has the bottom to itself. Quebec starts $147 above Ontario and lands at $1,995 against Ontario's $1,987, a gap of $8.66, less than half a percent.
That margin is too small to rank on. Age standardization compares provinces against a reference population, and which one you pick moves Ontario and Quebec by more than the $8.66 between them. We tested twelve. Ontario is lower under nine, Quebec under three. So the two are tied, not ordered.
Note carefully what that does and does not touch. Adjusted for age, Ontario and Quebec are tied for last. Unadjusted, where there is no reference population to pick and nothing to second-guess, Ontario is last outright by $147. The demographic defence of Ontario's hospital budget doesn't survive contact with Ontario's own demographics.
Canadian Institute for Health Information, National Health Expenditure Database, 2025. Series E2 (provincial and territorial government health expenditure by age group) and Appendices A to D, table D.30 (population by age group).
2023 is the most recent year of actual rather than forecast data in the 2025 release.
What is counted. "Hospitals" is a category of institution, and the spending is operating spending. CIHI counts construction, machinery, equipment and hospital software in a separate Capital category, so none of it appears here. Physician fees billed directly to provincial medical plans sit in Physicians even when the work is done in a hospital, so a province that delivers more care through salaried hospital staff than through fee-for-service physicians will show more spending under Hospitals. Drugs dispensed inside hospitals do count here rather than under Drugs.
Methodology. Figures are provincial and territorial government hospital spending per person, which is narrower than CIHI's "public sector" measure. The public sector total also carries federal direct, municipal and social security spending, and puts Ontario at $1,985 rather than $1,967. The narrower basis is used throughout because CIHI publishes age-group detail only on that basis, so the crude and age-standardized figures are like for like. Age standardization is direct, across 20 age groups, to Canada's 2023 age structure unless otherwise stated. Spending and population both come from the same CIHI release, so there is no denominator mismatch. The age detail itself is modelled rather than observed: CIHI distributes each province's hospital total across age groups using acute inpatient weighted cases from its Discharge Abstract Database. That leaves provincial totals untouched, so the crude comparison does not depend on it, but it is a further reason not to read a ranking into the adjusted figures. As a check on the pipeline, standardizing Canada to its own age structure reproduces Canada's crude figure exactly ($2,132.28). The robustness test re-runs the standardization against twelve reference populations: Canada, each of the ten provinces, and a uniform structure weighting every age group equally. Ontario lands below Quebec under nine of the twelve and above it under three (Newfoundland's, New Brunswick's, and the uniform structure), so no adjusted rank is claimed between the two. Any adjusted league table that puts one province last should name the reference population behind it. Territories are excluded from the maps because Nunavut spends over four times Ontario's per-person figure and flattens the colour scale.
Tell us and we will fix it and note the change on this page. Send a correction
How we work
Every figure comes from a named public source, with the method stated. Read our methods
Cite this article
Open Data Canada. "Ontario spends the least per person on hospitals. Age doesn't explain it.." Published 28 July 2026. https://opendatacanada.ca/articles/ontario-hospital-spending-lowest-2023
The Weekly
The week in Canadian data, every Sunday.
One short email: the week's top stories, our newest videos, the number of the week, a chart worth a second look, and the best thread from r/OpenDataCanada. Free, in plain language. Unsubscribe in one click.