Health · Hospital safety
Recorded bedsores in Canadian hospitals are 2.7 times their 2014 level
About 1 in 17 hospital stays now includes a harm event. The overall rate has barely moved, but some individual types of harm have changed dramatically.
Hospital harm in Canada rose slightly, but not across all types. The Canadian Institute for Health Information (CIHI) counts acute-care hospital stays with at least one occurrence of unintended harm that could potentially have been prevented. CIHI cautions that not every event it captures can necessarily be prevented. In 2014-15 the rate was 5.3 stays per 100. In 2025-26 it was 5.8 (Canada outside Quebec). The rate held near 5.4 until 2019-20, jumped to 5.9 in 2020-21, and has sat between 5.8 and 6.0 ever since.
The overall number hides a split. Some kinds of harm never moved. Others took off.
What fell and what didn't
CIHI groups hospital harm into four categories. Three carry most of the story here: infections caught in hospital, problems from surgery, and problems linked to care or medication. The fourth, falls and injuries, is small (0.21 to 0.26 per 100 stays) but rose by about a quarter. Infections and surgery problems are the ones most people picture, and as groups they are flat.
- Infections ended at 2.04 per 100 stays, close to the 2.09 where they started. They dipped to 1.91 before COVID and are now falling again after a peak of 2.26 in 2022-23.
- Surgery and procedure complications moved from 1.33 to 1.29.
- Care and medication problems rose from 2.65 to 3.35, about 26 percent. About half of that increase (0.34 of the 0.70) came between 2019-20 and 2020-21, and the rate has stayed elevated since.
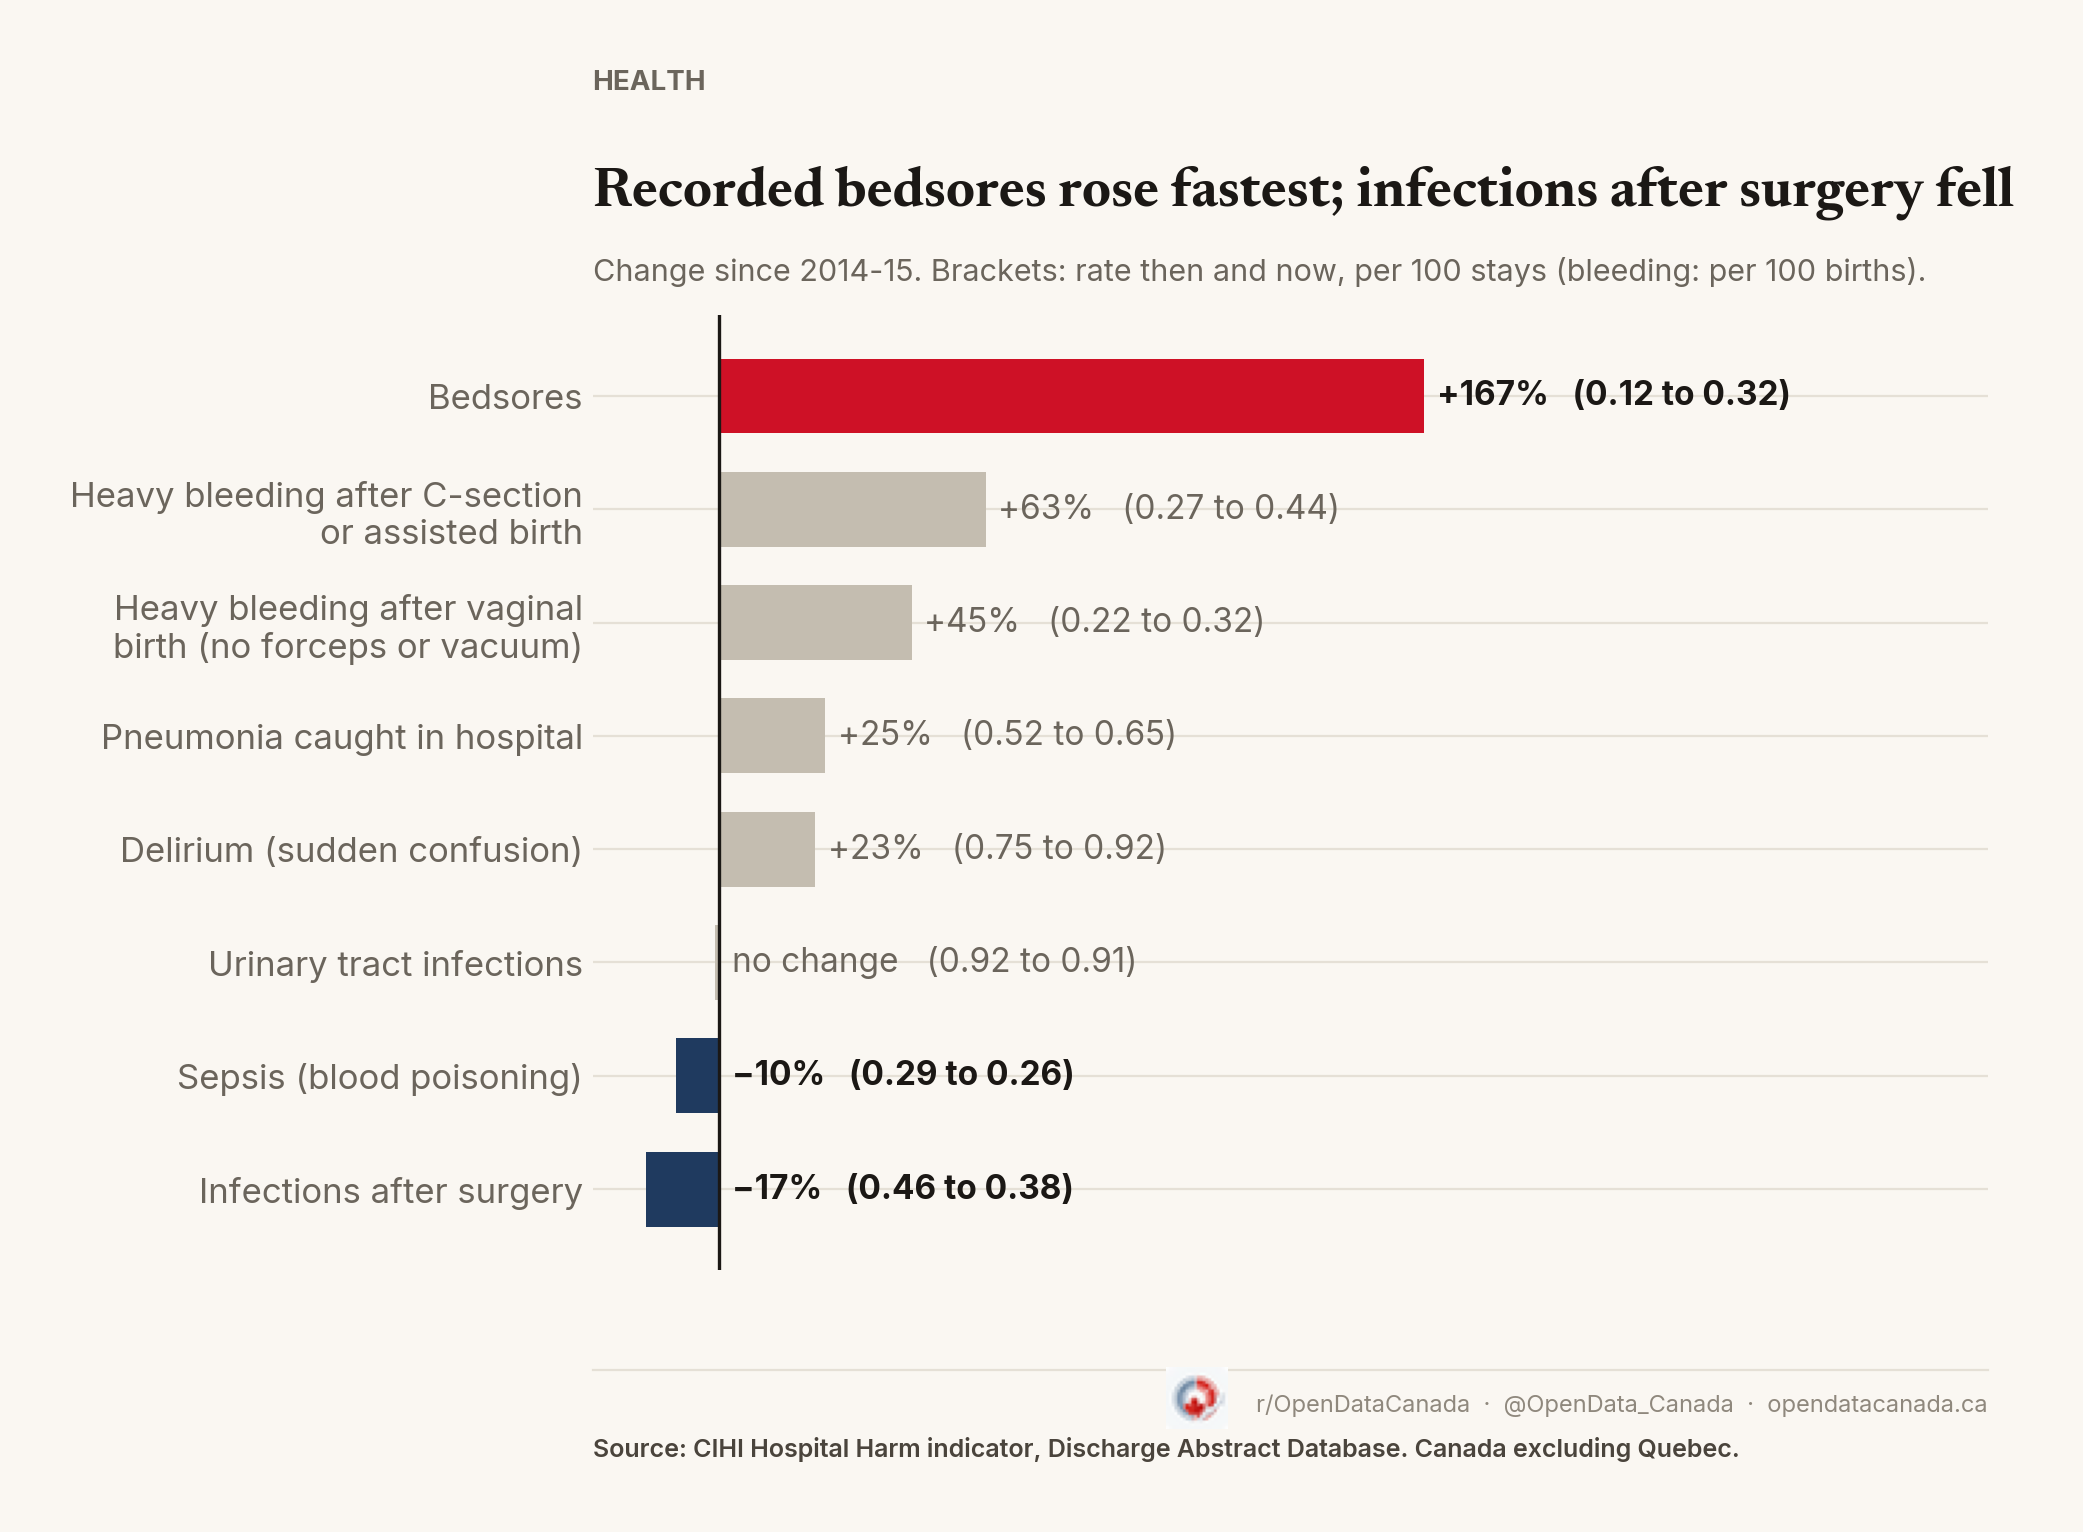
This third group is a catch-all for things like bedsores, confusion and delirium, fluid and salt imbalances, and heavy bleeding after childbirth. Look inside the groups and the pattern gets sharper. The chart shows eight of the most common or most discussed harms, not all 31.
Recorded bedsores rose fastest
A bedsore, or pressure ulcer, is a pressure-related wound that can develop during prolonged immobility. CIHI counts any stage of pressure ulcer that arose after admission.
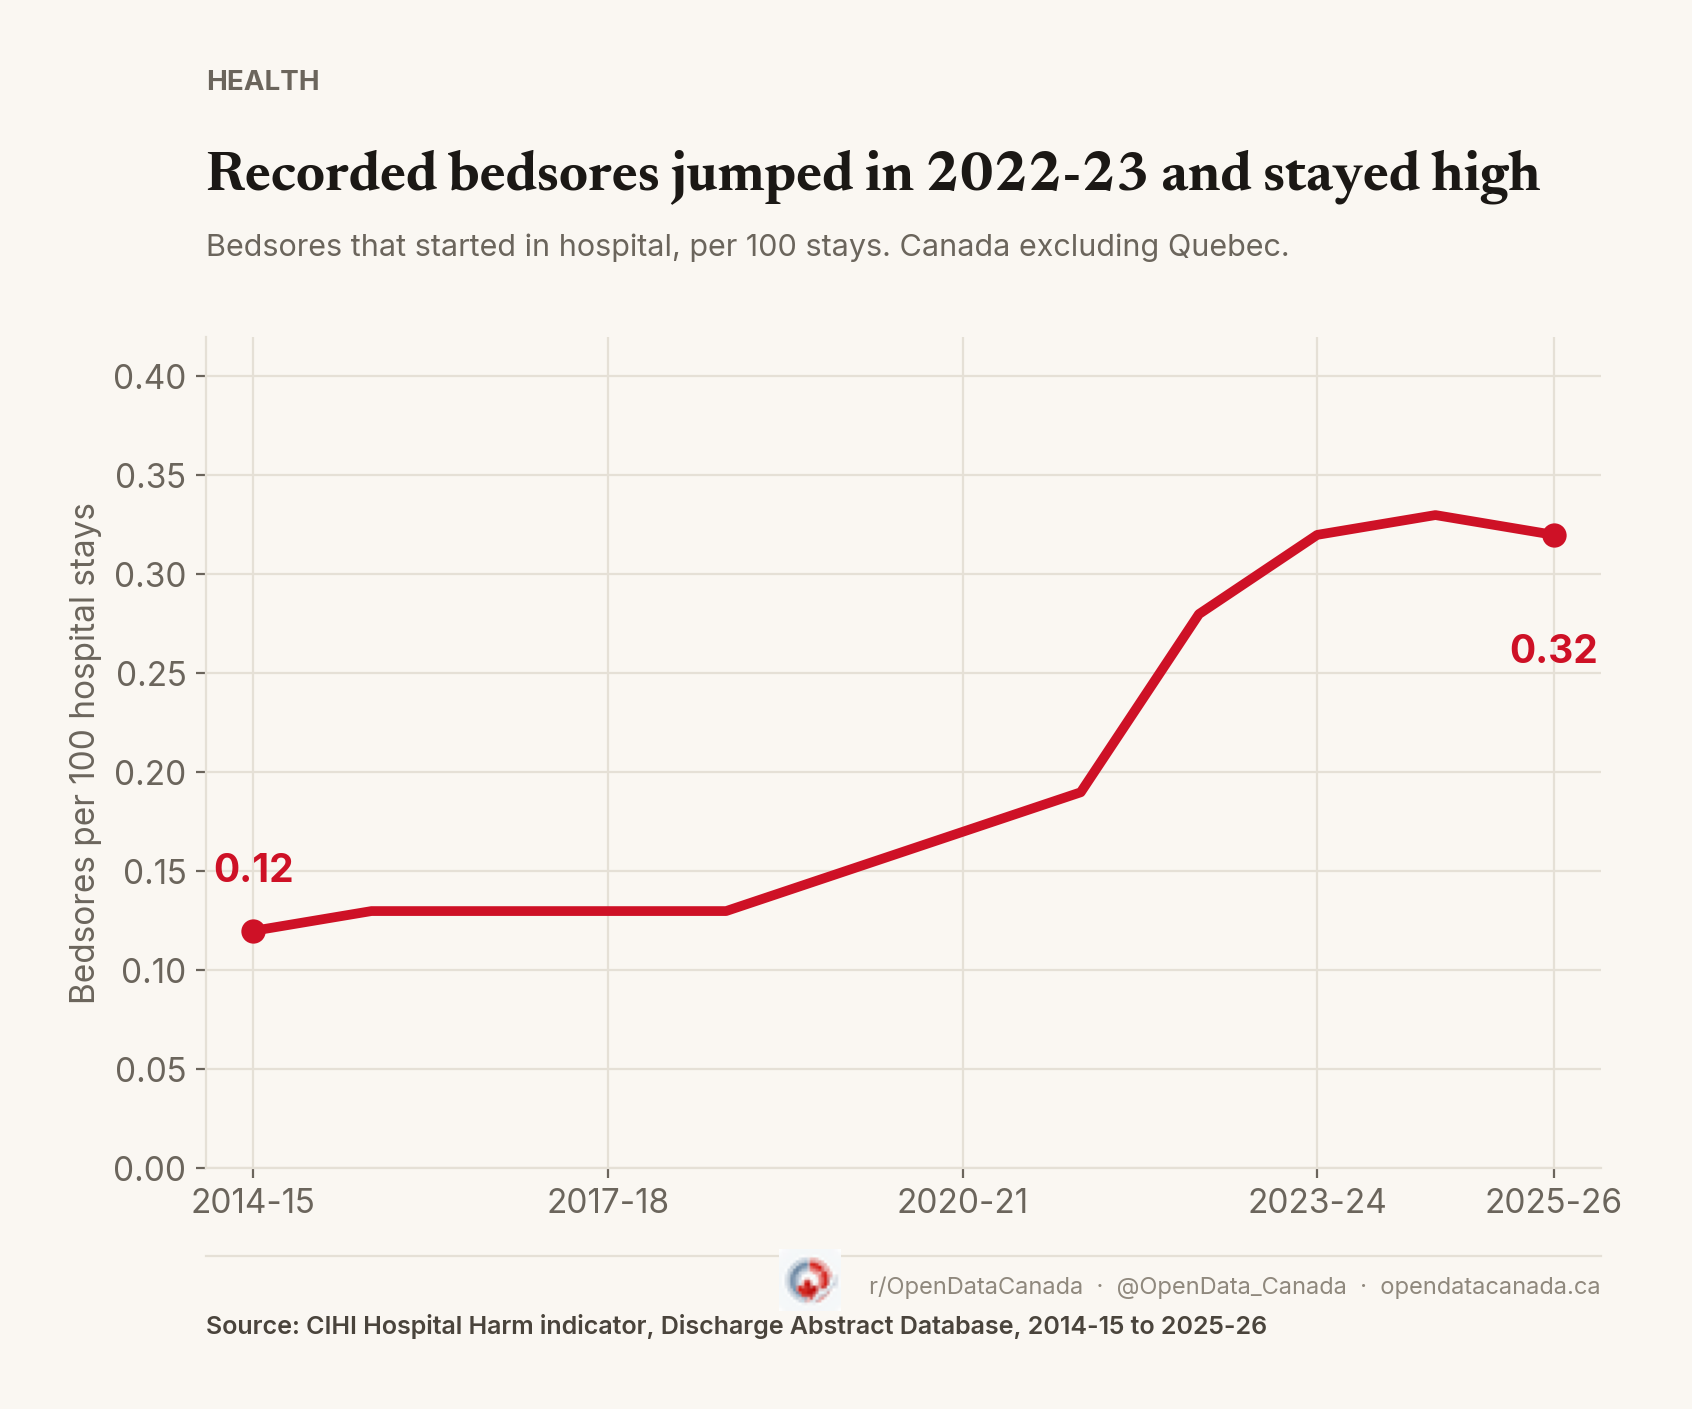
The rate was 0.12 per 100 stays in 2014-15 and stayed near 0.13 through 2018-19. Then it climbed: 0.19 in 2021-22, 0.28 in 2022-23, 0.32 in 2025-26. That is 2.7 times where it started. Most of the jump came in the two years after 2021-22, not at the start of COVID.
Heavy bleeding after a C-section or an assisted delivery (forceps or vacuum) rose from 0.27 to 0.44 per 100 childbirth stays, up 63 percent. Heavy bleeding after a vaginal birth without instruments rose from 0.22 to 0.32, up 45 percent. Both are rates among childbirth stays, so more C-sections or assisted births could push the first one up on their own.
Meanwhile infections after surgery or other procedures fell from 0.46 to 0.38, and urinary tract infections ended where they began (0.92 to 0.91).
Is it more harm, or more counting?
Bedsores depend on someone noting them in the chart. A hospital that documents more thoroughly can record more cases without necessarily having more patients develop them. CIHI says differences in documentation and other hospital processes can affect the rate. CIHI applies the same method to every year, but its notes do not say whether coding practices changed. The one-year jump, from 0.19 to 0.28 in 2022-23, is the kind of step that a change in recording can produce.
So the fair reading is this: recorded bedsores are far more common. The data alone cannot tell us how much of the increase reflects more injuries, better detection, or both. CIHI also says results from 2020-21 on should be read in the context of COVID.
Who is affected
The gaps between groups are small and shrinking. Stays by patients from the lowest-income neighbourhoods had the highest rate in every year, 6.19 per 100 in 2025-26 against 5.58 for the highest-income, but that gap has narrowed since 2014-15 (5.73 against 4.93). Rural and remote hospital stays (by where the patient was treated) had lower rates than urban ones in every year, but they have nearly caught up: 5.52 against 5.92, up from 4.34 against 5.61. These are crude rates, so differences in patient age, illness and transfers can explain part of any gap.
CIHI's public tables are national only, and Quebec is not included. Hospitals and health systems can see their own results in CIHI's restricted Insight+ tool, but the public cannot compare provinces or hospitals.
That is the gap. For a comparison of what provinces spend on hospitals, see Ontario spends the least per person on hospitals.
Canada can say that roughly 1 in 17 stays involves harm and which types are rising. It can't say which hospitals are seeing more of it.