Health
How Canadian Men Came to Die Younger Than Women
A century of mortality records shows the opposite was once true. Before 1940, women in their 20s and 30s often died younger than men, mainly from childbirth. Every year since the 1940s, men have died younger, and by the 1980s a 22-year-old man was more than four times as likely to die as a 22-year-old woman.
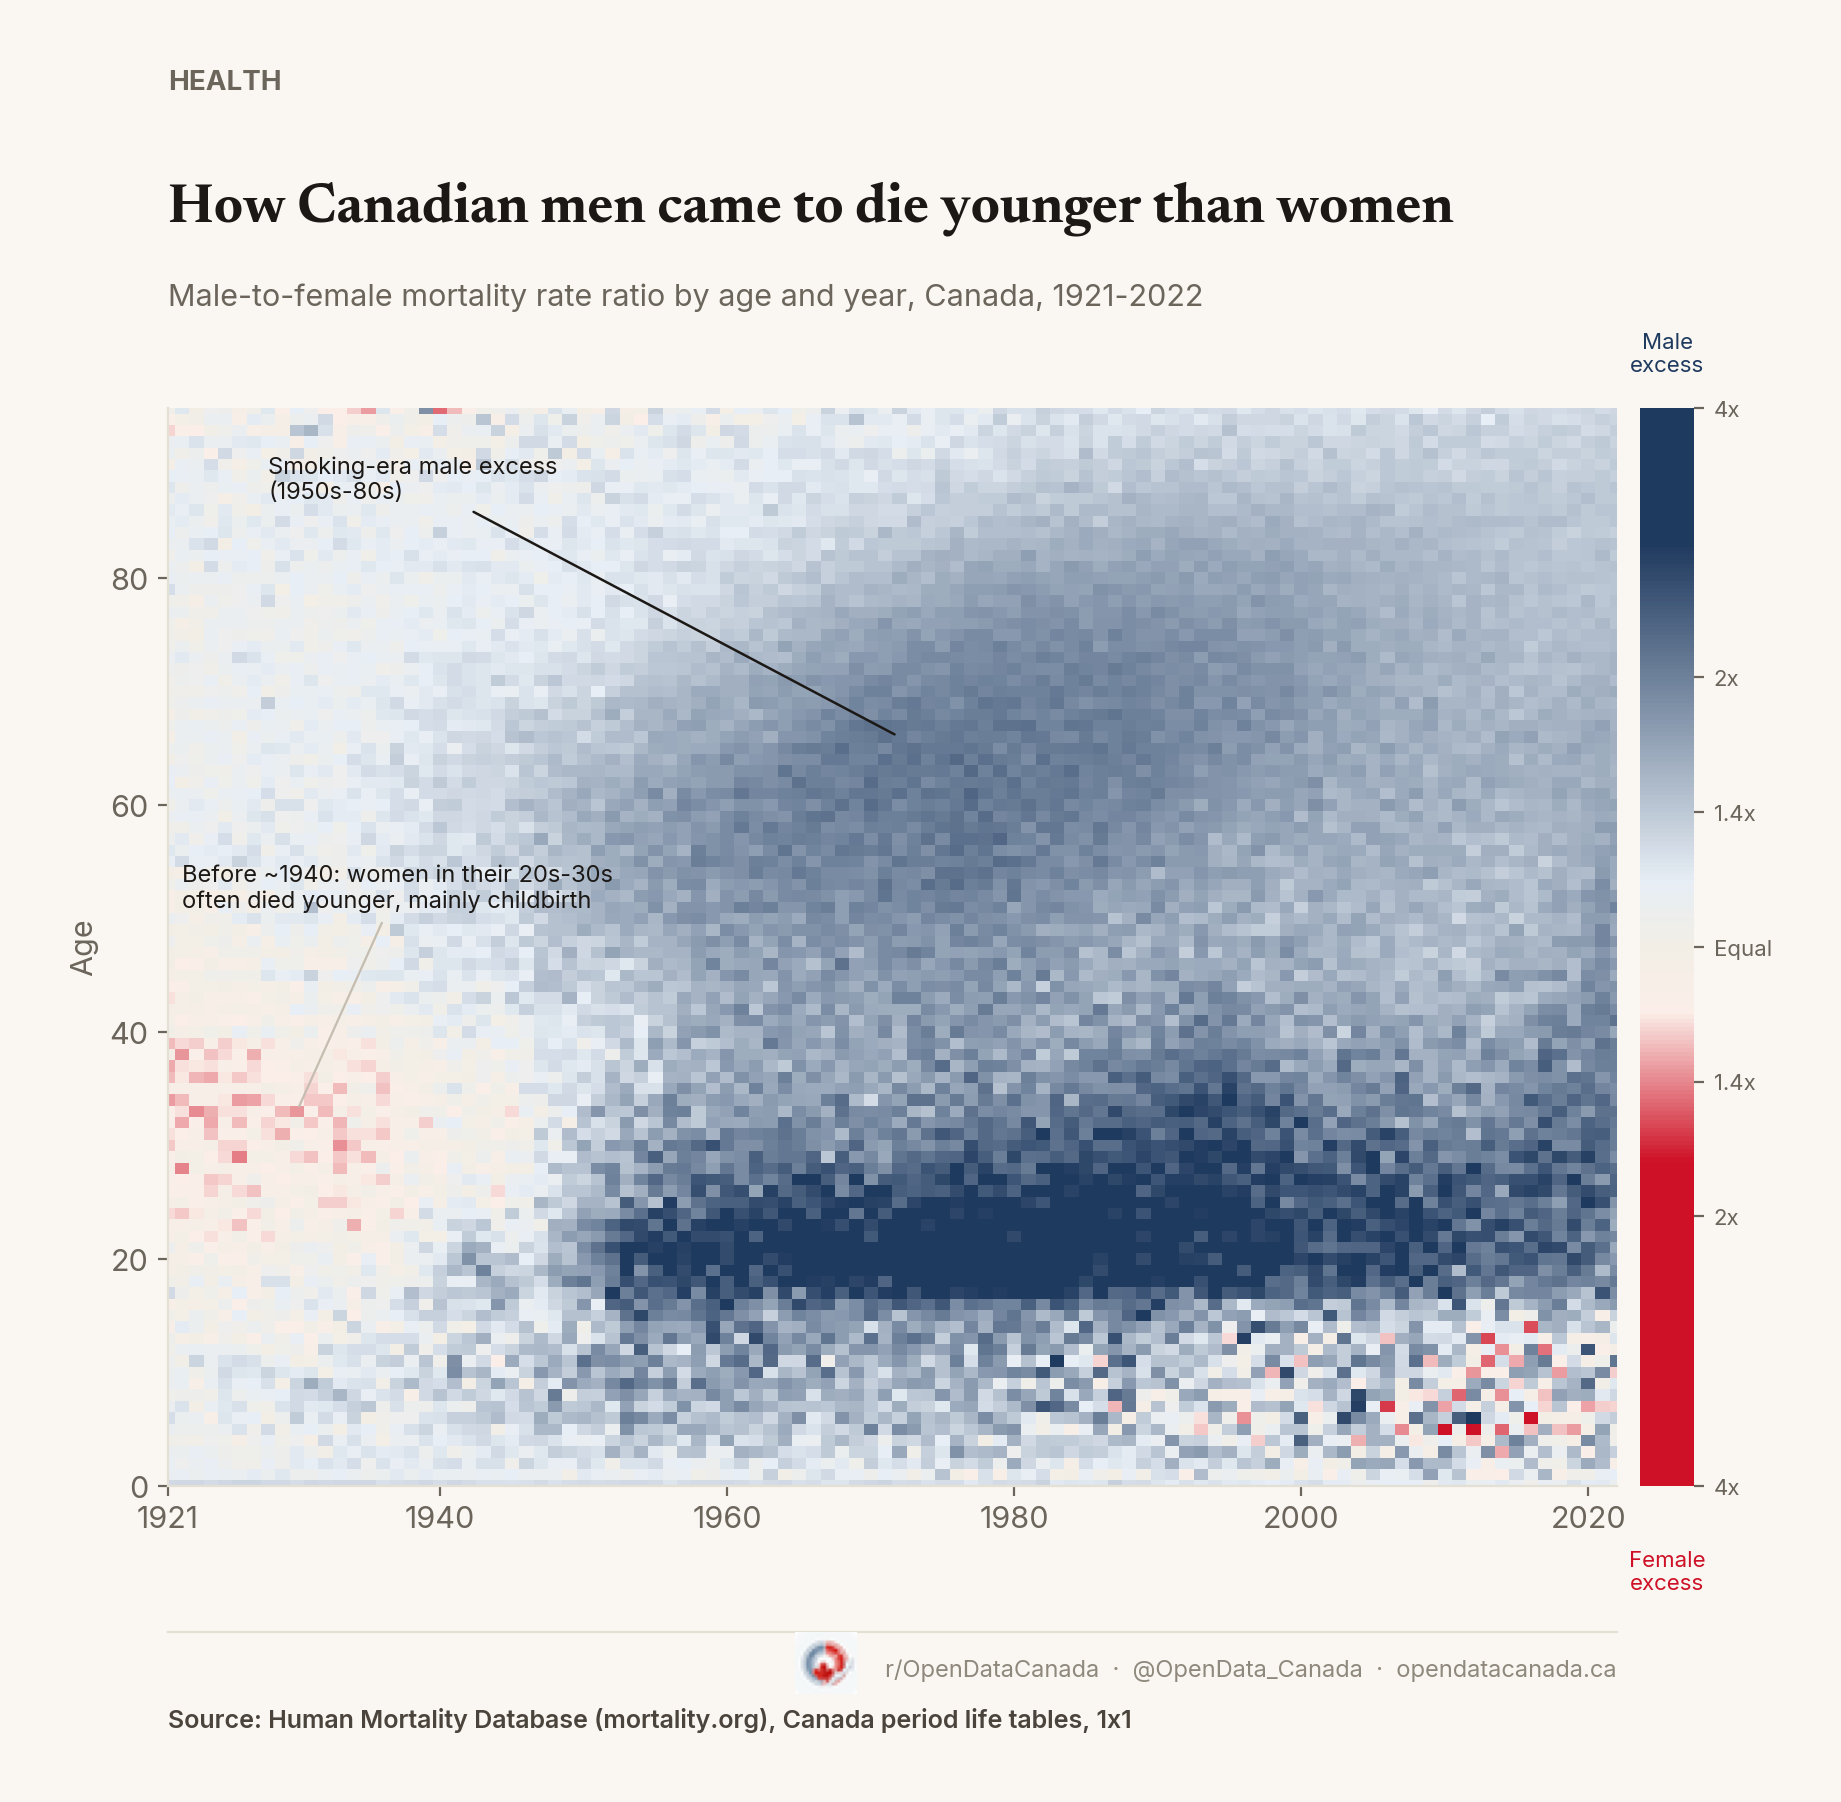
Every cell in that chart is the same calculation: divide the death rate for men at a given age in a given year by the death rate for women at that age in that year. Above the midpoint, men died at a higher rate. Below it, women did. A hundred years of Canadian data, one number repeated 9,792 times.
The pattern it draws is a reversal, not a constant. In the 1920s and 1930s, women in their 20s and 30s died at rates that ran roughly 5-20% higher than men the same age, with some individual ages and years higher still; that pink band across the chart's early decades is Canada before antibiotics, blood transfusion, and modern obstetric care made childbirth survivable, a pattern historical demographic research attributes largely to maternal mortality and infection rather than something this chart's all-cause data can isolate on its own. By the late 1930s the two lines had crossed, and the age band as a whole has not crossed back since, though a handful of individual ages still dipped below parity for a few more years into the early 1940s.
What replaced it was worse for men, and much longer-lasting. Through the 1950s to the 1980s, a fog of navy spreads across almost every age band. Historical research links this in part to smoking, established in both sexes but far more heavily among men in that era, which is credited with pushing heart disease and cancer deaths higher for men across middle and old age; the mortality data alone can't isolate smoking's specific share from other causes. The gap peaked among men in their early 20s: in 1982, a 22-year-old Canadian man was 4.4 times as likely to die that year as a 22-year-old woman.
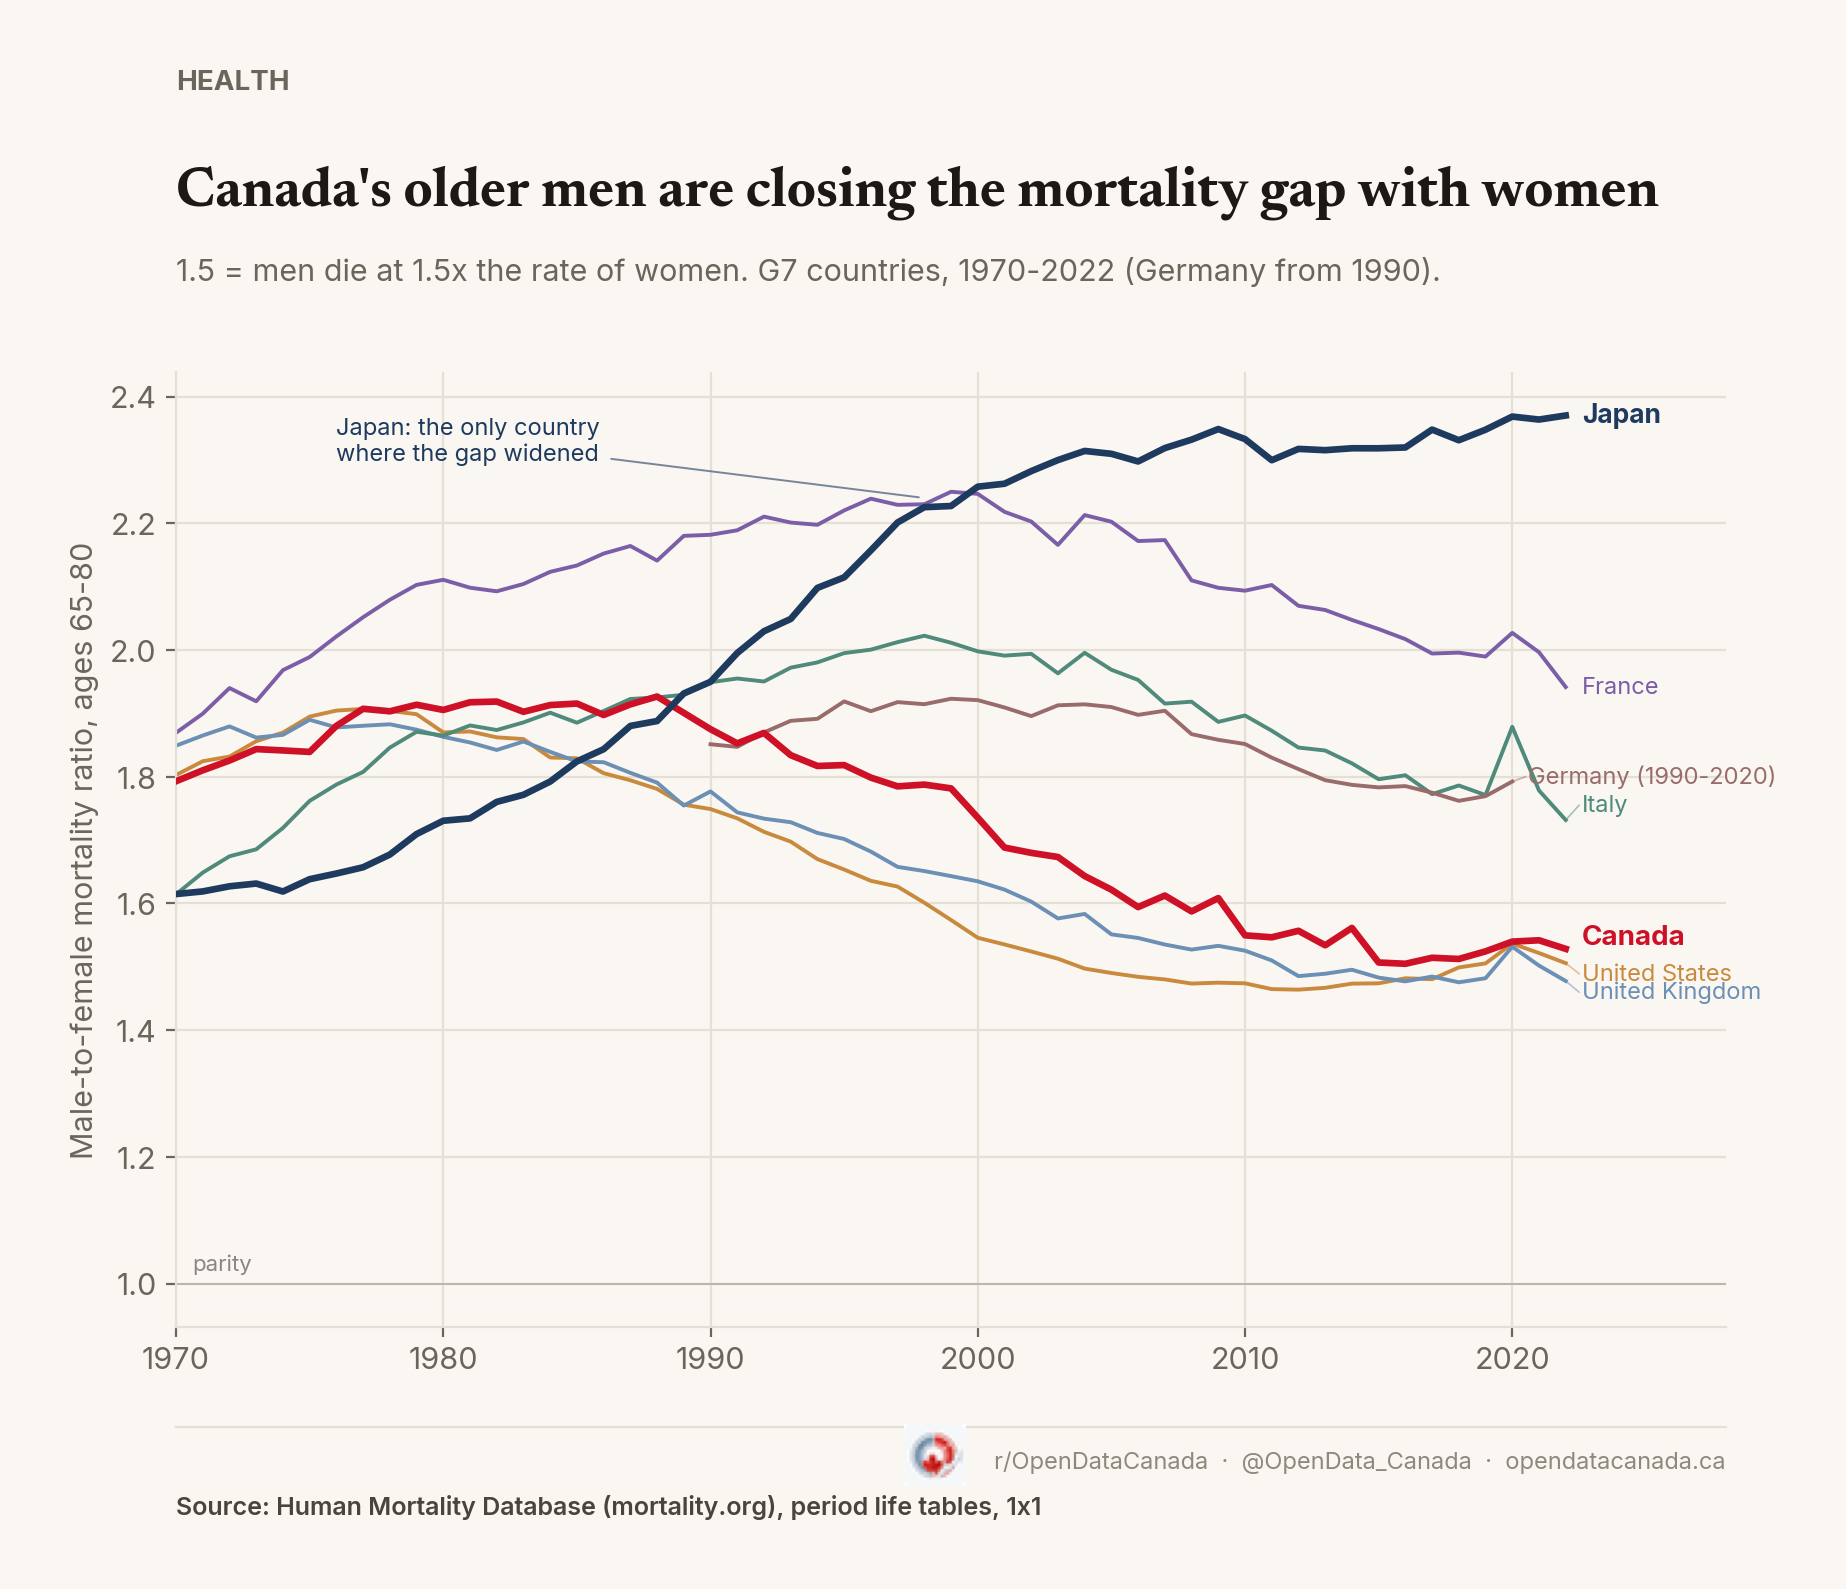
Two threads run through the decades since. Among older men, the gap has been narrowing: averaged across individual ages 65-80, the male-to-female ratio has fallen from 1.79 in 1970 to 1.53 in 2022, a decline that roughly tracks the falling male smoking rate over the same period, though this chart's all-cause data can't confirm smoking as the cause on its own. Comparing that trend across the G7 found Japan's gap widening sharply while other G7 countries' trends varied. Among men in their 20s, it has barely moved: averaging 2.5-times in the 2000s, still 2.3-times across 2011-2022, a gap that Statistics Canada and Carleton's own cited research attribute mainly to external causes such as vehicle collisions, workplace injury, suicide, and overdose rather than disease, at rates well above the female equivalent for the same causes in that age group.
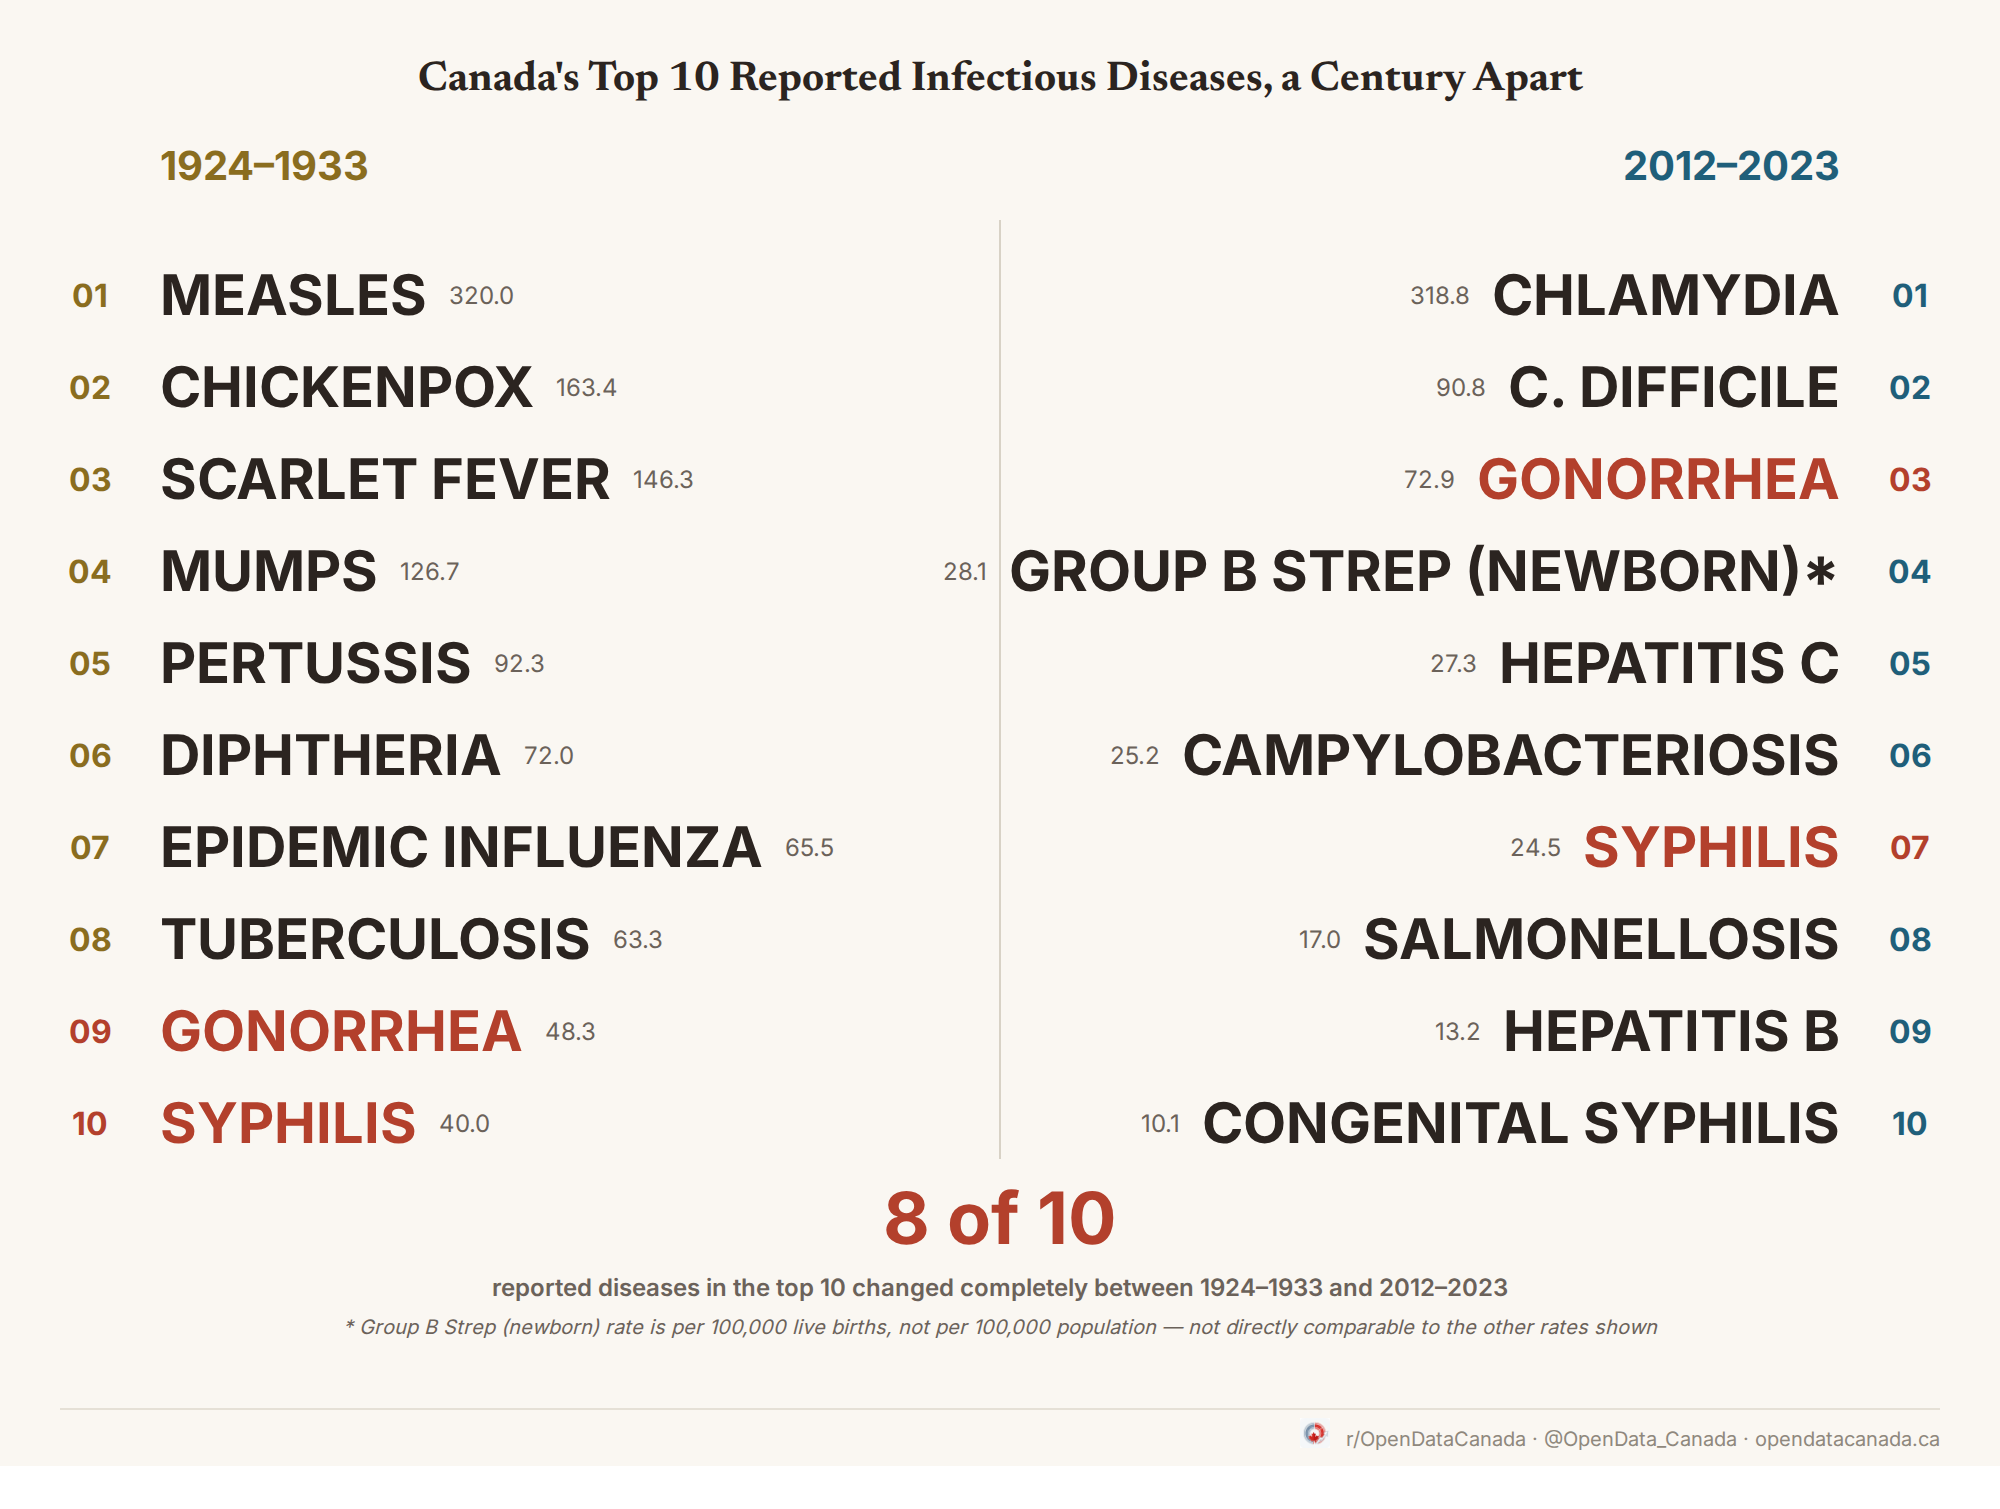
This chart was prompted by a mortality-visualization report from Carleton University's Spatial Determinants of Health Lab. Its Figure 4, the same sex-ratio Lexis surface reproduced here, was itself built entirely from public Human Mortality Database data. Other figures in that report, comparing mortality by cause and by neighbourhood deprivation, drew on restricted Statistics Canada microdata available only inside Carleton's Research Data Centre. The version above rebuilds the sex-ratio surface independently from HMD, using its own age range and colour scale. We've also compared Canada's leading infectious diseases a century apart.