Health · A Century of Notifiable Disease
Canada's Top 10 Reported Infectious Diseases, 100 Years Ago and Today
Comparing Canada's leading reported notifiable diseases from the 1920s and 30s to the last decade, only two names appear on both lists. Everything else near the top changed completely, and the disease that currently tops it is reported at almost the exact same rate as the disease that topped it a century ago.
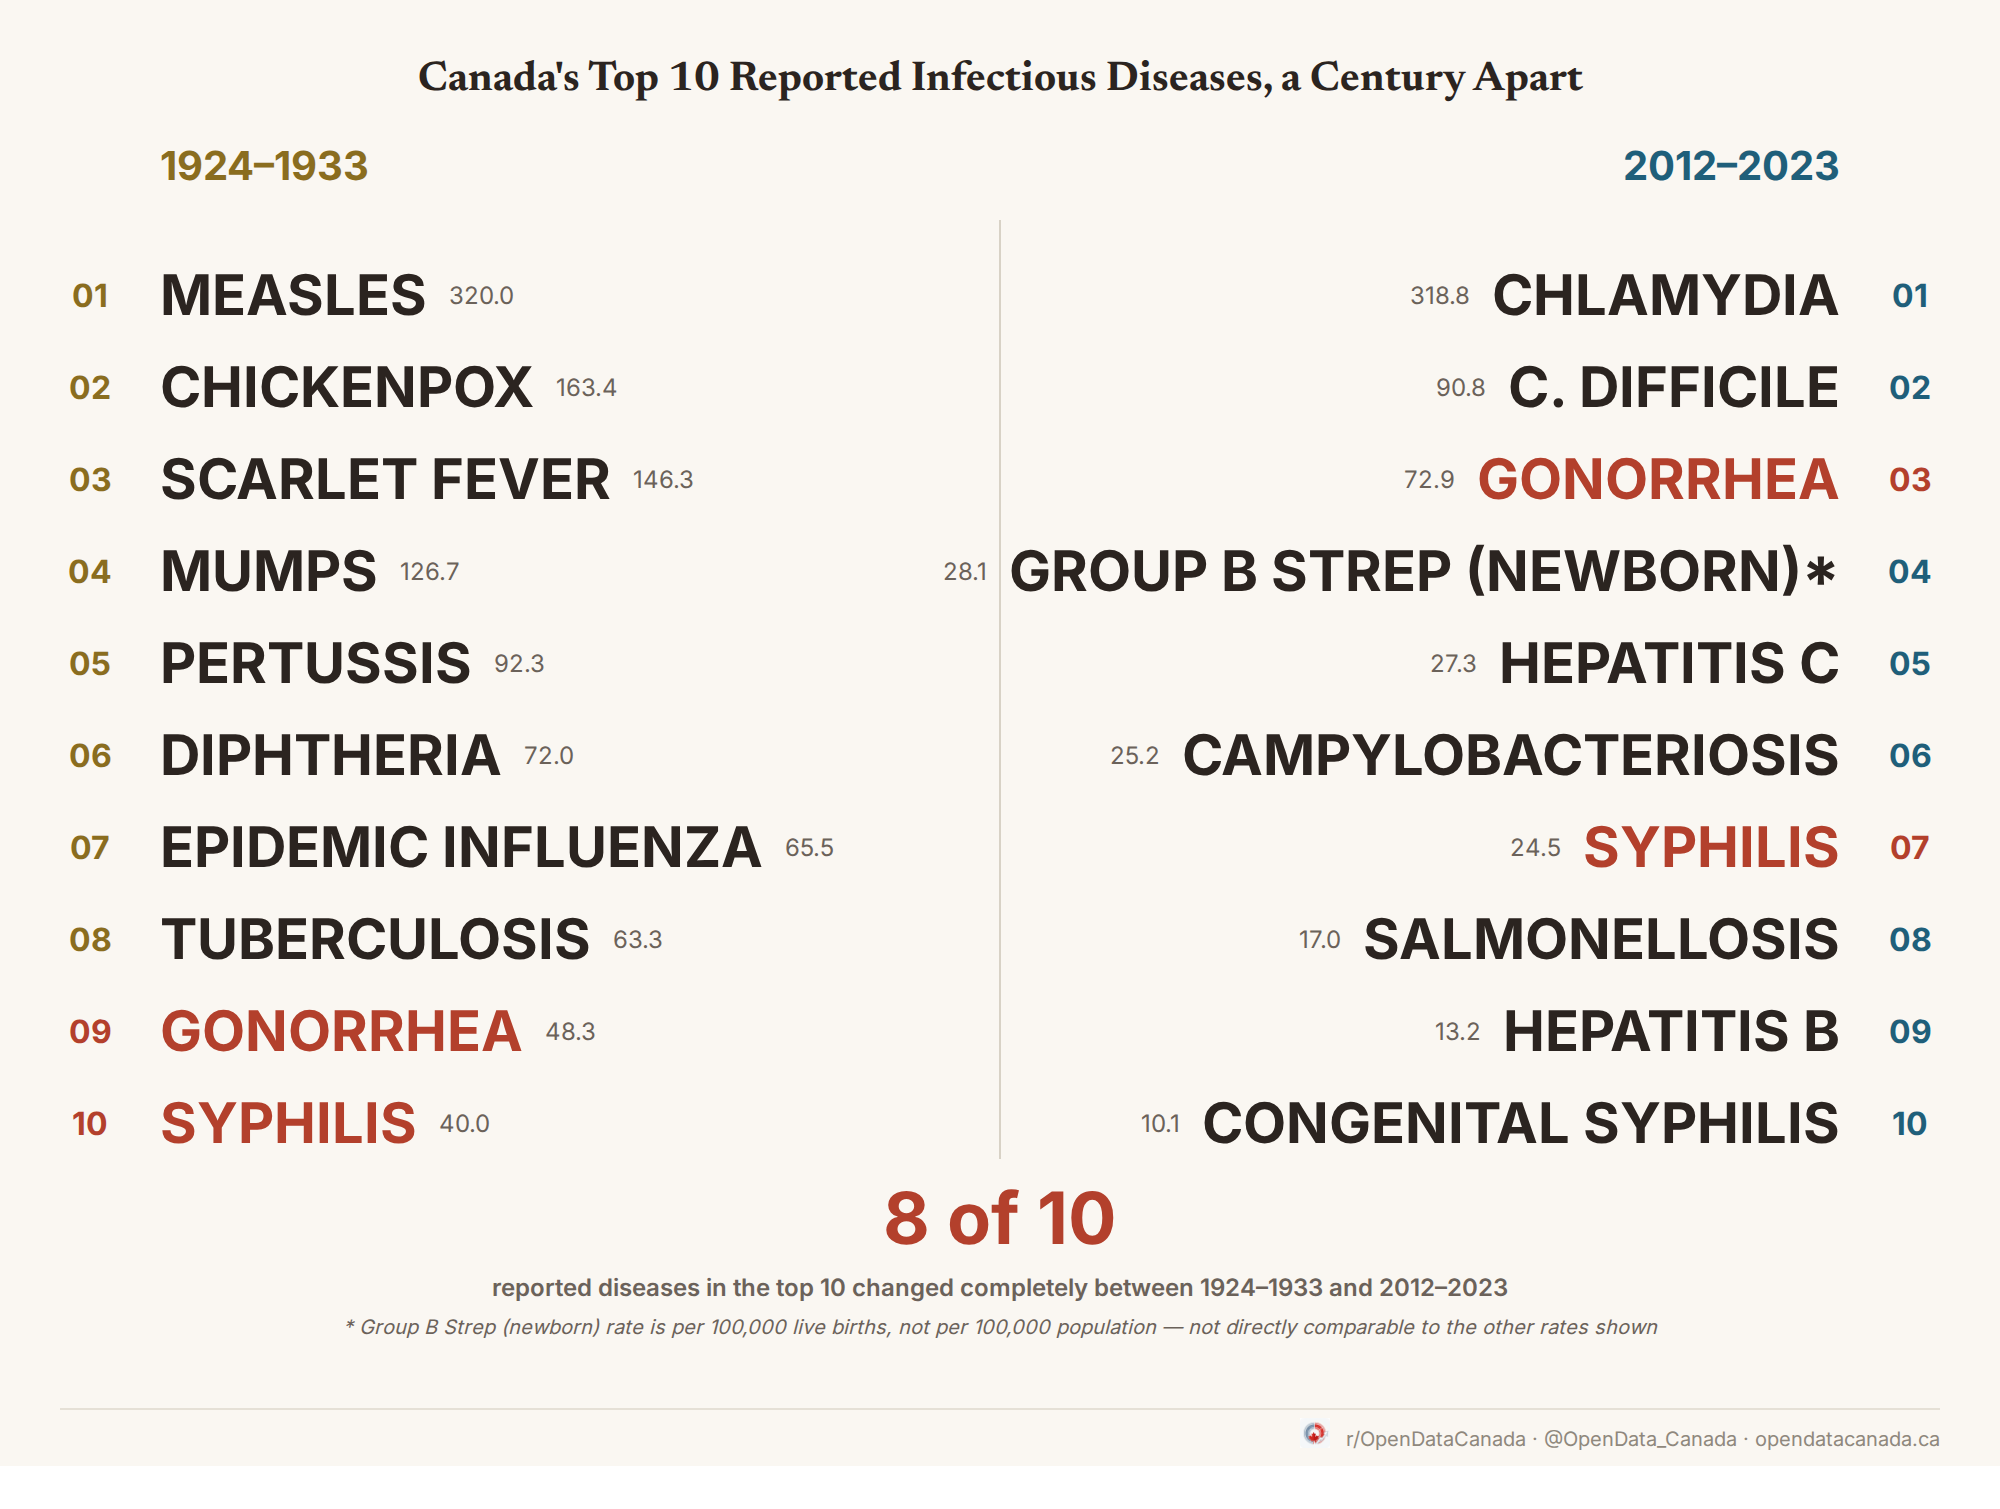
In 1924 to 1933, the most-reported disease in Canada was measles, averaging 320.0 cases per 100,000 people a year. In 2012 to 2023, the most-reported disease was chlamydia, averaging 318.8 per 100,000. The two numbers are a near-exact match, a century apart, between a childhood virus eliminated by vaccination and a bacterial STI that was not nationally notifiable until 1991.
That coincidence is a striking way into the data, but it is not the real finding. The real finding is what happens when you look past the top spot to the full top ten.
One disease that will not appear anywhere in this article: COVID-19. PHAC tracks it through a separate surveillance system, not the notifiable-disease series this comparison is built from, so it is excluded here rather than mixed in on a basis that isn't comparable to the rest.
1924–1933
- Measles — 320.0 per 100,000
- Chickenpox — 163.4
- Scarlet fever — 146.3
- Mumps — 126.7
- Pertussis (whooping cough) — 92.3
- Diphtheria — 72.0
- Epidemic influenza — 65.5
- Tuberculosis — 63.3
- Gonorrhea — 48.3
- Syphilis — 40.0
2012–2023
- Chlamydia — 318.8 per 100,000
- C. difficile — 90.8
- Gonorrhea — 72.9
- Group B strep (newborn)* — 28.1
- Hepatitis C — 27.3
- Campylobacteriosis — 25.2
- Syphilis — 24.5
- Salmonellosis — 17.0
- Hepatitis B — 13.2
- Congenital syphilis — 10.1
Only two diseases, gonorrhea and syphilis, appear on both lists. Eight of the ten slots changed completely: the 1924–1933 list is measles, chickenpox, scarlet fever, mumps, pertussis, diphtheria, epidemic influenza, and tuberculosis; the 2012–2023 list is chlamydia, C. difficile, group B strep, hepatitis C, campylobacteriosis, salmonellosis, hepatitis B, and congenital syphilis. None of those eight names carries over. And neither gonorrhea nor syphilis is doing the same job on both lists. In 1924 to 1933 they sat at the bottom of the top ten. In 2012 to 2023 they still sit well down the list, not near the top. They survived, but they never led.
Why "reported" is carrying most of the weight here
None of this measures how much disease Canadians actually had in either period. It measures how much disease got reported to national surveillance in either period, and those are not the same thing.
Gonorrhea and syphilis have been nationally notifiable since 1924, the earliest year in this comparison, which is part of why they show up in both lists at all: diseases that were never counted can't appear. Chlamydia, by contrast, only became nationally notifiable in 1991. The Public Health Agency of Canada has said that improved detection methods, including nucleic acid amplification testing introduced in the mid-1990s, contributed to the rise in reported chlamydia rates that followed. Easier testing means more cases get found and reported; it does not on its own tell you how much the underlying infection rate actually moved.
The same caution applies in the other direction. Measles, mumps, and the other childhood diseases in the 1924 to 1933 list were tracked under surveillance systems, case definitions, reporting practices, and notification rules that have all changed repeatedly over the past hundred years.
So the finding here is not that Canada's disease burden held steady, and it is not that chlamydia "is" the new measles. It is narrower and more defensible than either of those: 8 of Canada's top 10 reported notifiable diseases changed between 1924–1933 and 2012–2023, while the reported rate at the very top of the list landed, by coincidence, close to where it started.
What the leaderboard looked like every decade in between
The two snapshots above are 89 years apart. Stepping through the top 10 decade by decade shows the transition wasn't gradual — a handful of childhood diseases simply drop out of the national data for years at a stretch, then reappear or get replaced outright.
Some of that is a real decline: measles cases fell hard after Canada licensed a vaccine in 1963. But some of it is a tabulation gap, not an epidemiological one. Measles, mumps, chickenpox, and epidemic influenza have literal blank rows — not zero-case rows — in the national series from roughly 1959 through the mid-1960s (mumps and chickenpox stay blank until 1985), and scarlet fever's series stops being reported after 1978, near its peak, not its trough. A disease with too few reported years in a given decade can't be fairly ranked against one with a full ten, so any window where a disease falls under 70% coverage excludes it from that decade's top 10 — but excluding it silently would make it look like the disease vanished. Instead, each chart below lists what was excluded and why, under "Not shown," so a reporting gap never gets mistaken for a real collapse.
The reverse pattern shows up on the other end of the timeline: chlamydia only enters the national data in 1991, Group B strep (newborn) in 2000, and C. difficile in 2009. Their absence from earlier decades isn't decline or gap — those diseases, or that surveillance category, didn't exist as a notifiable line yet.
1924–1933: Measles leads at 320.0 per 100,000.
† partial-window average: Gonorrhea; Syphilis
The animation above steps through the same ten snapshots as the static charts below — useful if you want to see a specific decade at rest, share an image, or read it without JavaScript.
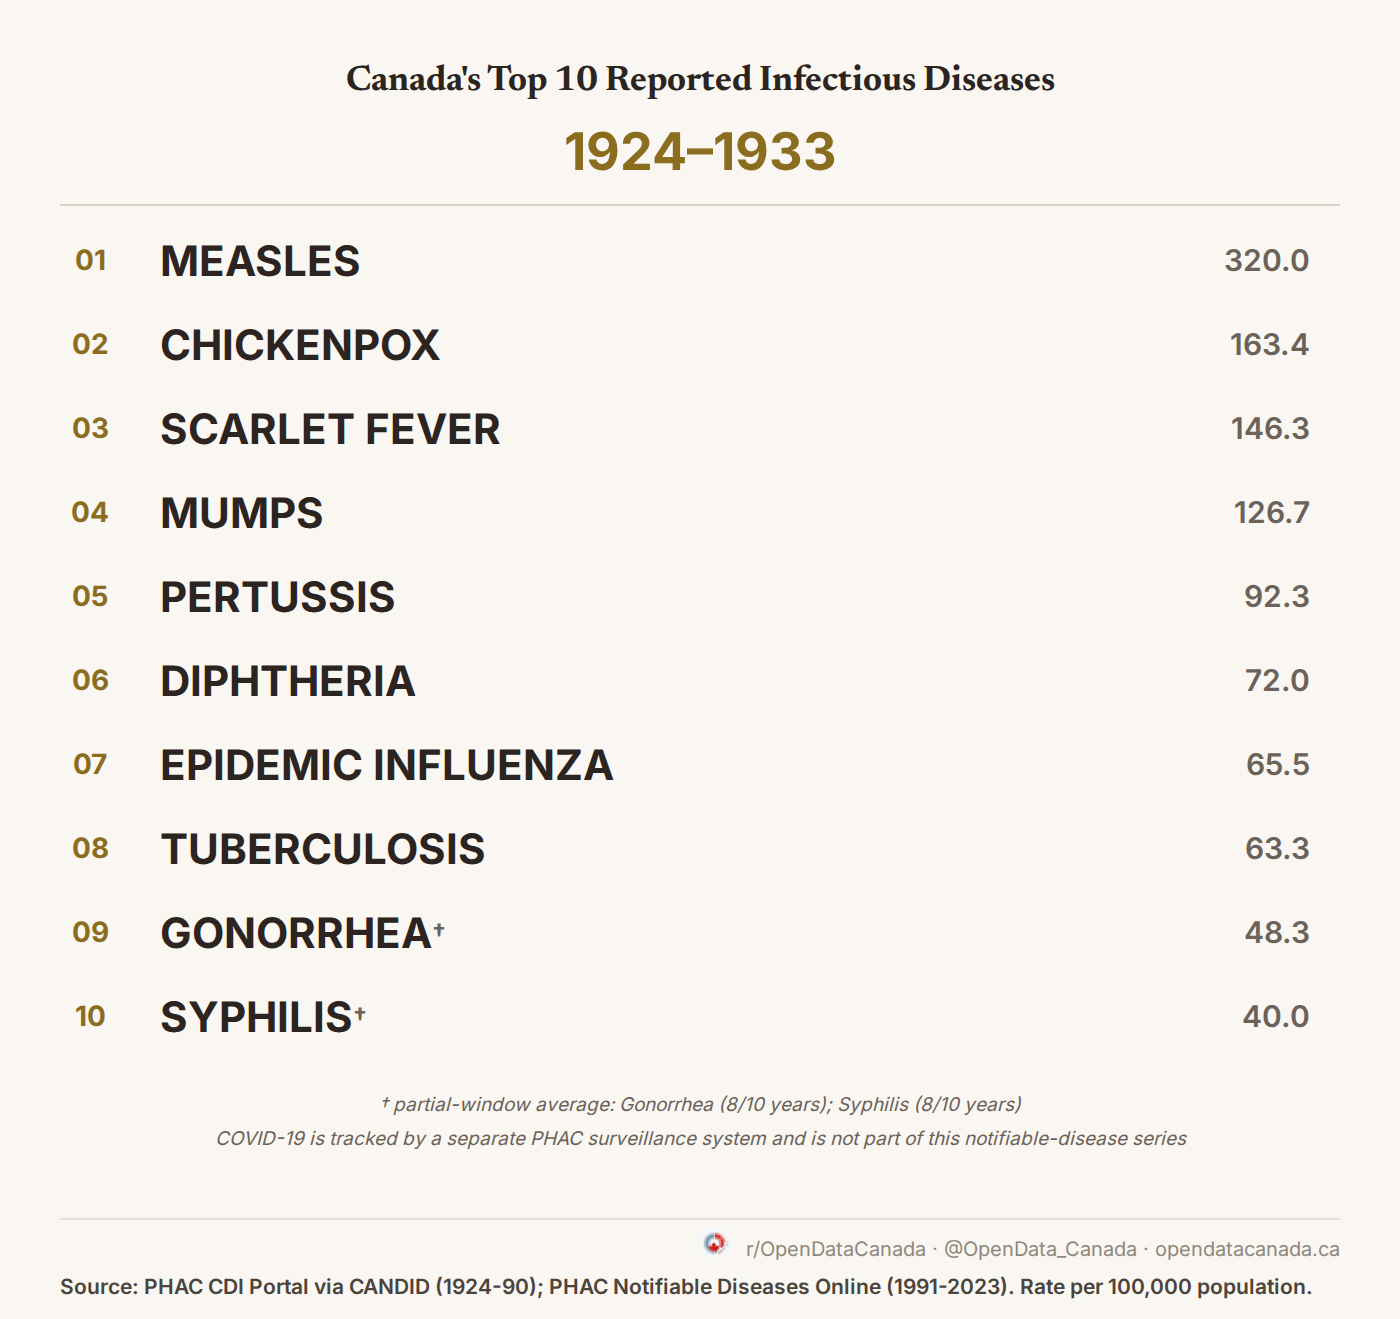
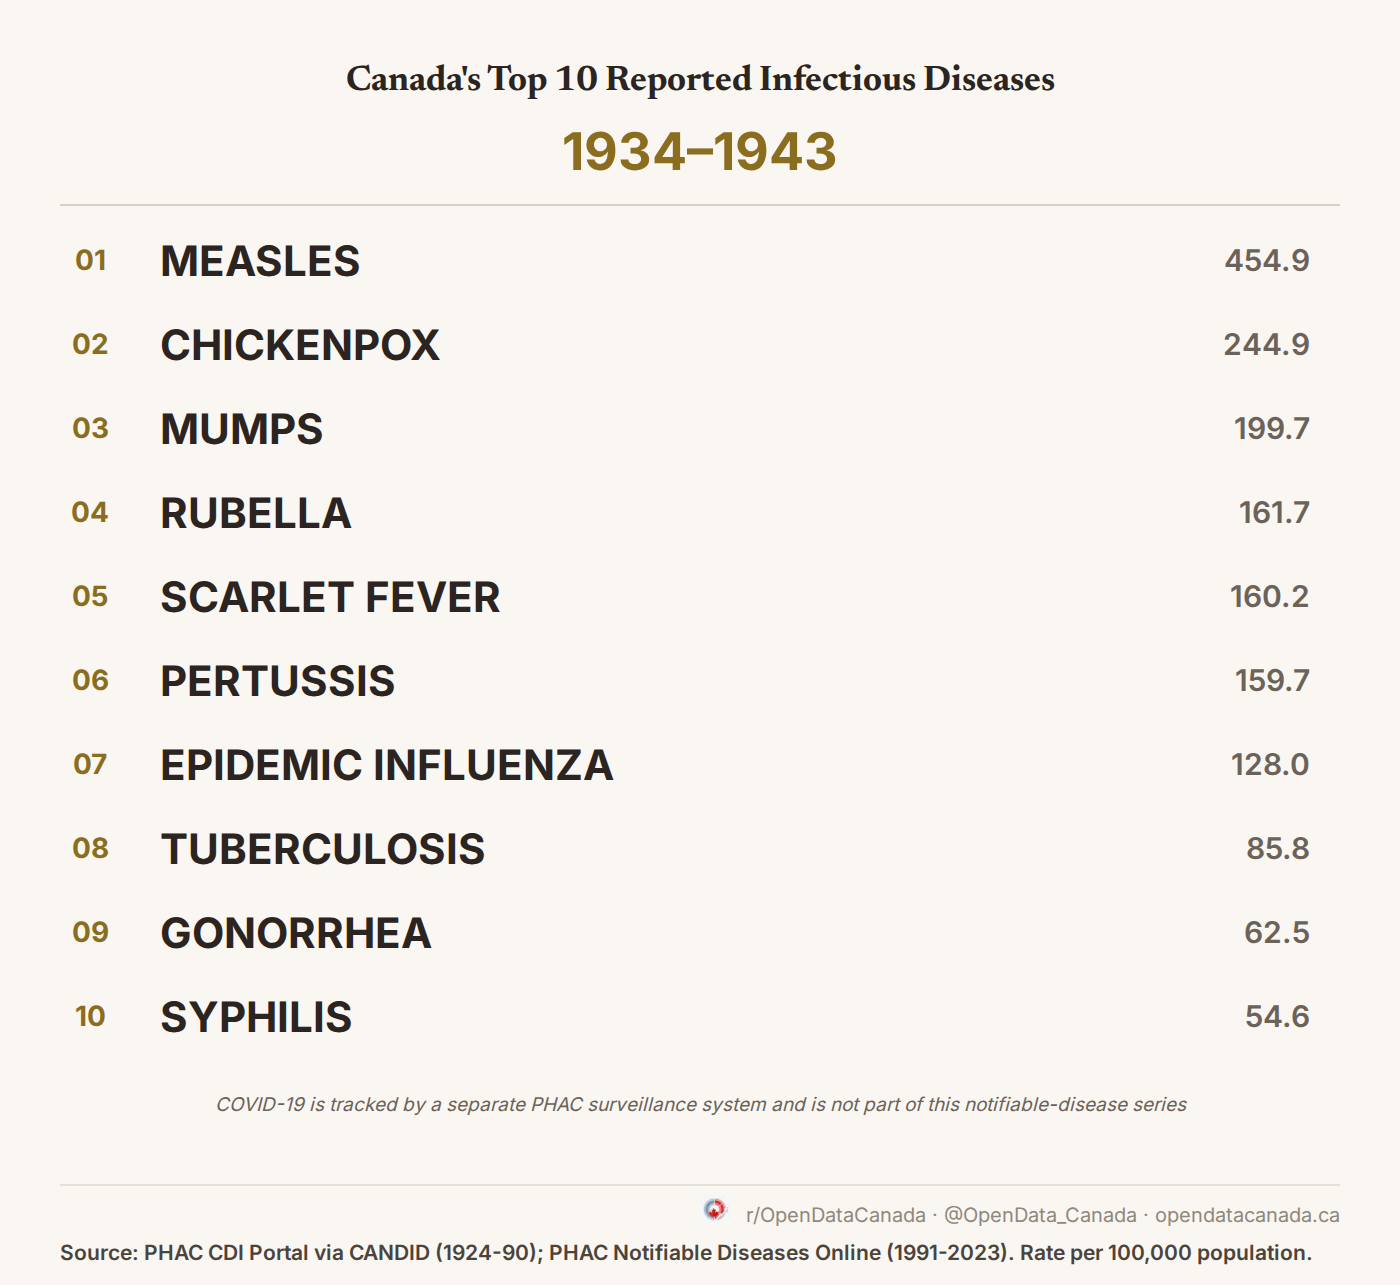
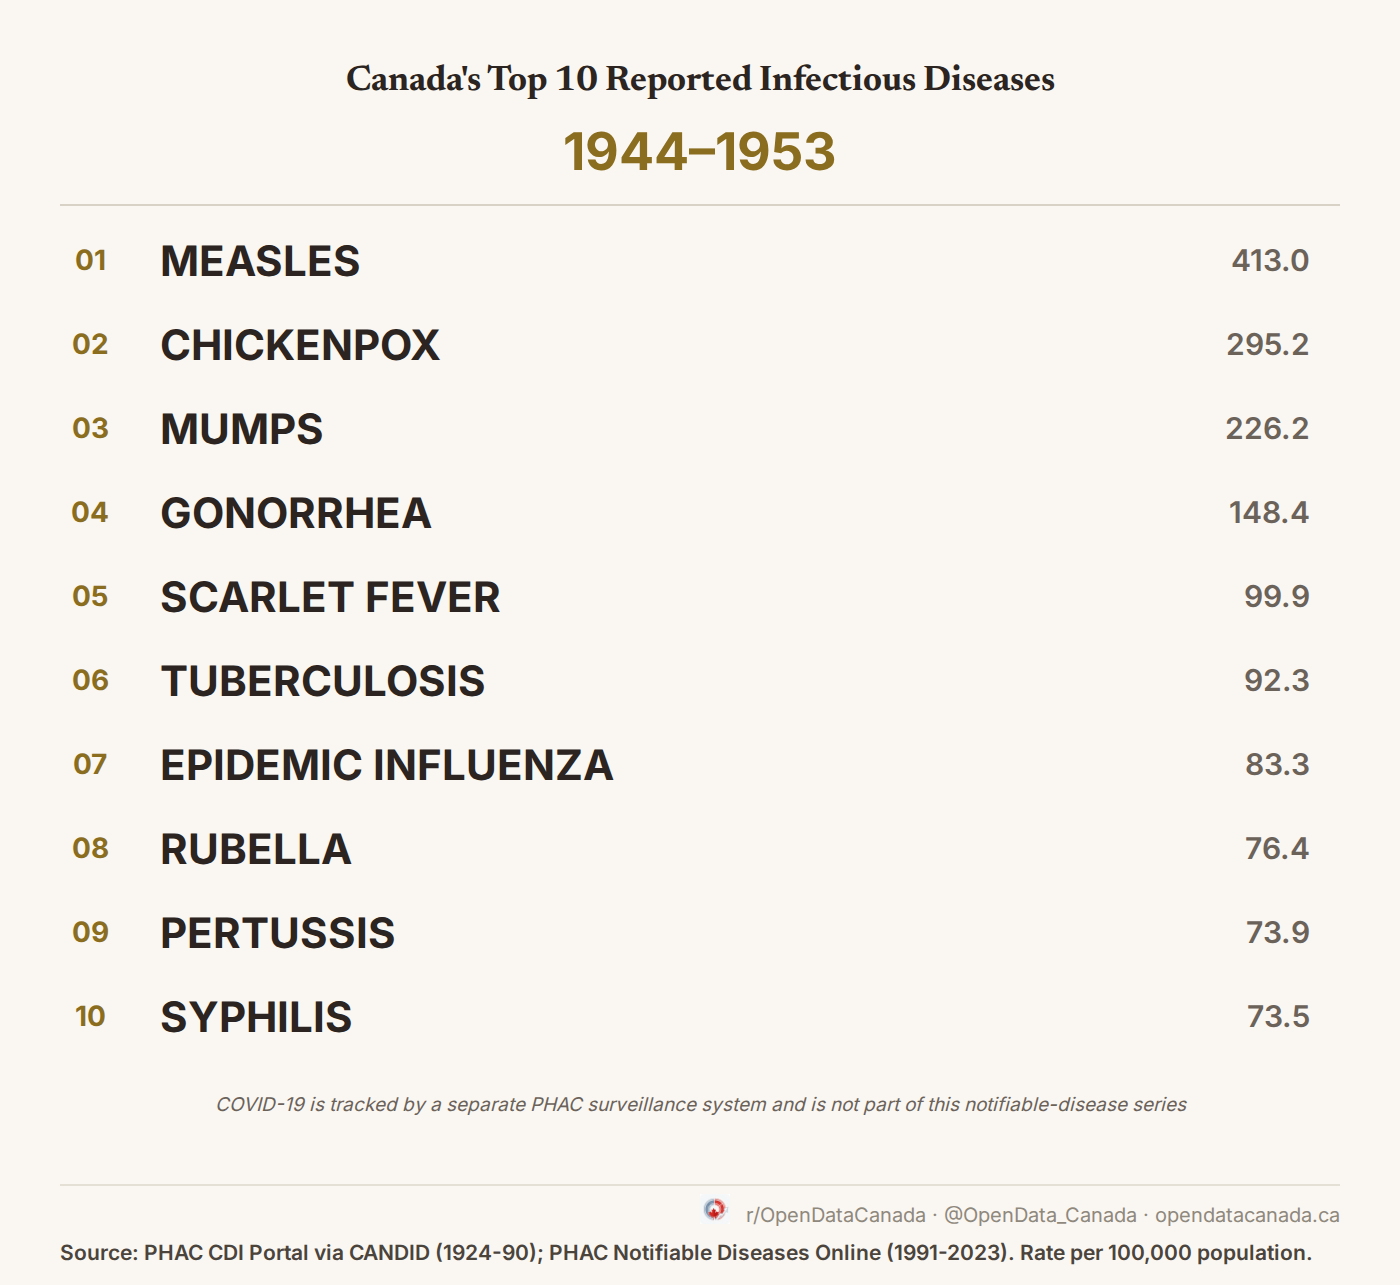
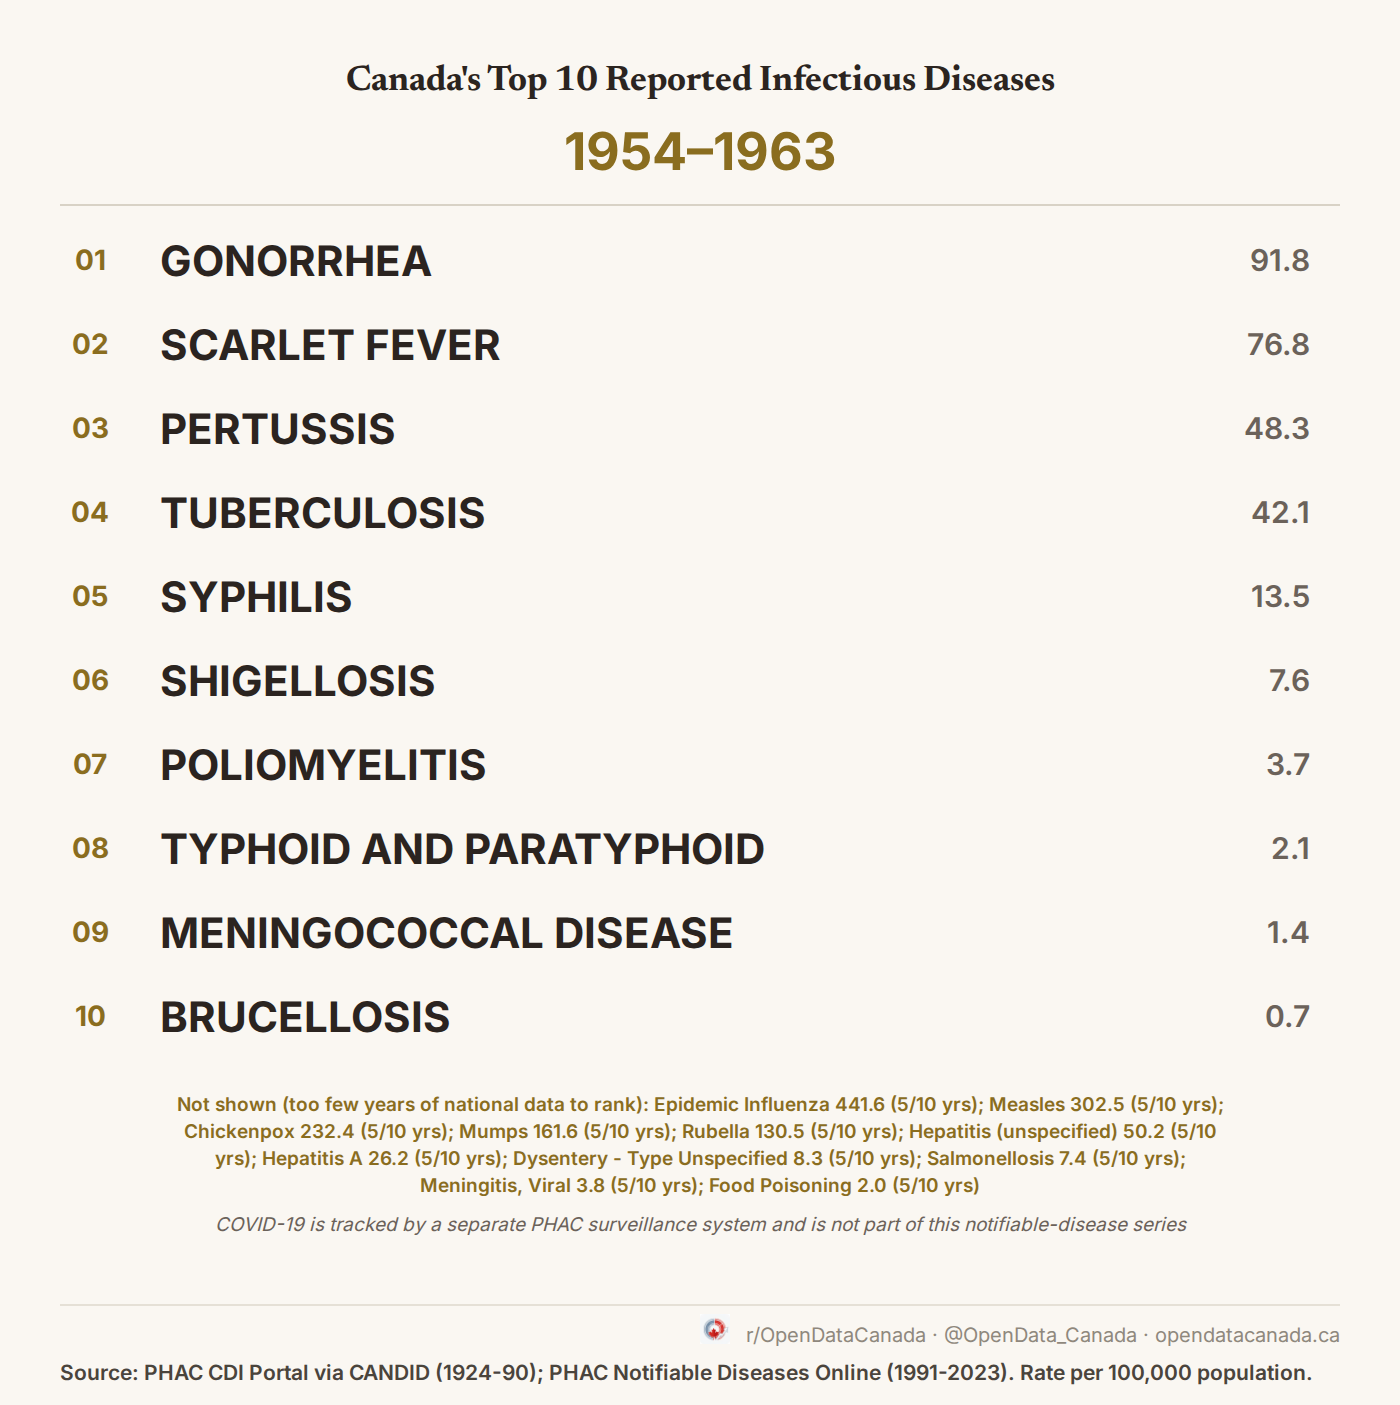
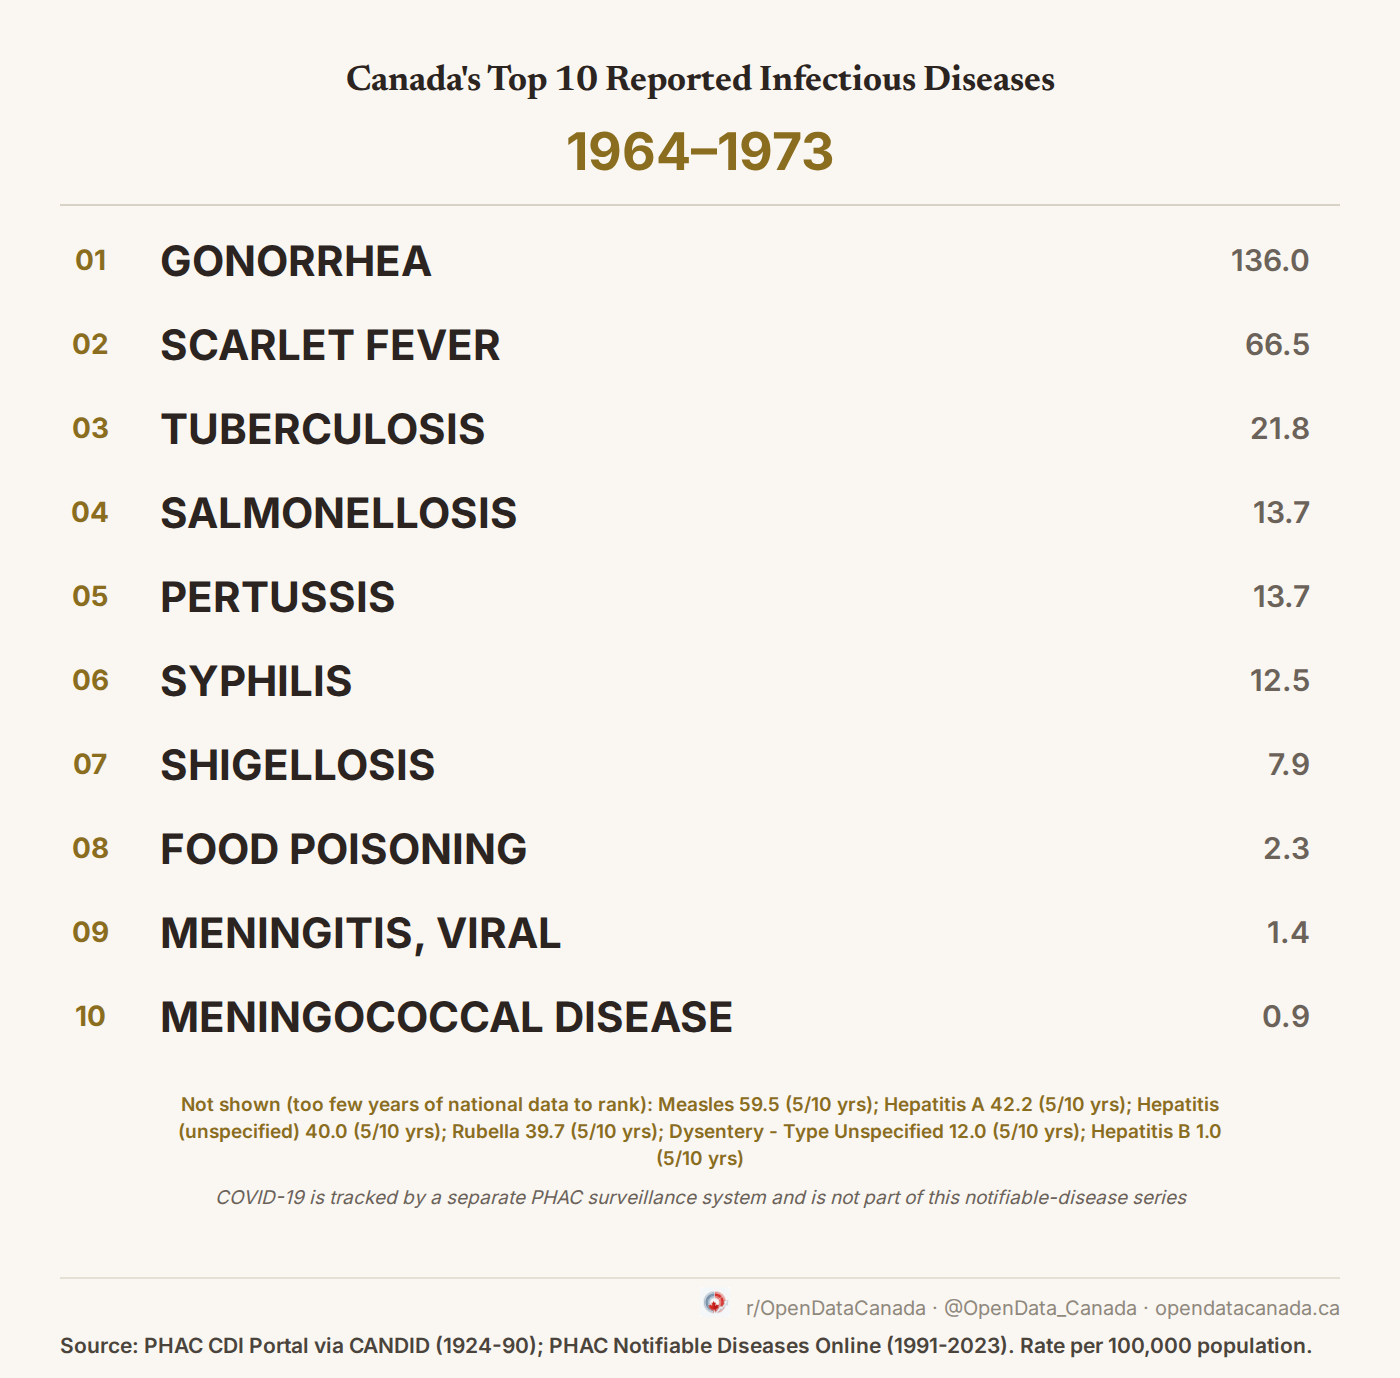
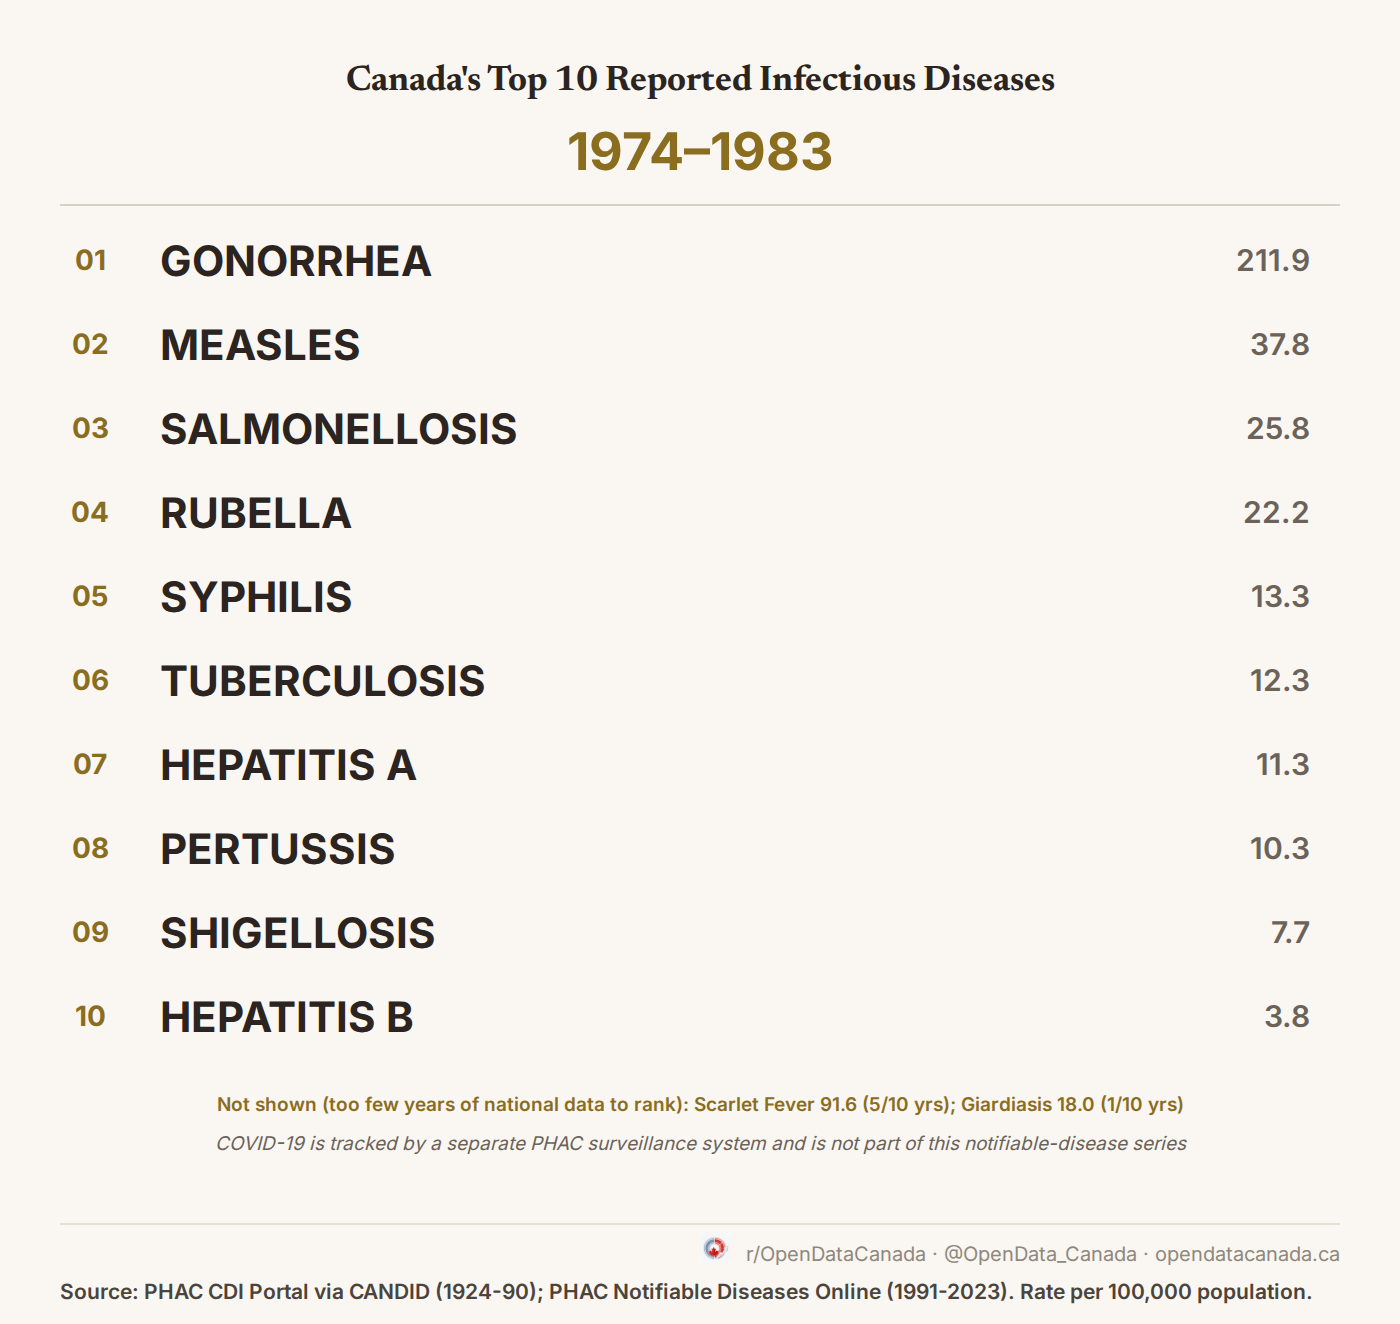
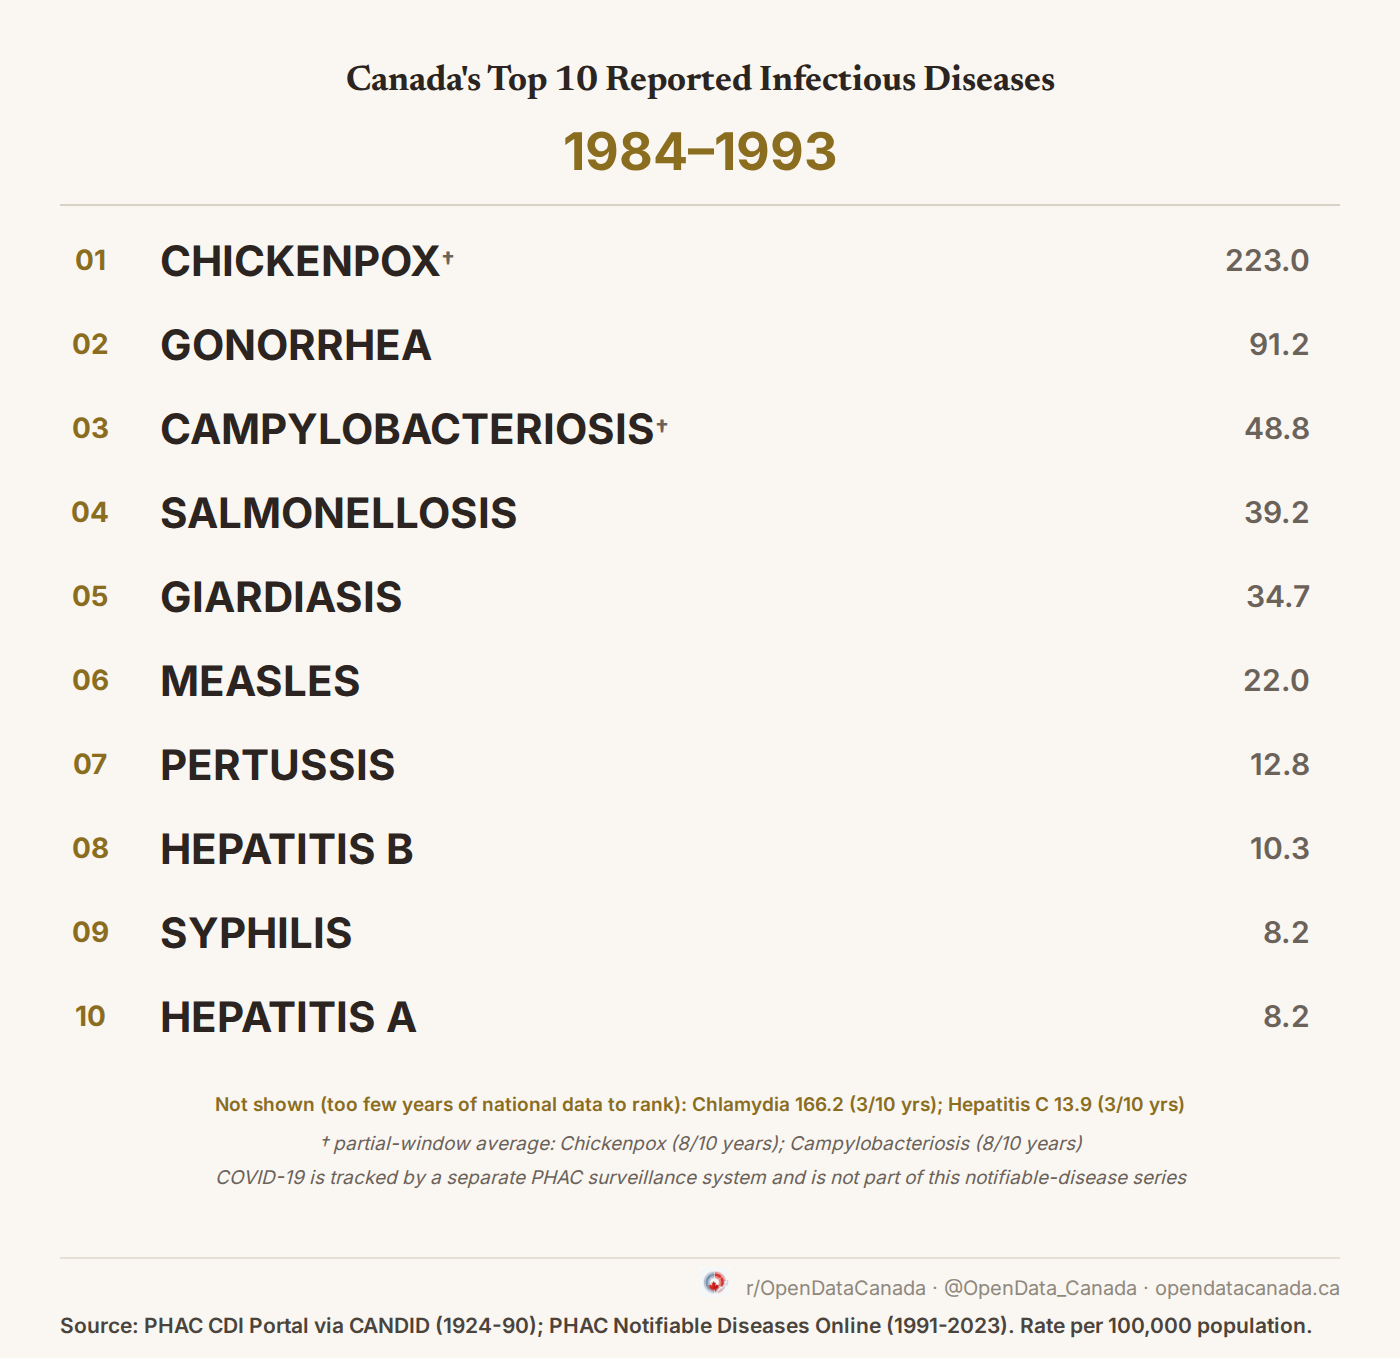
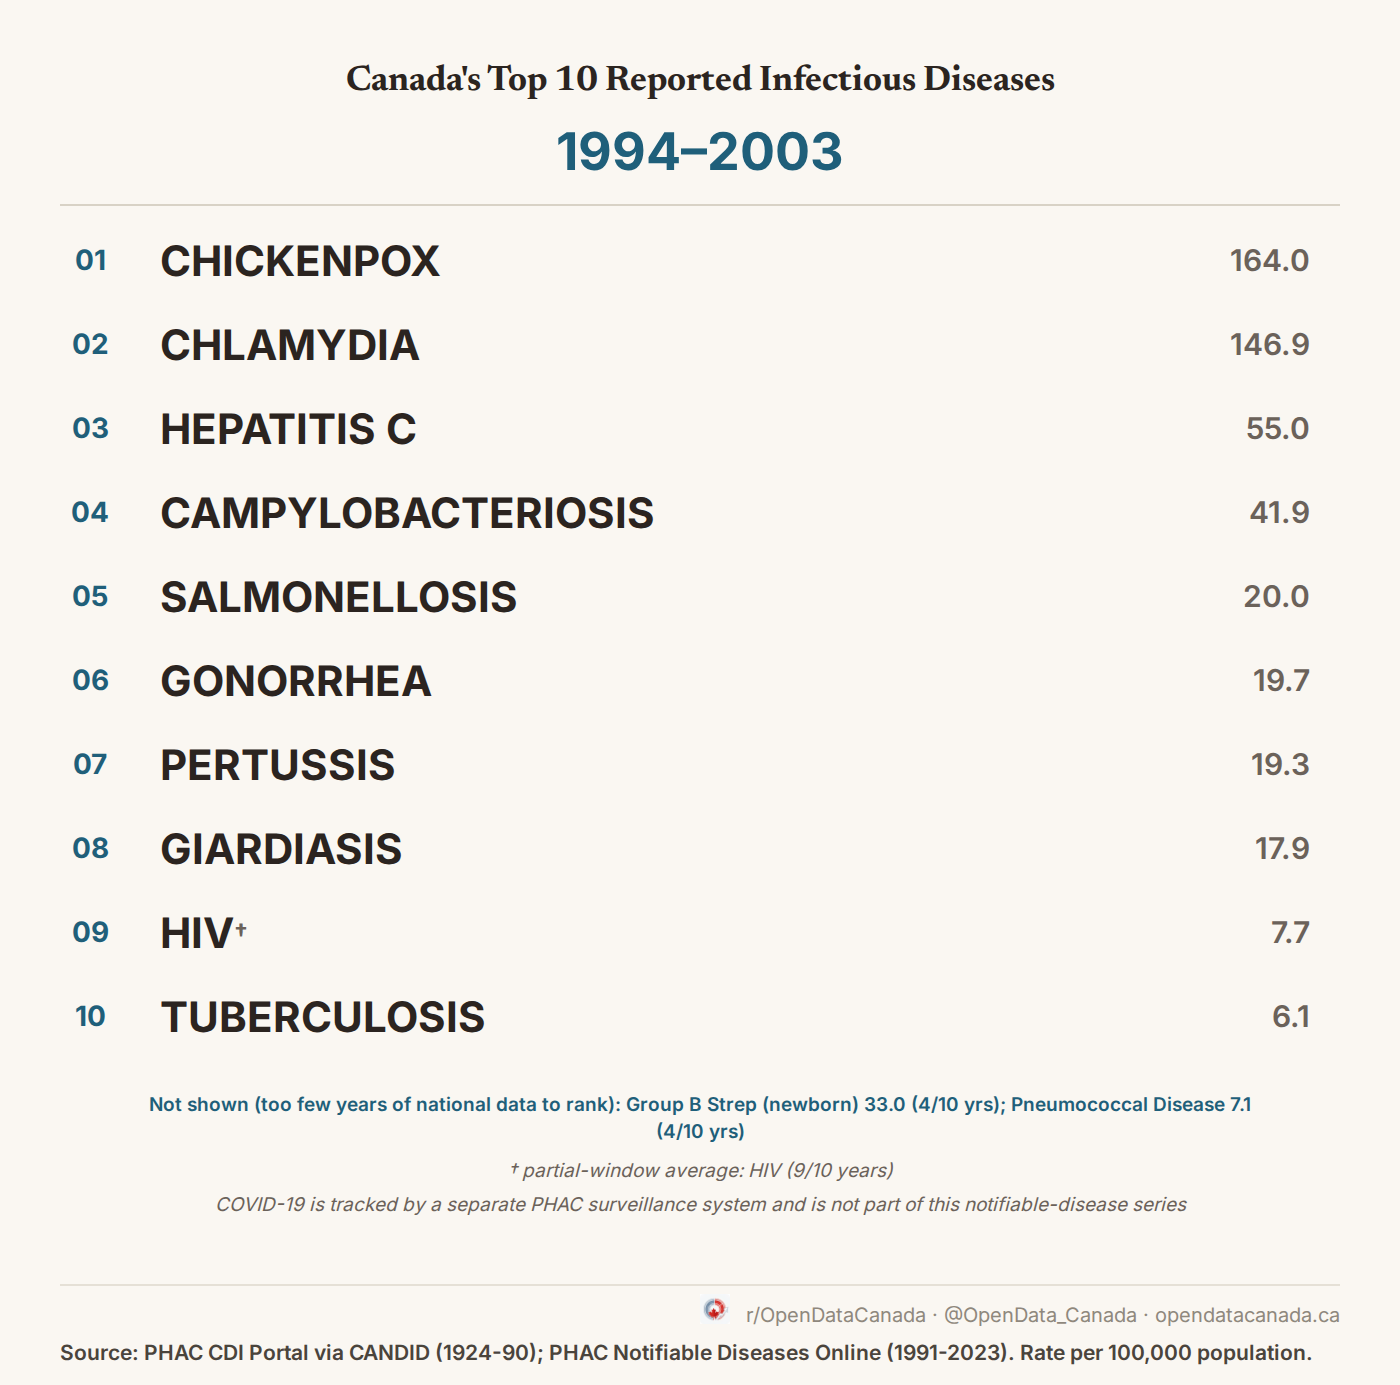
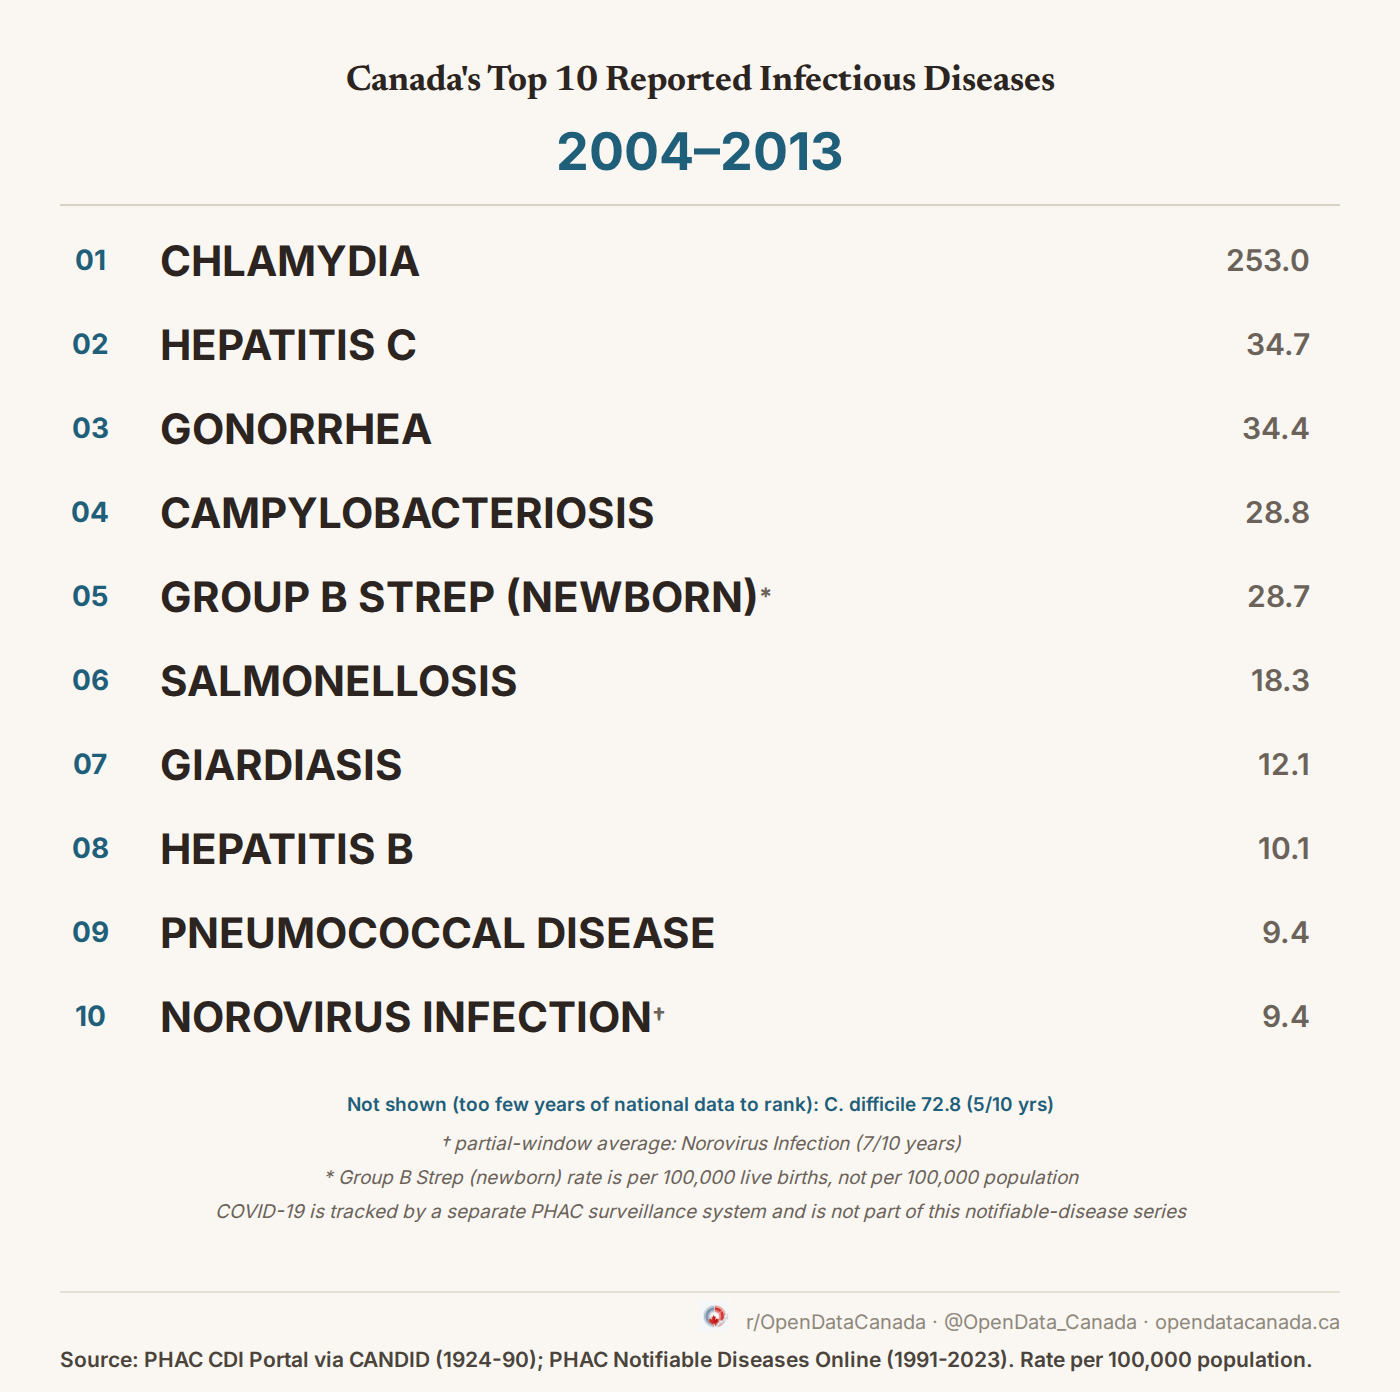
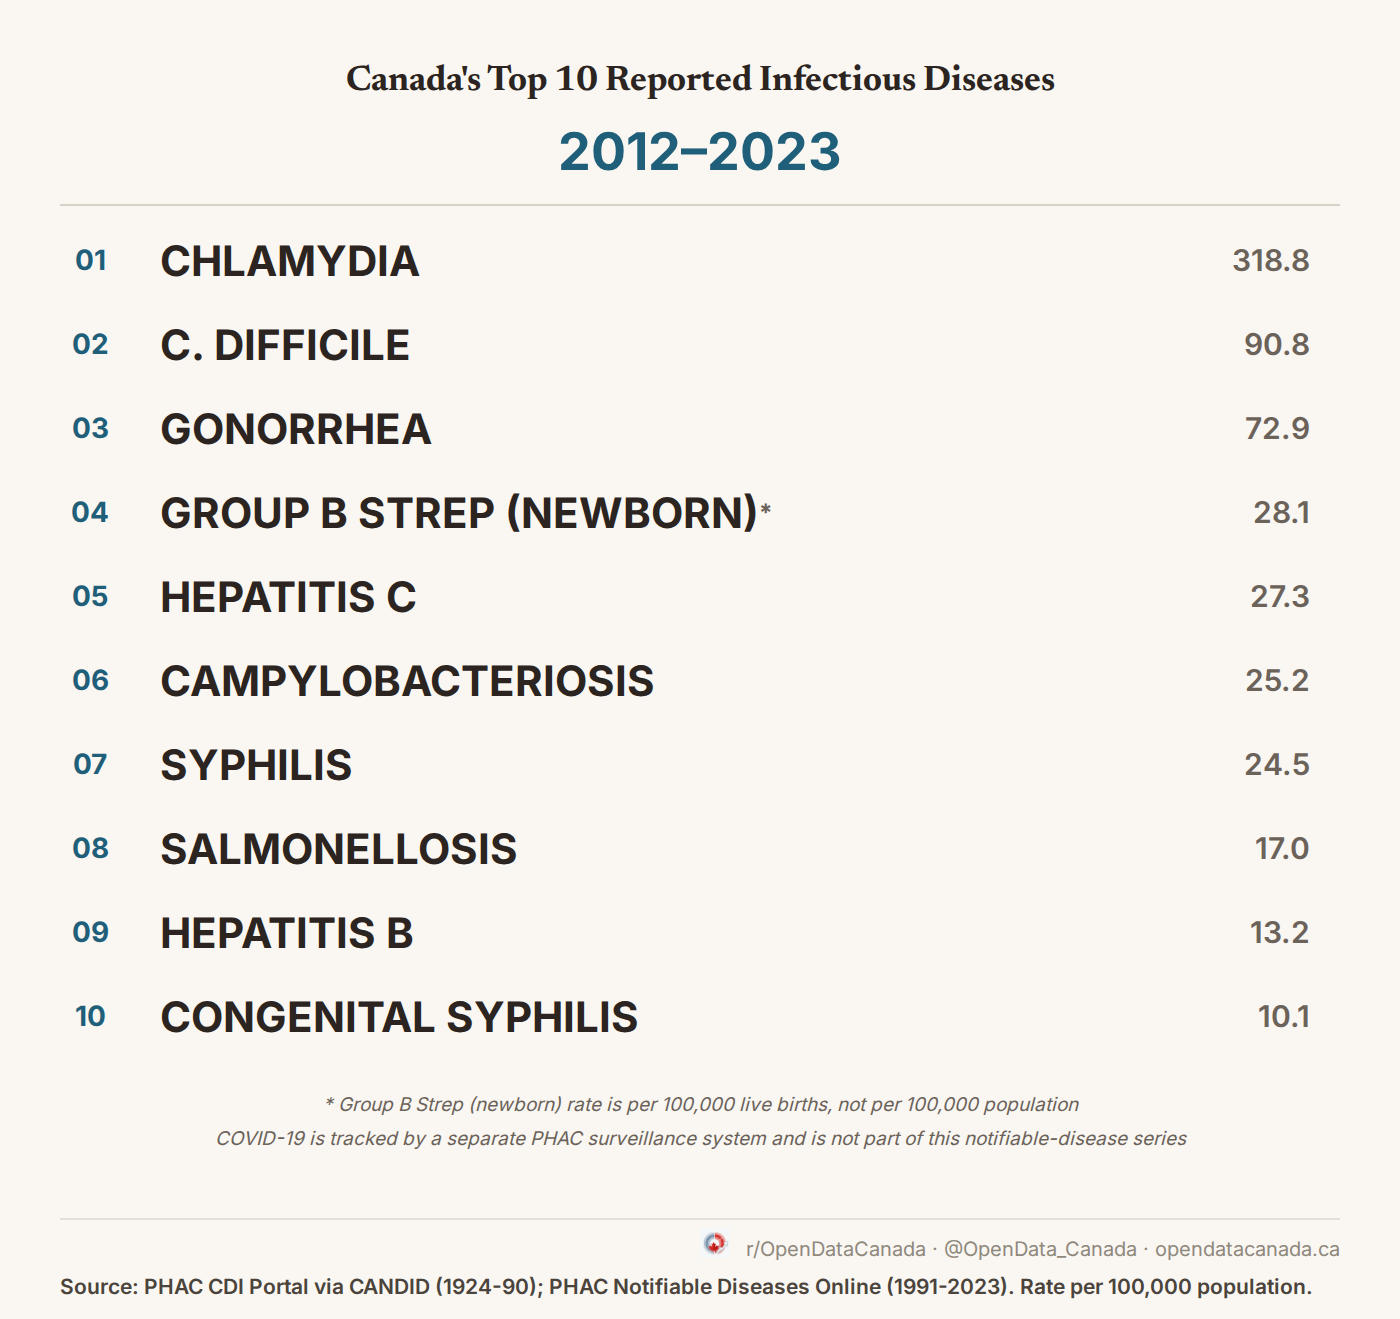
Chart: Open Data Canada. Source: PHAC CDI Portal via CANDID, 1924-90; PHAC Notifiable Diseases Online, 1991-2023. "Not shown" lists diseases excluded from a decade's ranking for insufficient reporting coverage, not absence of disease.