Labour · 6 min read
Canada Produces More Oil Than Ever. The Jobs Haven't Come Back.
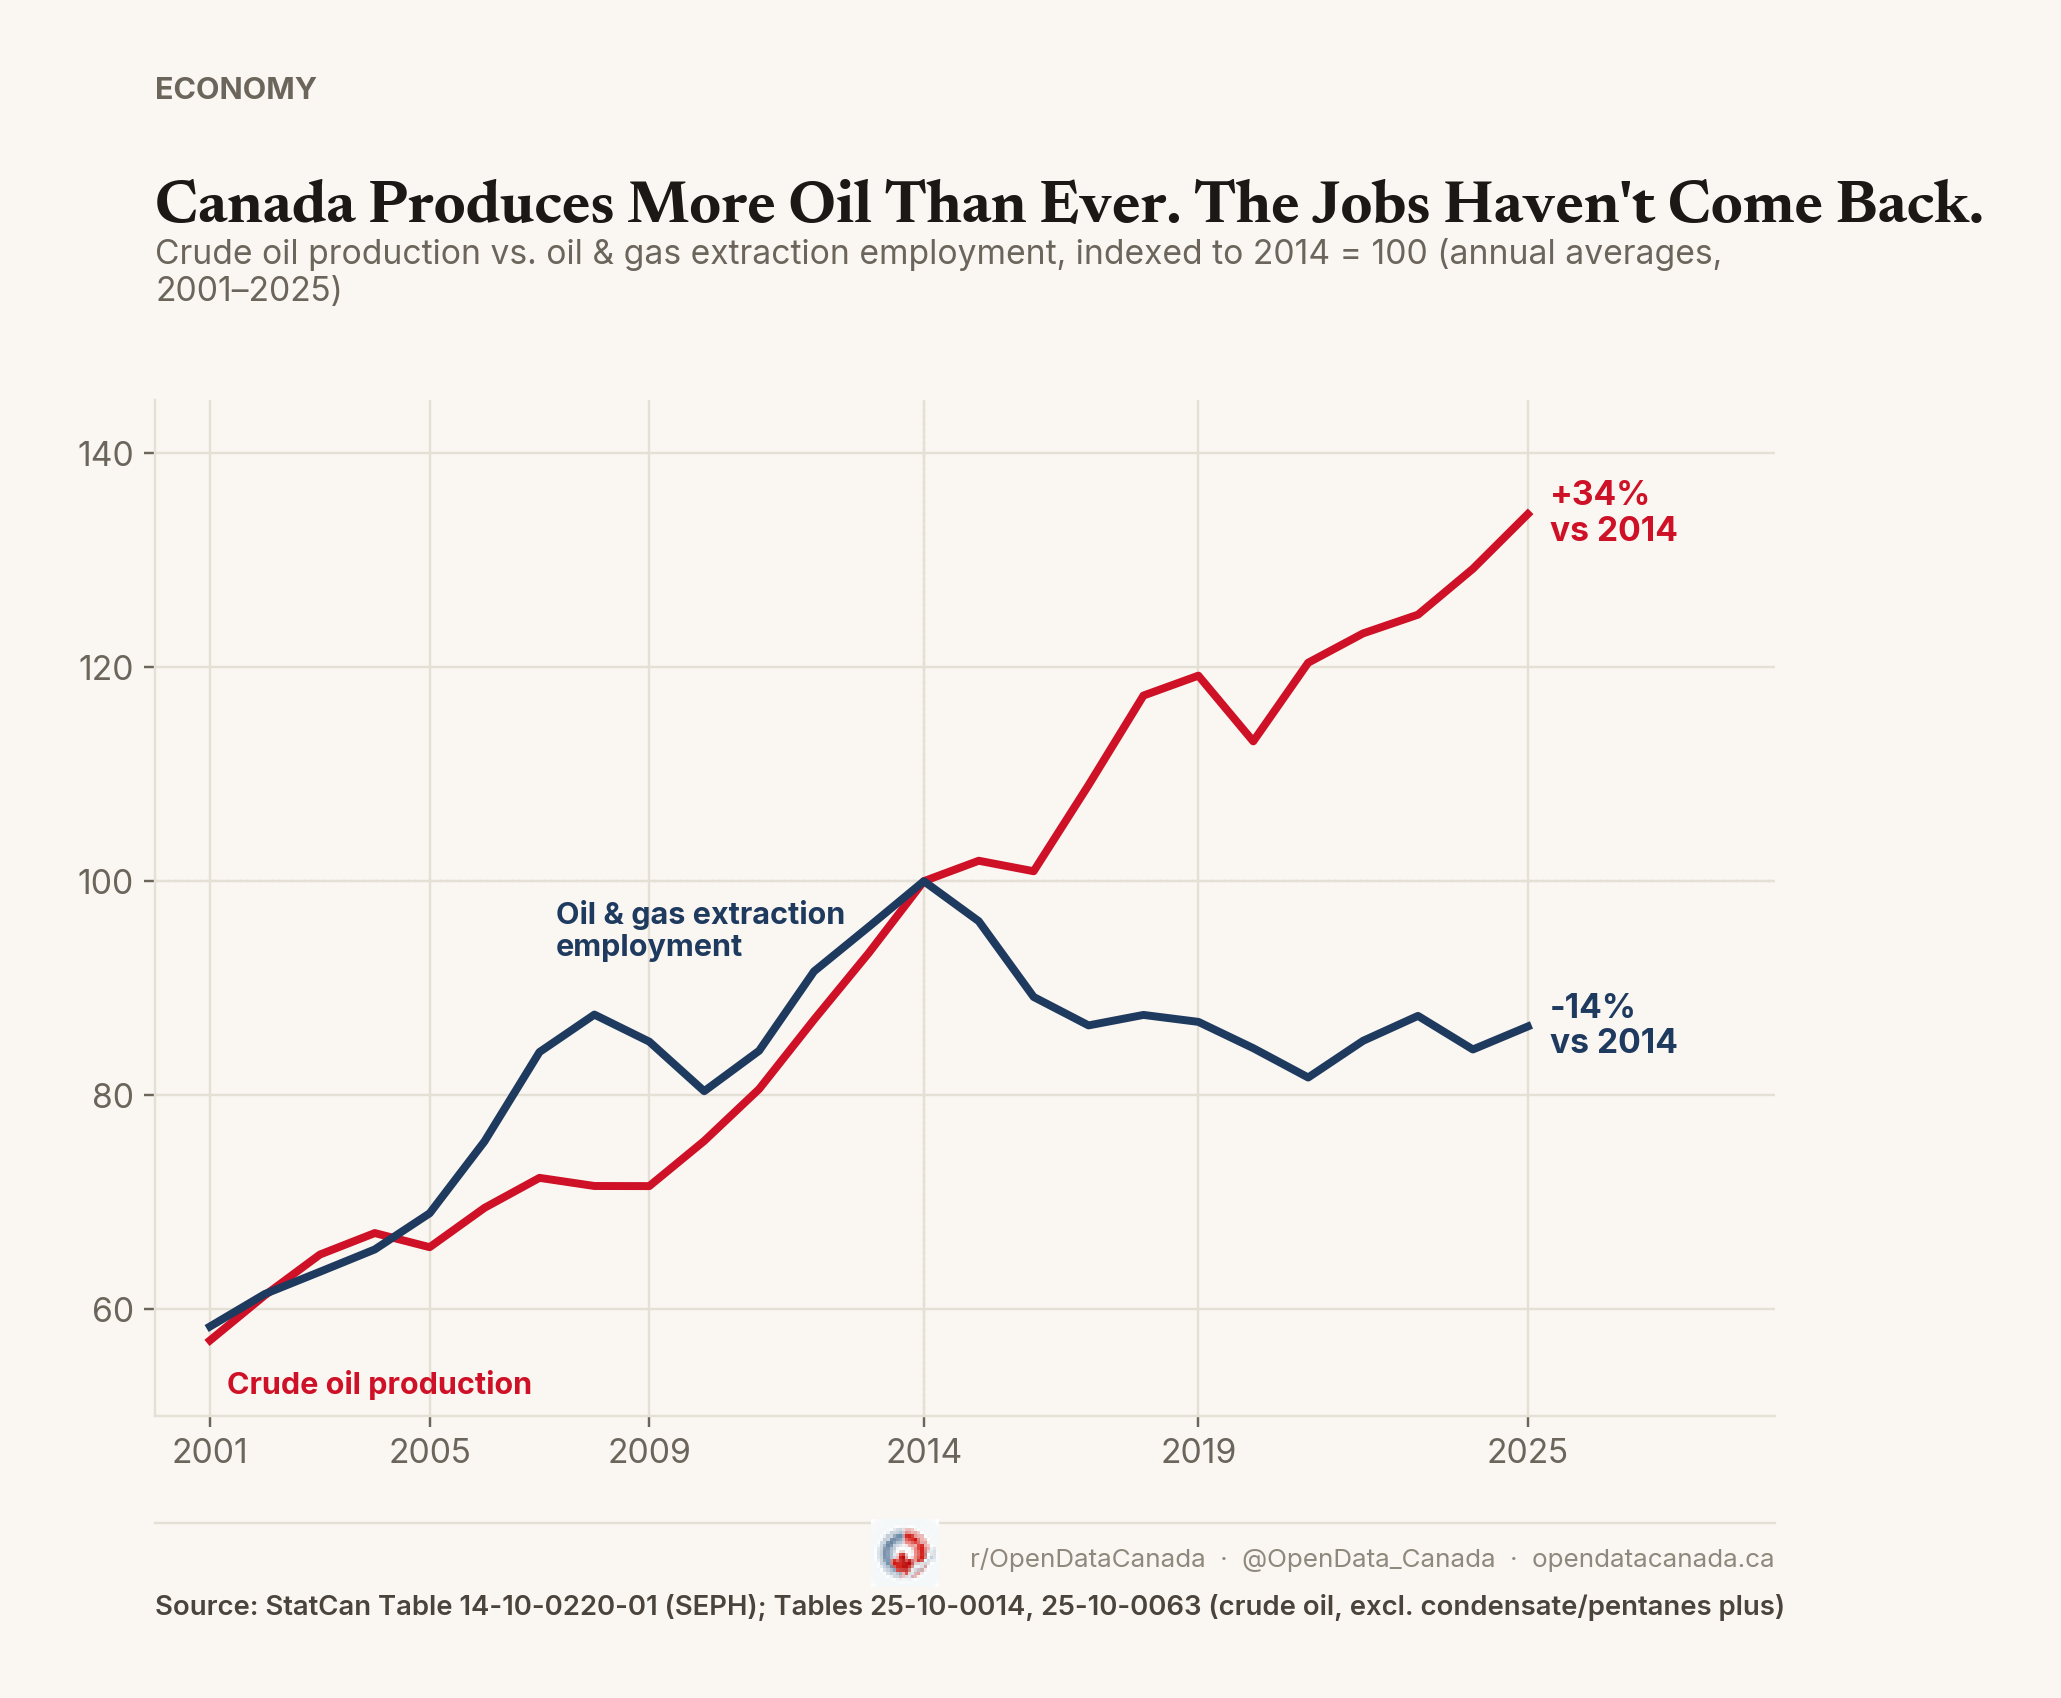
Crude oil production is up 34% since 2014 and sits at a record high. Oil and gas extraction employment is down 13.6% over the same span and has never recovered its 2014 peak. Pembina Institute flagged a version of this gap in 2025; this piece extends the comparison through 2025 with Statistics Canada and Alberta Energy Regulator data, plus a separate look at oil sands capital spending.
Employment in oil and gas extraction averaged 55,572 in 2025, 13.6% below its 2014 annual average of 64,306. The series reached a monthly peak of 66,596 in March 2014. Over the same span, crude oil production climbed 34% past its 2014 level to a new record.
From 2001 through the mid-2010s, employment and production generally rose together. After 2014, their paths diverged sharply: production kept climbing through the 2014–16 oil-price collapse — prices fell, but output did not — dipped only in 2020 during the pandemic shock, then went on to a record high. Employment fell after 2014 and never returned to its previous peak.
Why did the jobs not come back?
Several factors could help explain why production has grown without a comparable recovery in employment. StatCan's Survey of Employment, Payroll and Hours (Table 14-10-0220-01) reports oil and gas extraction (NAICS 211) as a single Canada-wide number, with no provincial or sub-industry breakdown, so none of these can be confirmed or ruled out with the employment data available. What follows is a plausibility check, not a causal test.
- Capital intensity, front-loaded. Oil sands production — now the majority of Canada's crude-oil production — requires enormous up-front capital to build (mines, upgraders, in-situ well pads), but once built, ongoing operations lean more on fixed infrastructure and less on field labour than conventional drilling does. That shifts the sector's cost structure away from labour over time, even as output grows.
- Automation. Producers have invested in autonomous haul trucks, remote operations centres, and predictive-maintenance software over the past decade, all aimed at extracting more with fewer people on site.
- Consolidation. A wave of mergers reshaped the sector after 2014. Cenovus's acquisition of Husky Energy, completed January 2021, was followed by layoffs of 20–25% of the combined roughly 8,600-person workforce — on the order of 1,700–2,150 positions — per company statements reported by CBC News and BOE Report, one example of how mergers eliminate overlapping roles.
What the data clearly show is that the sector's employment footprint shrank even as crude-oil production recovered and reached record levels.
Oil sands: more production, far less capital
The employment data can't be split out by sub-industry, but production and capital spending can. Isolating the oil sands — non-upgraded bitumen plus synthetic crude — against Alberta Energy Regulator capital-spending data adds a piece the employment series alone can't show: what happened to investment per barrel.
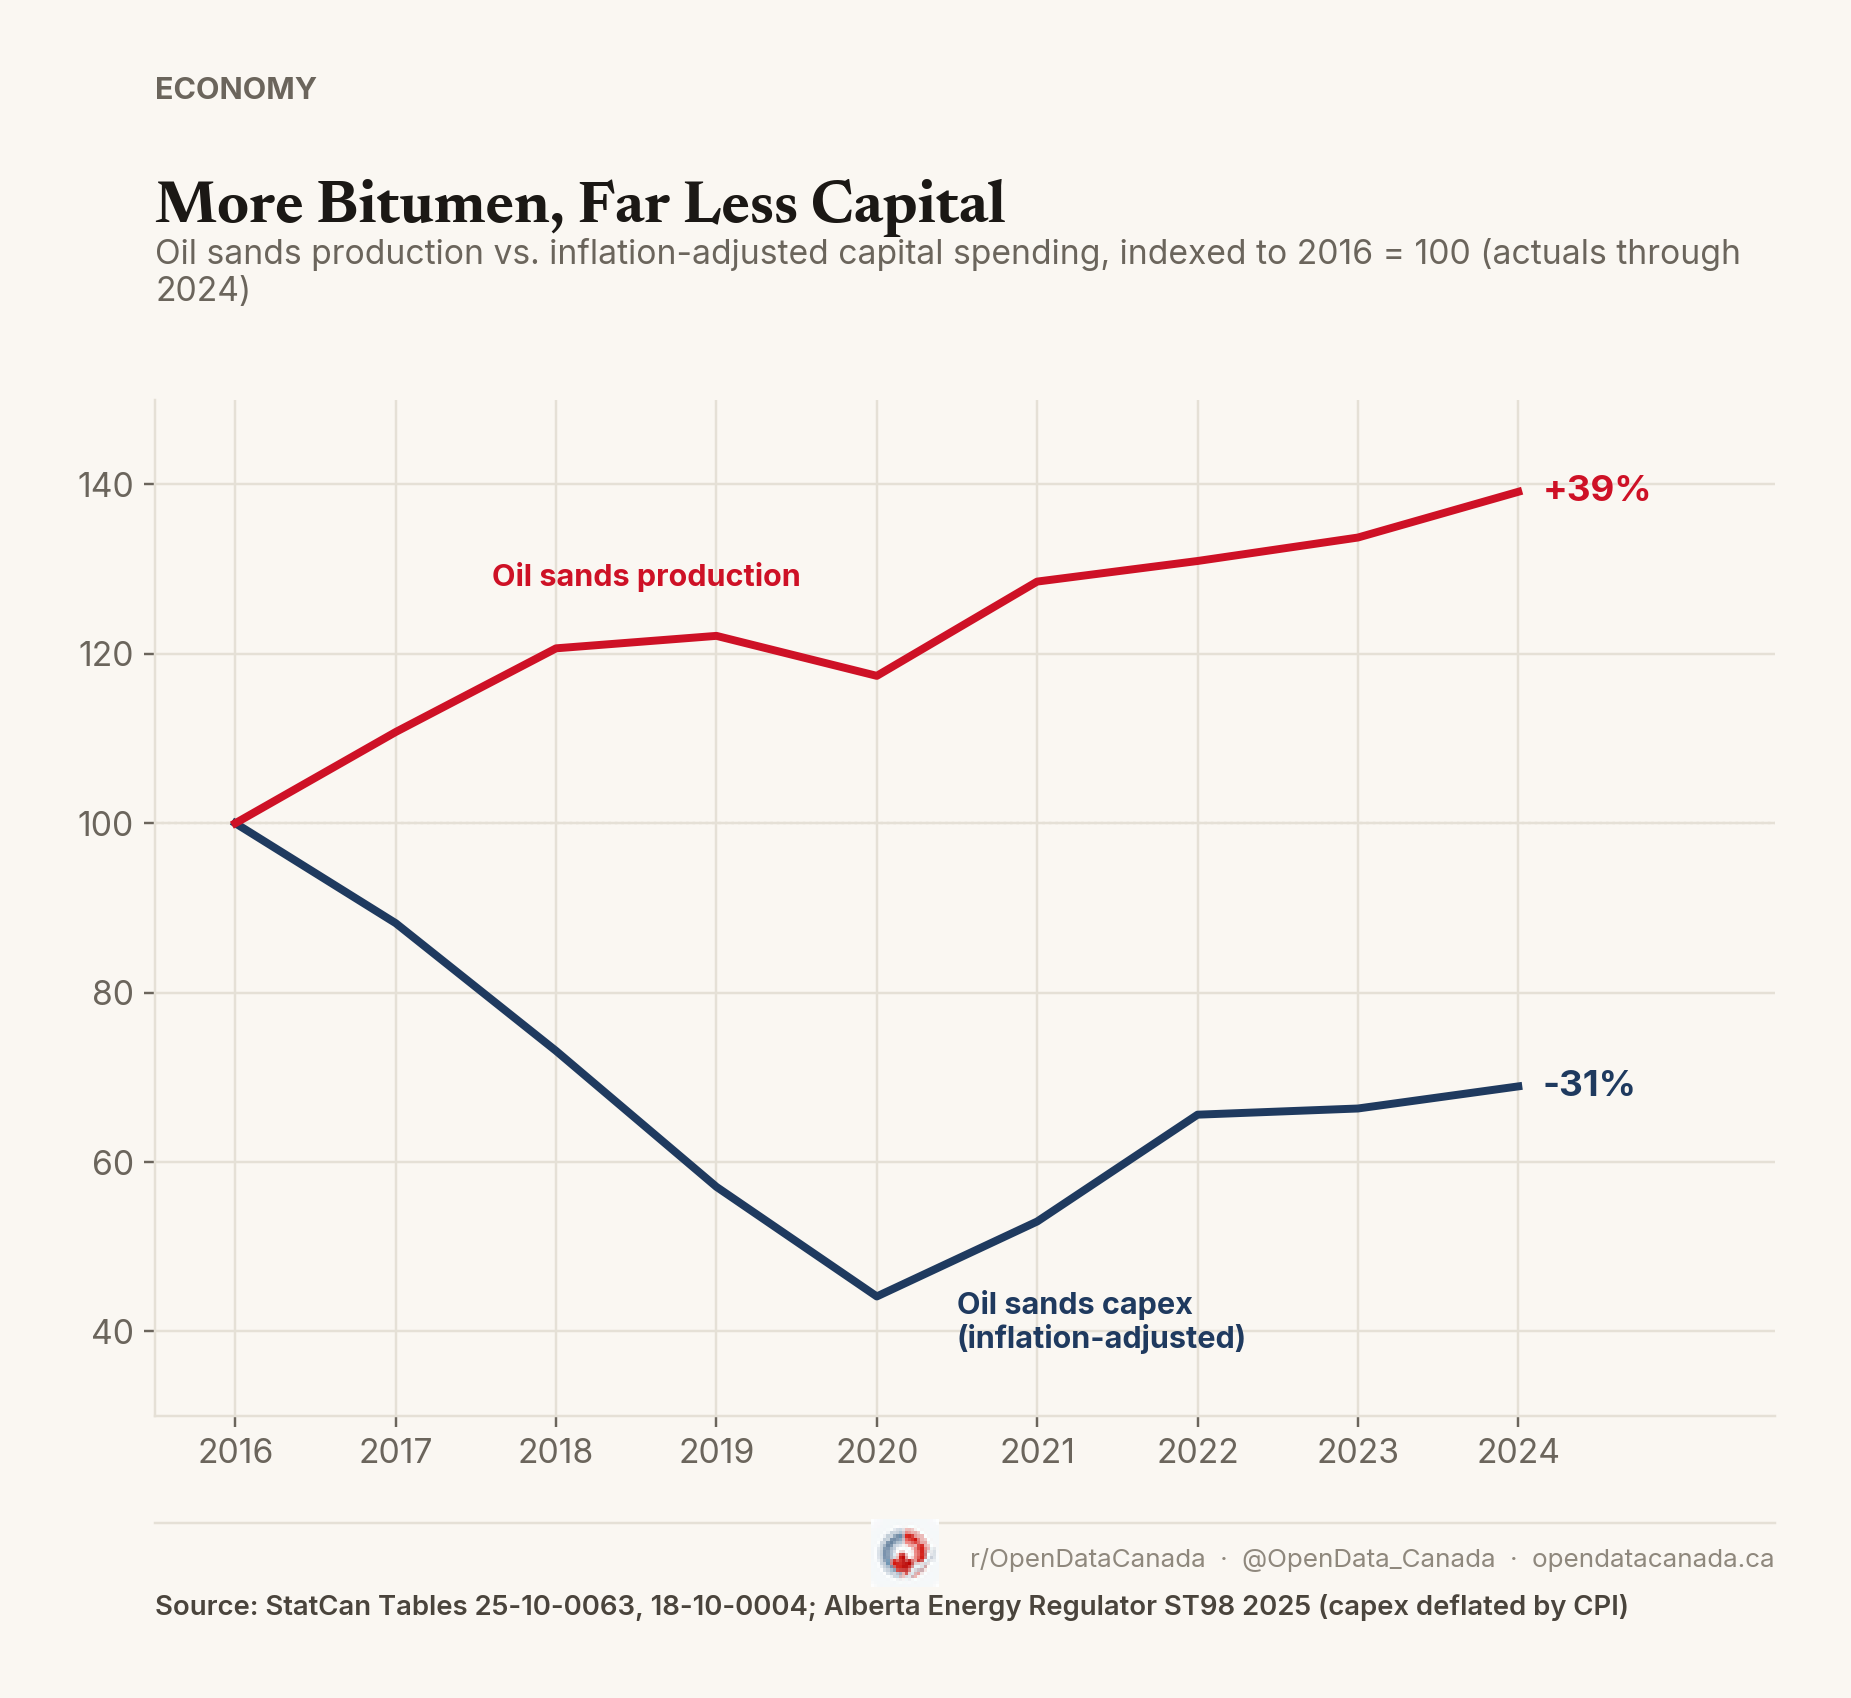
StatCan's oil sands/conventional production split only goes back to 2016, so this chart rebases to 2016 = 100 rather than 2014 — a lower, later starting point than the hero chart above. The AER's capital-spending figures are actuals only through 2024 (2025 onward is a forecast in ST98 2025), so both series in this chart are held to that same endpoint rather than mixing an actual production year with a forecast capex year. Oil sands production is up 39% between 2016 and 2024. Capital expenditure, adjusted for inflation using StatCan's CPI (Table 18-10-0004-01), is down 31% over the same span, and down roughly 70% from its 2014 peak of $33.9 billion nominal ($44.5 billion in 2025 dollars). Meanwhile, Canada-wide NAICS 211 employment, over the same 2016–2024 span, is down about 5.5%.
A note on the inflation adjustment: the -31% figure above deflates AER's nominal capex using StatCan's economy-wide CPI (Table 18-10-0004-01). Oil sands equipment costs haven't moved with the general consumer basket — StatCan's oil sands machinery and equipment price index (Table 18-10-0284-01) rose faster, especially from 2021 through 2023. Deflating by that industry-specific index instead shows a steeper real decline: -40.6% from 2016 to 2024, versus -31% under CPI. Notably, the two deflators put 2024 spending at nearly the same level ($13.6 billion vs. $13.8 billion in 2025 dollars); the difference comes almost entirely from the 2016 base, which the industry index revalues higher because equipment costs subsequently outpaced general inflation. The chart above uses the more conservative, CPI-based figure.
The combination is consistent with a more capital-efficient production model: substantially more oil-sands output without a comparable increase in capital spending. It does not, however, establish that capital efficiency or automation caused the employment divergence.
Caveat: the employment figure cited above is the Canada-wide NAICS 211 total, not an oil-sands-specific number — there is no data source that isolates oil-sands employment on its own. Production and capex in the chart above are oil-sands-specific; the employment comparison is not, which is why it appears in text rather than as a third line on the chart. Treat the two as directionally comparable, not as measurements of the identical population.
What the data can't tell us
NAICS 211 doesn't permit oil-sands-specific employment attribution, so this piece can't say how much of the Canada-wide employment decline happened inside the oil sands specifically versus conventional drilling elsewhere. It also can't distinguish between the three explanations above, or rule out others. What it can show is that the production-employment gap Pembina identified through 2023 persisted through 2025, and that it coincided with a large real-dollar pullback in oil-sands capital spending.
A note on prior work: the Pembina Institute published a similar finding in its August 2025 report Drilling Down. Pembina's broader measure of direct oil-and-gas employment peaked at about 219,000 in 2013 and had fallen to 184,000 by 2023 — a decline of roughly 35,000 jobs — even as production rose over the same decade. Its analysis uses a wider employment definition than the StatCan NAICS 211 series used here. This piece uses Statistics Canada and Alberta Energy Regulator data to extend the comparison through 2025.
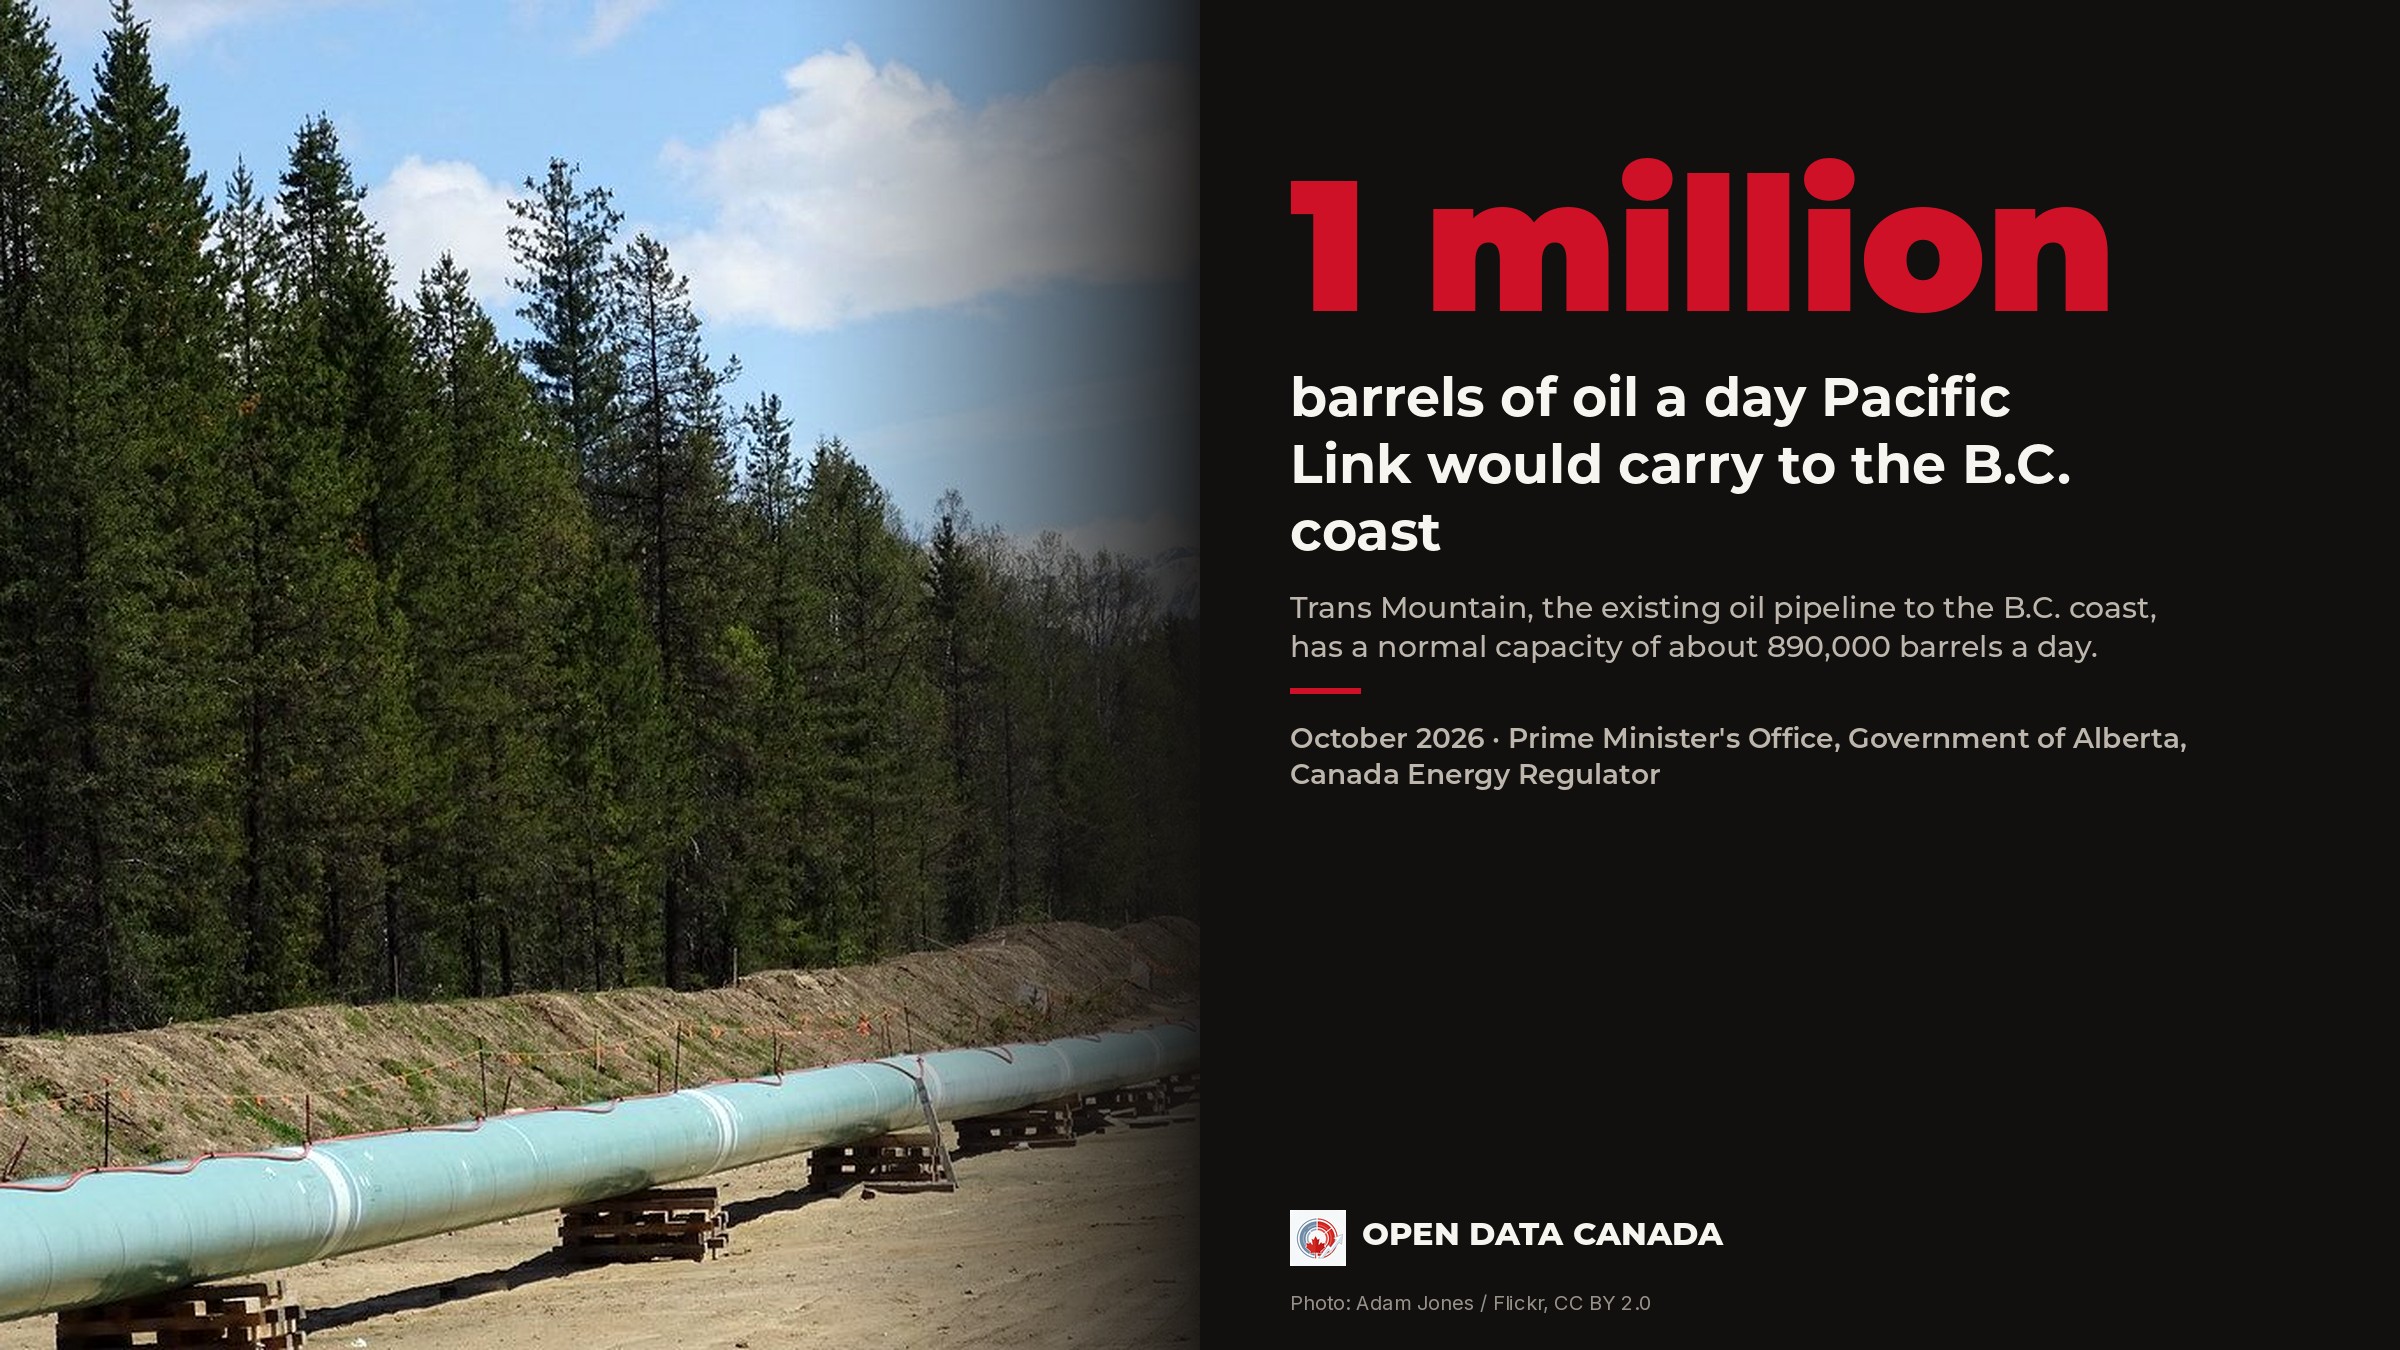
Related: the West Coast pipeline, now called Pacific Link, in numbers.