Justice
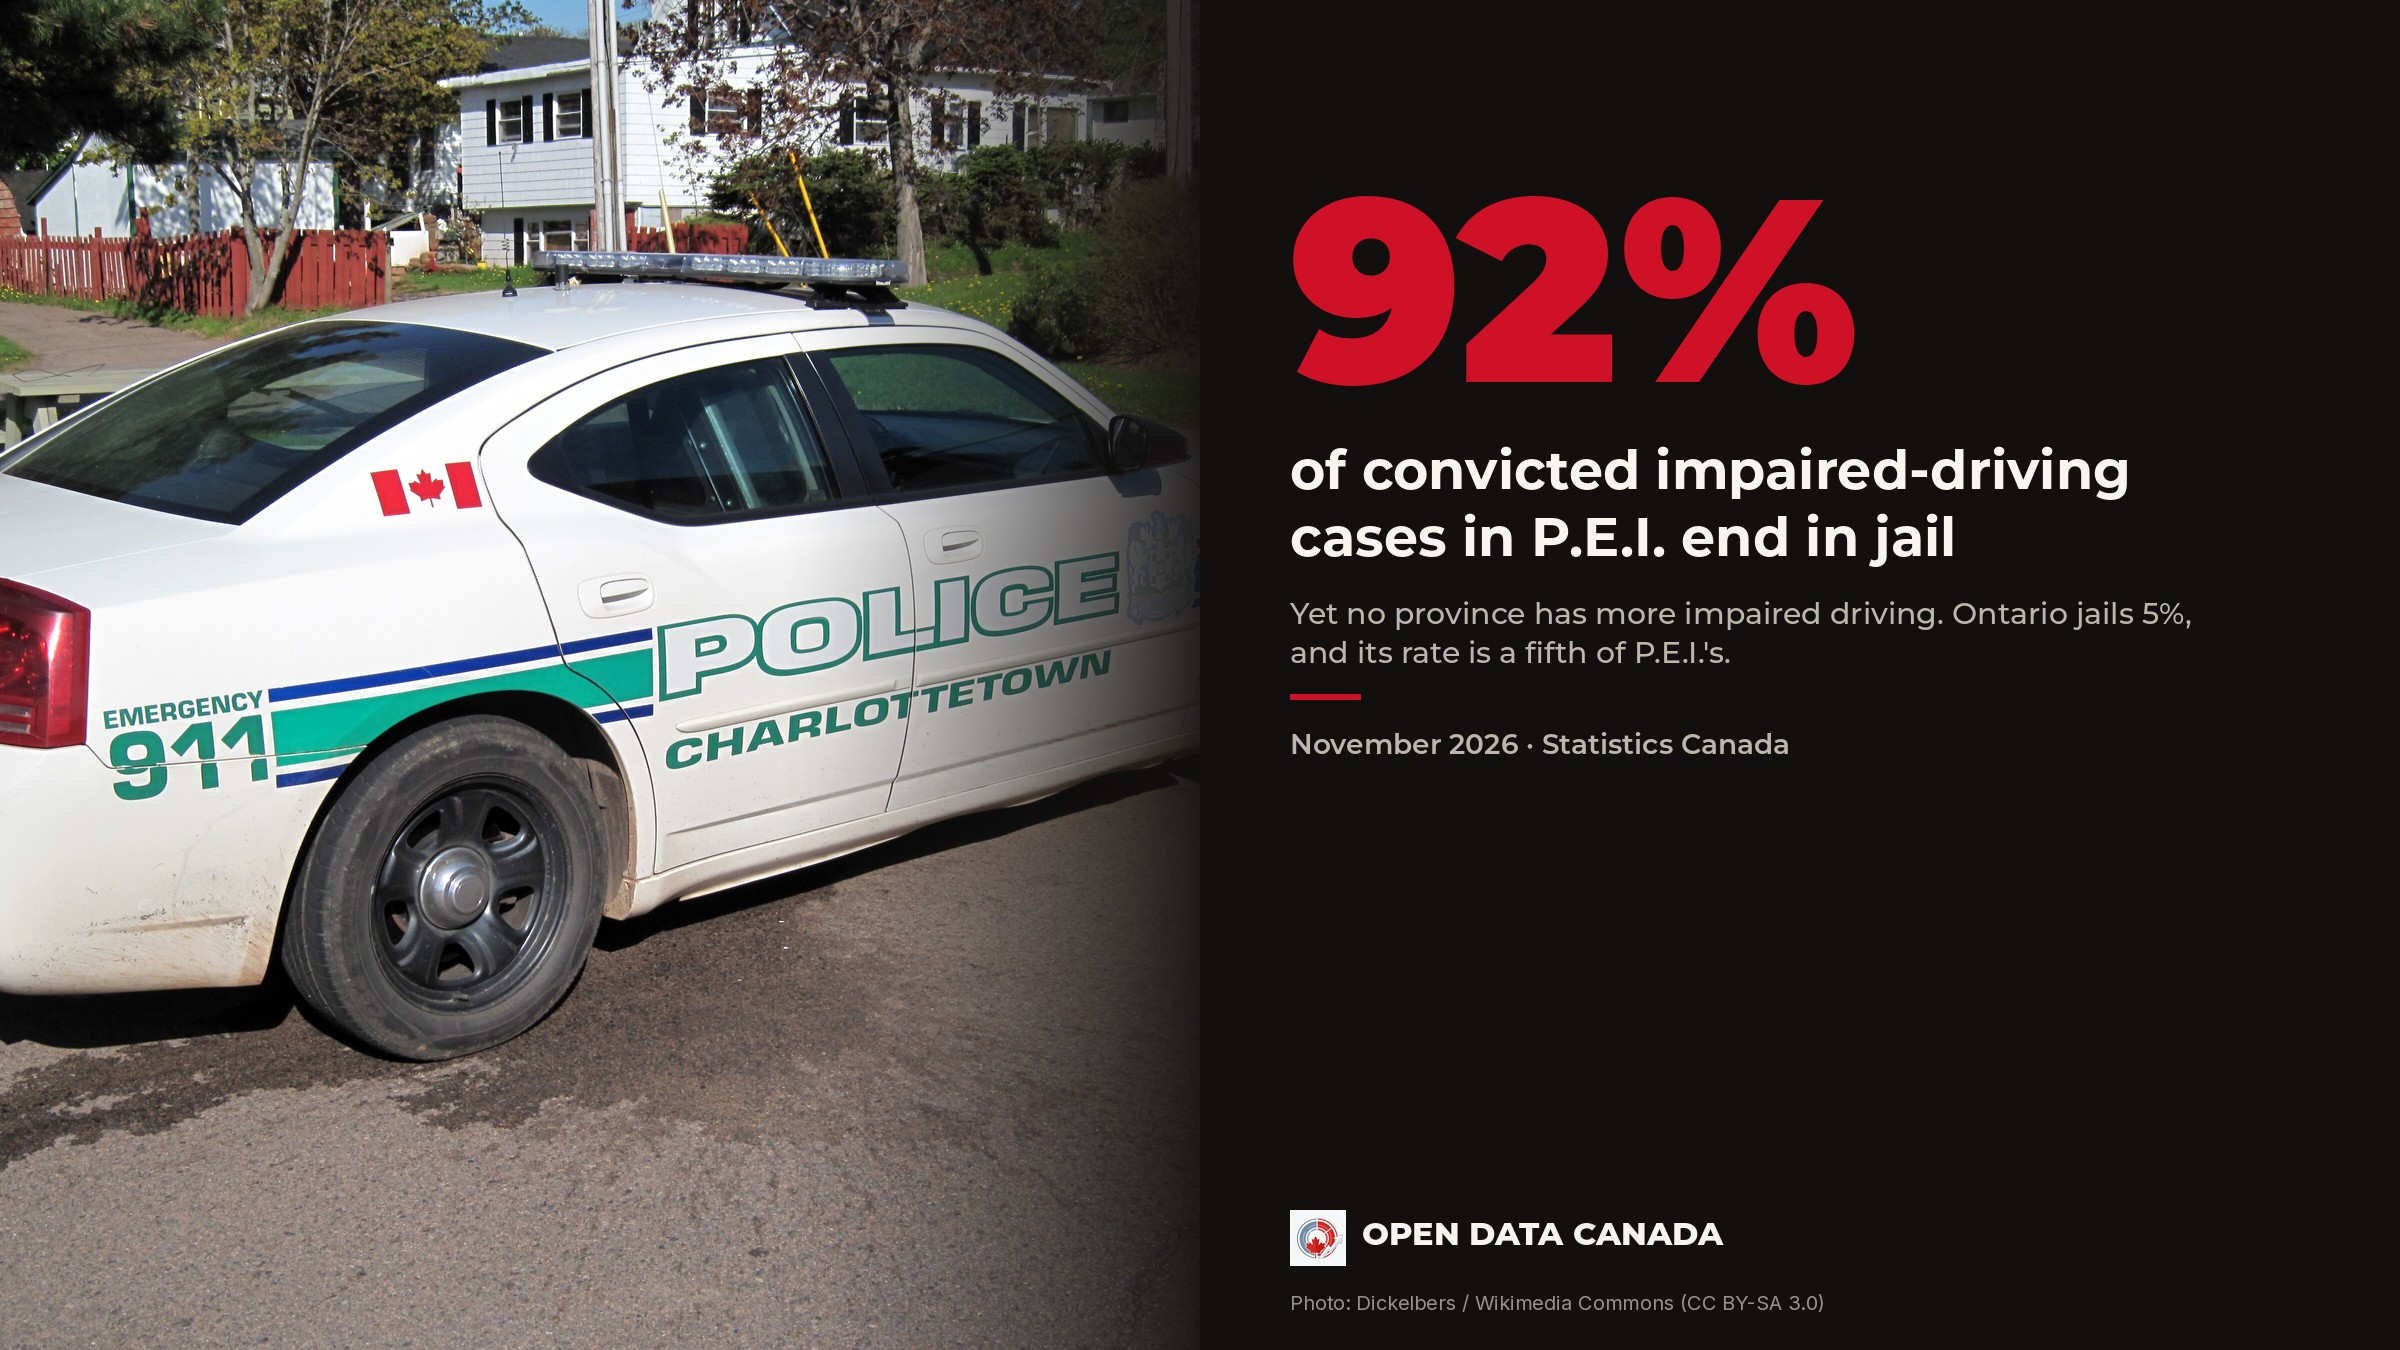
P.E.I. jails nearly every impaired driver it convicts. Yet no province has more impaired driving.
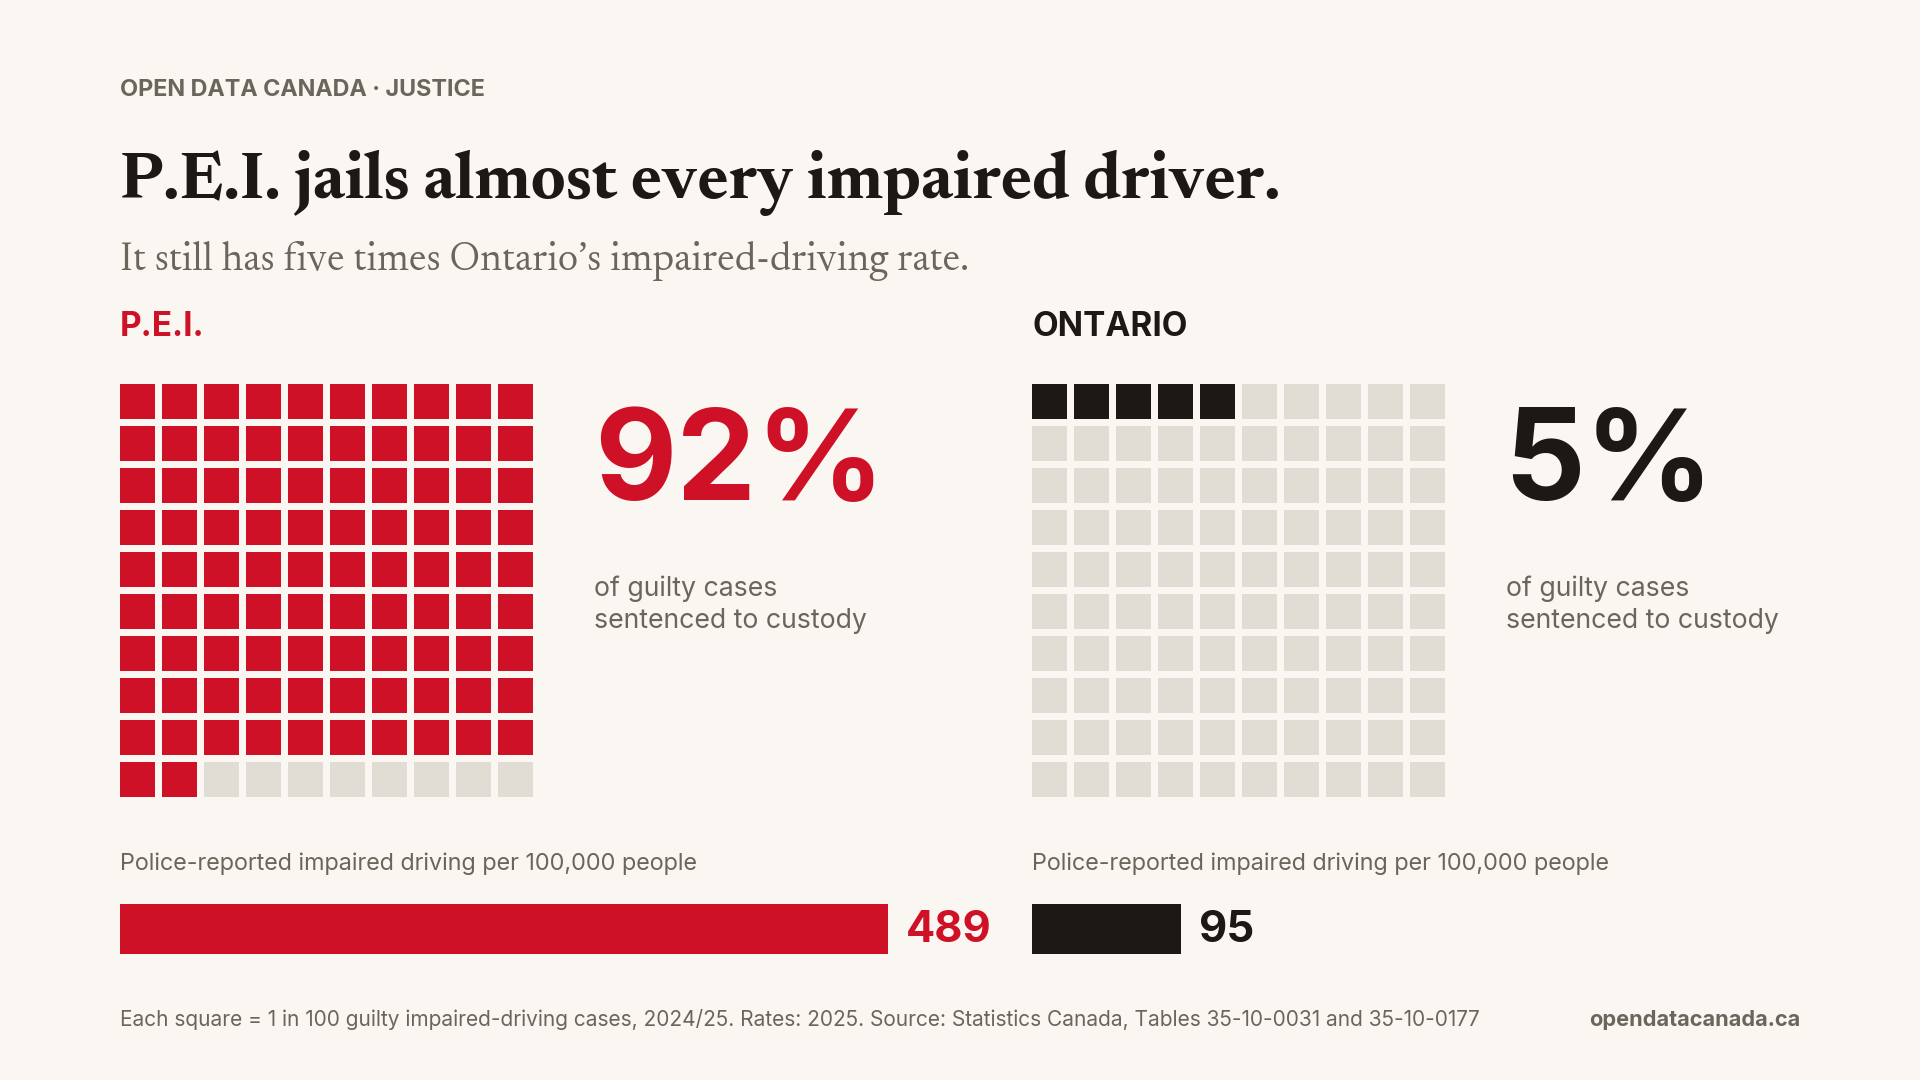
Ontario jails about one in 20 convicted impaired-driving cases and has Canada's lowest rate. P.E.I. jails almost all of them, yet its police-reported rate is five times higher.
In Ontario, jail is relatively uncommon for impaired driving. In 2024/25, courts recorded 8,033 guilty cases. Only 410 ended with custody as the most serious sentence, about 5%.
On Prince Edward Island, 233 of 254 guilty cases ended in custody, or 92%. Most sentences were short: 208 of the 233 were for one month or less. That isn't a one-year spike. P.E.I. has sent at least 85% of guilty impaired-driving cases to custody every year since 2005. Nationally the figure is 7%.
Tougher sentences, more impaired driving
You might expect the province that jails almost every case to have the least impaired driving. It has the most. Police on P.E.I. recorded 489 impaired-driving incidents per 100,000 people in 2025, three times the national rate of 162 and five times Ontario's 95.
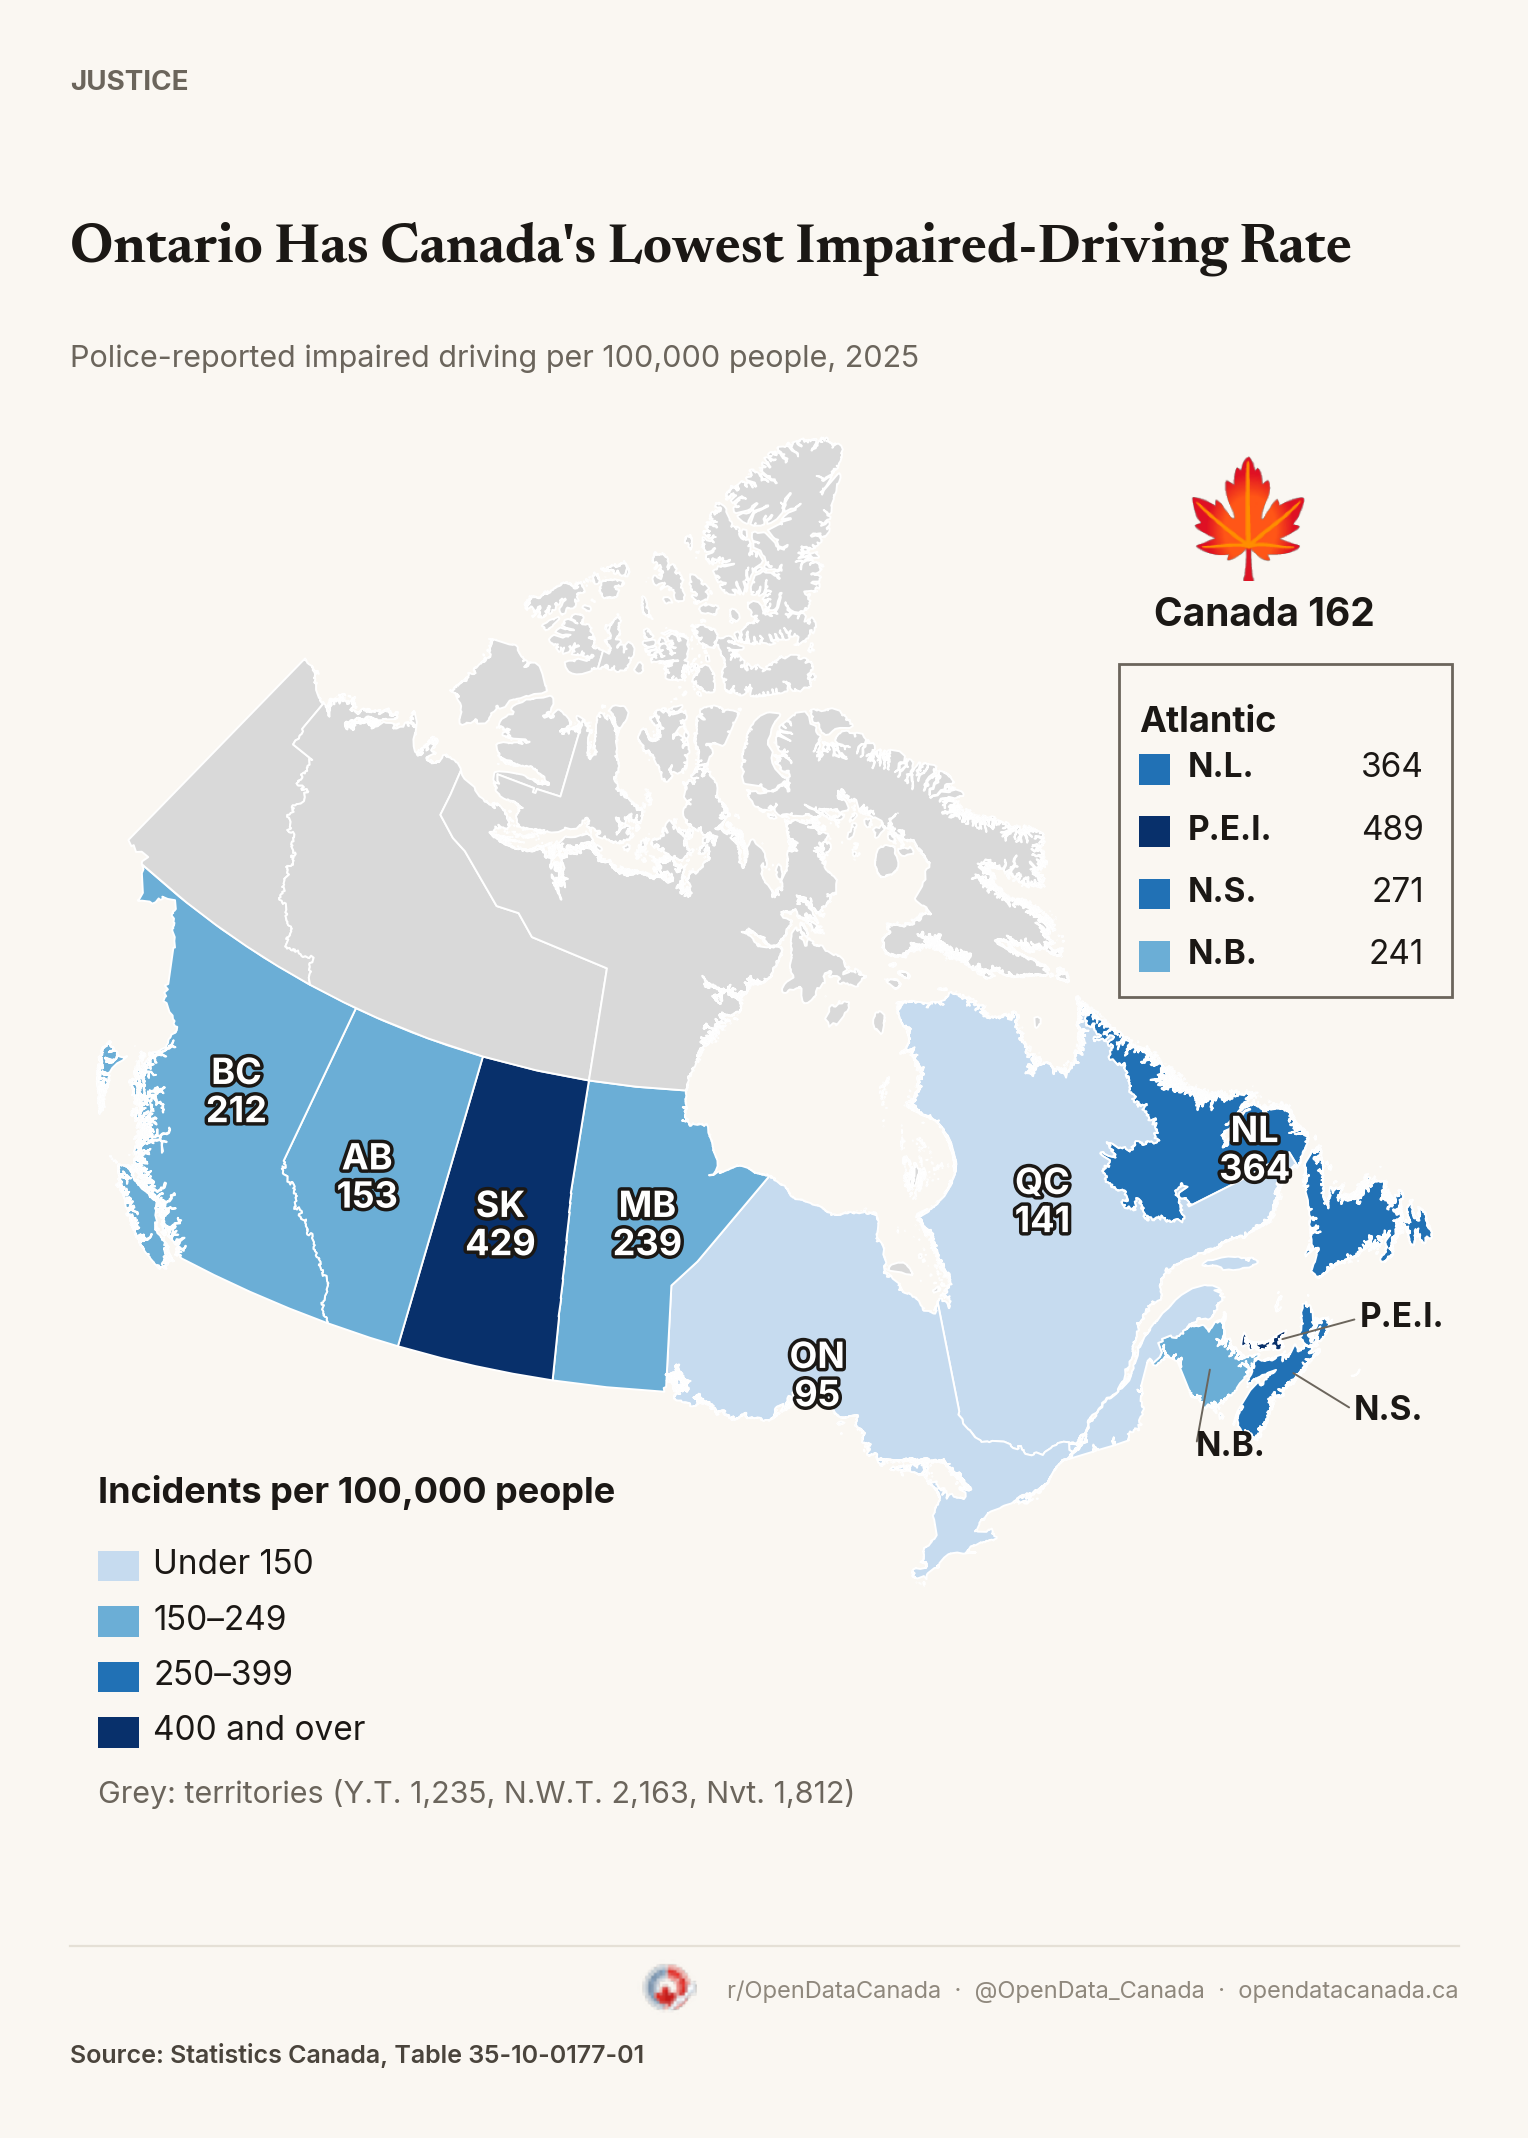
This isn't new. Ontario has had the lowest rate of any province every year since 1998. P.E.I. has been in the top five every one of those years, and first in each of the last four.
| Province | Impaired driving per 100,000 people, 2025 | Guilty cases ending in custody, 2024/25 |
|---|---|---|
| P.E.I. | 489 | 92% |
| Saskatchewan | 429 | 10% |
| Newfoundland and Labrador | 364 | 4% |
| Nova Scotia | 271 | 6% |
| New Brunswick | 241 | 6% |
| Manitoba | 239 | 7% |
| British Columbia | 212 | 4%* |
| Alberta | 153 | 12%* |
| Quebec | 141 | not reported |
| Ontario | 95 | 5% |
| Canada | 162 | 7% |
Police numbers partly depend on how hard police look, and more officers don't reliably mean less crime. But the pattern also shows up where enforcement doesn't matter. Coroners found alcohol in 46% of P.E.I. road deaths from 2011 to 2015, the highest share in Canada, against 24% in Ontario. That's the latest provincial breakdown available, from the Traffic Injury Research Foundation.
None of this proves jail makes things worse. P.E.I. may jail so many cases precisely because it has a bigger problem. What it does show is that P.E.I.'s decades-long reliance on jail sentences has coexisted with an impaired-driving rate far above the national average.
A few things to know
Quebec hasn't reported sentencing data since 2021. Rates jumped in 2019 across much of the country after police got the power to breath-test any driver they lawfully stop.