Article · Justice · 5 min read
Fraud used to be solved like a violent crime. Now it almost never is.
In 1998, Canadian police cleared 60% of reported frauds — on par with how often they cleared a sexual assault that year. By 2025, that number is 10.3%, the largest decline of any offence among the 17 major categories we examined. It's happening against a backdrop of its own: the national violent-crime clearance rate bottomed at a 28-year low in 2023 and has only partly recovered since.

The story
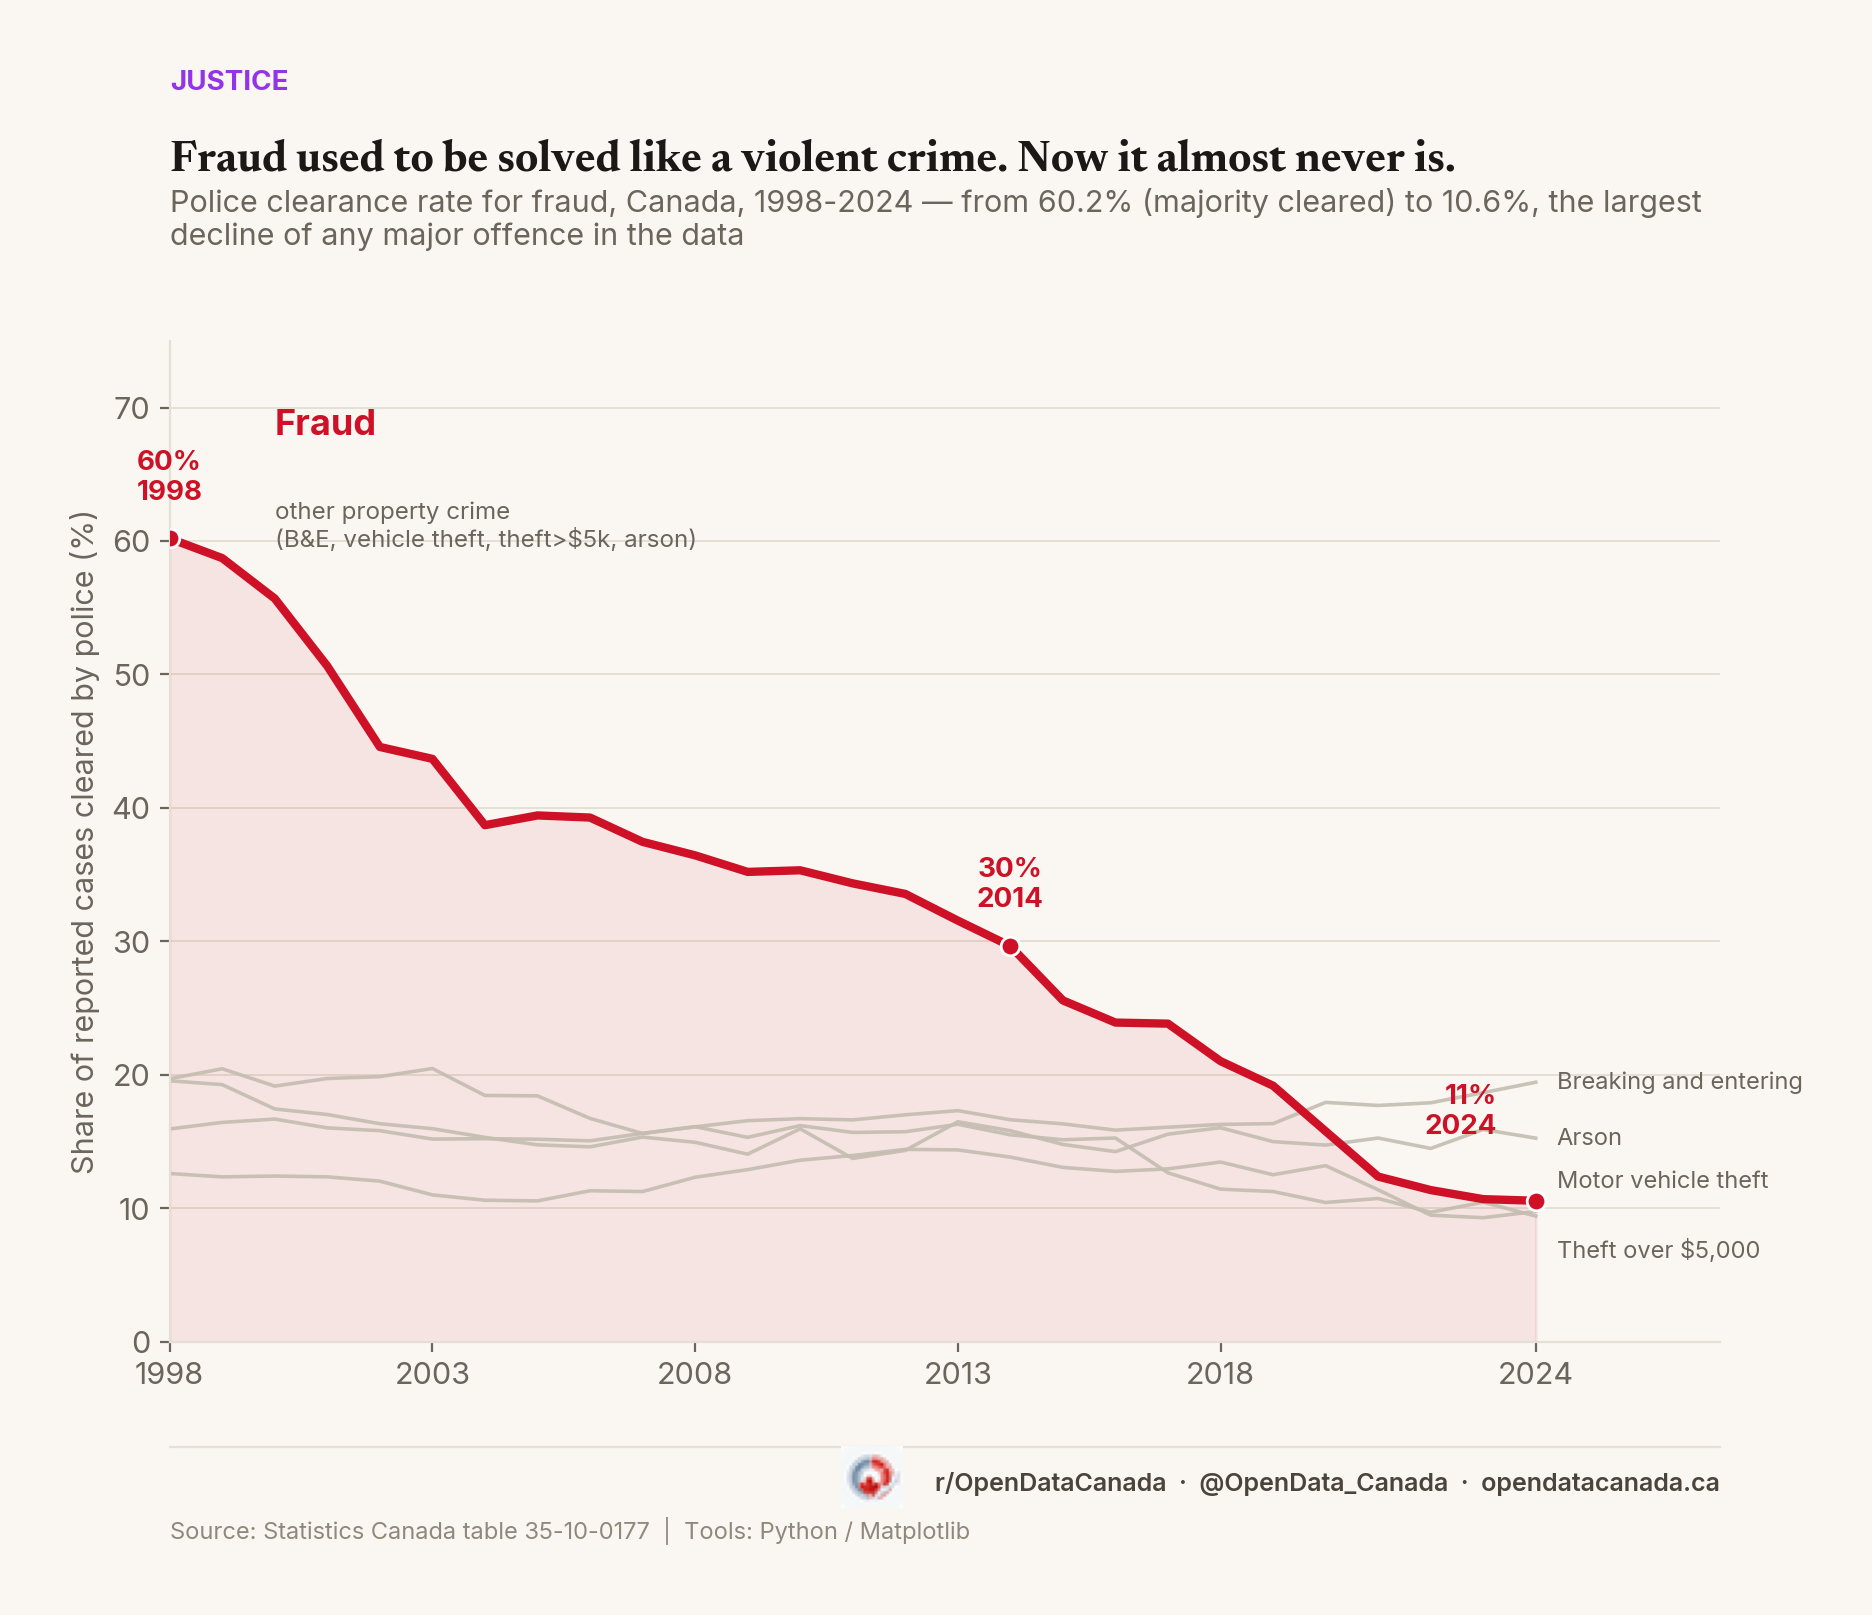
Fraud's police clearance rate, Canada, 1998–2025, against four other major property offences. Fraud started well above them; by 2025 it had fallen to the bottom of the pack. Data: Statistics Canada table 35-10-0177.
In 2025, Canadians reported 177,472 frauds to police. 18,309 were cleared — by charge or otherwise. That's a 10.3% clearance rate — a simple cleared-over-reported ratio, not StatCan's separately published, severity-weighted clearance rate used elsewhere in this piece (more on that distinction under Method and limits, below). In 1998, the same calculation gave 60.2%: a majority of reported frauds got resolved, a rate closer to how assault or robbery were cleared than to how break-ins or car theft were cleared. Twenty-seven years later, fraud clears about as poorly as the worst-performing property crimes here — on par with motor vehicle theft (11.2%) and theft over $5,000 (10.1%), and worse than break-ins (19.9%) or arson (15.7%).
The decline wasn't one event. It ran through nearly every year of the 28-year series: steep in the early 2000s (60% to 44% by 2003), a slower slide to 30% by 2014, then nearly half again in the last seven years, from 21% in 2018 to 10.3% in 2025.
Is this just more fraud than police can keep up with?
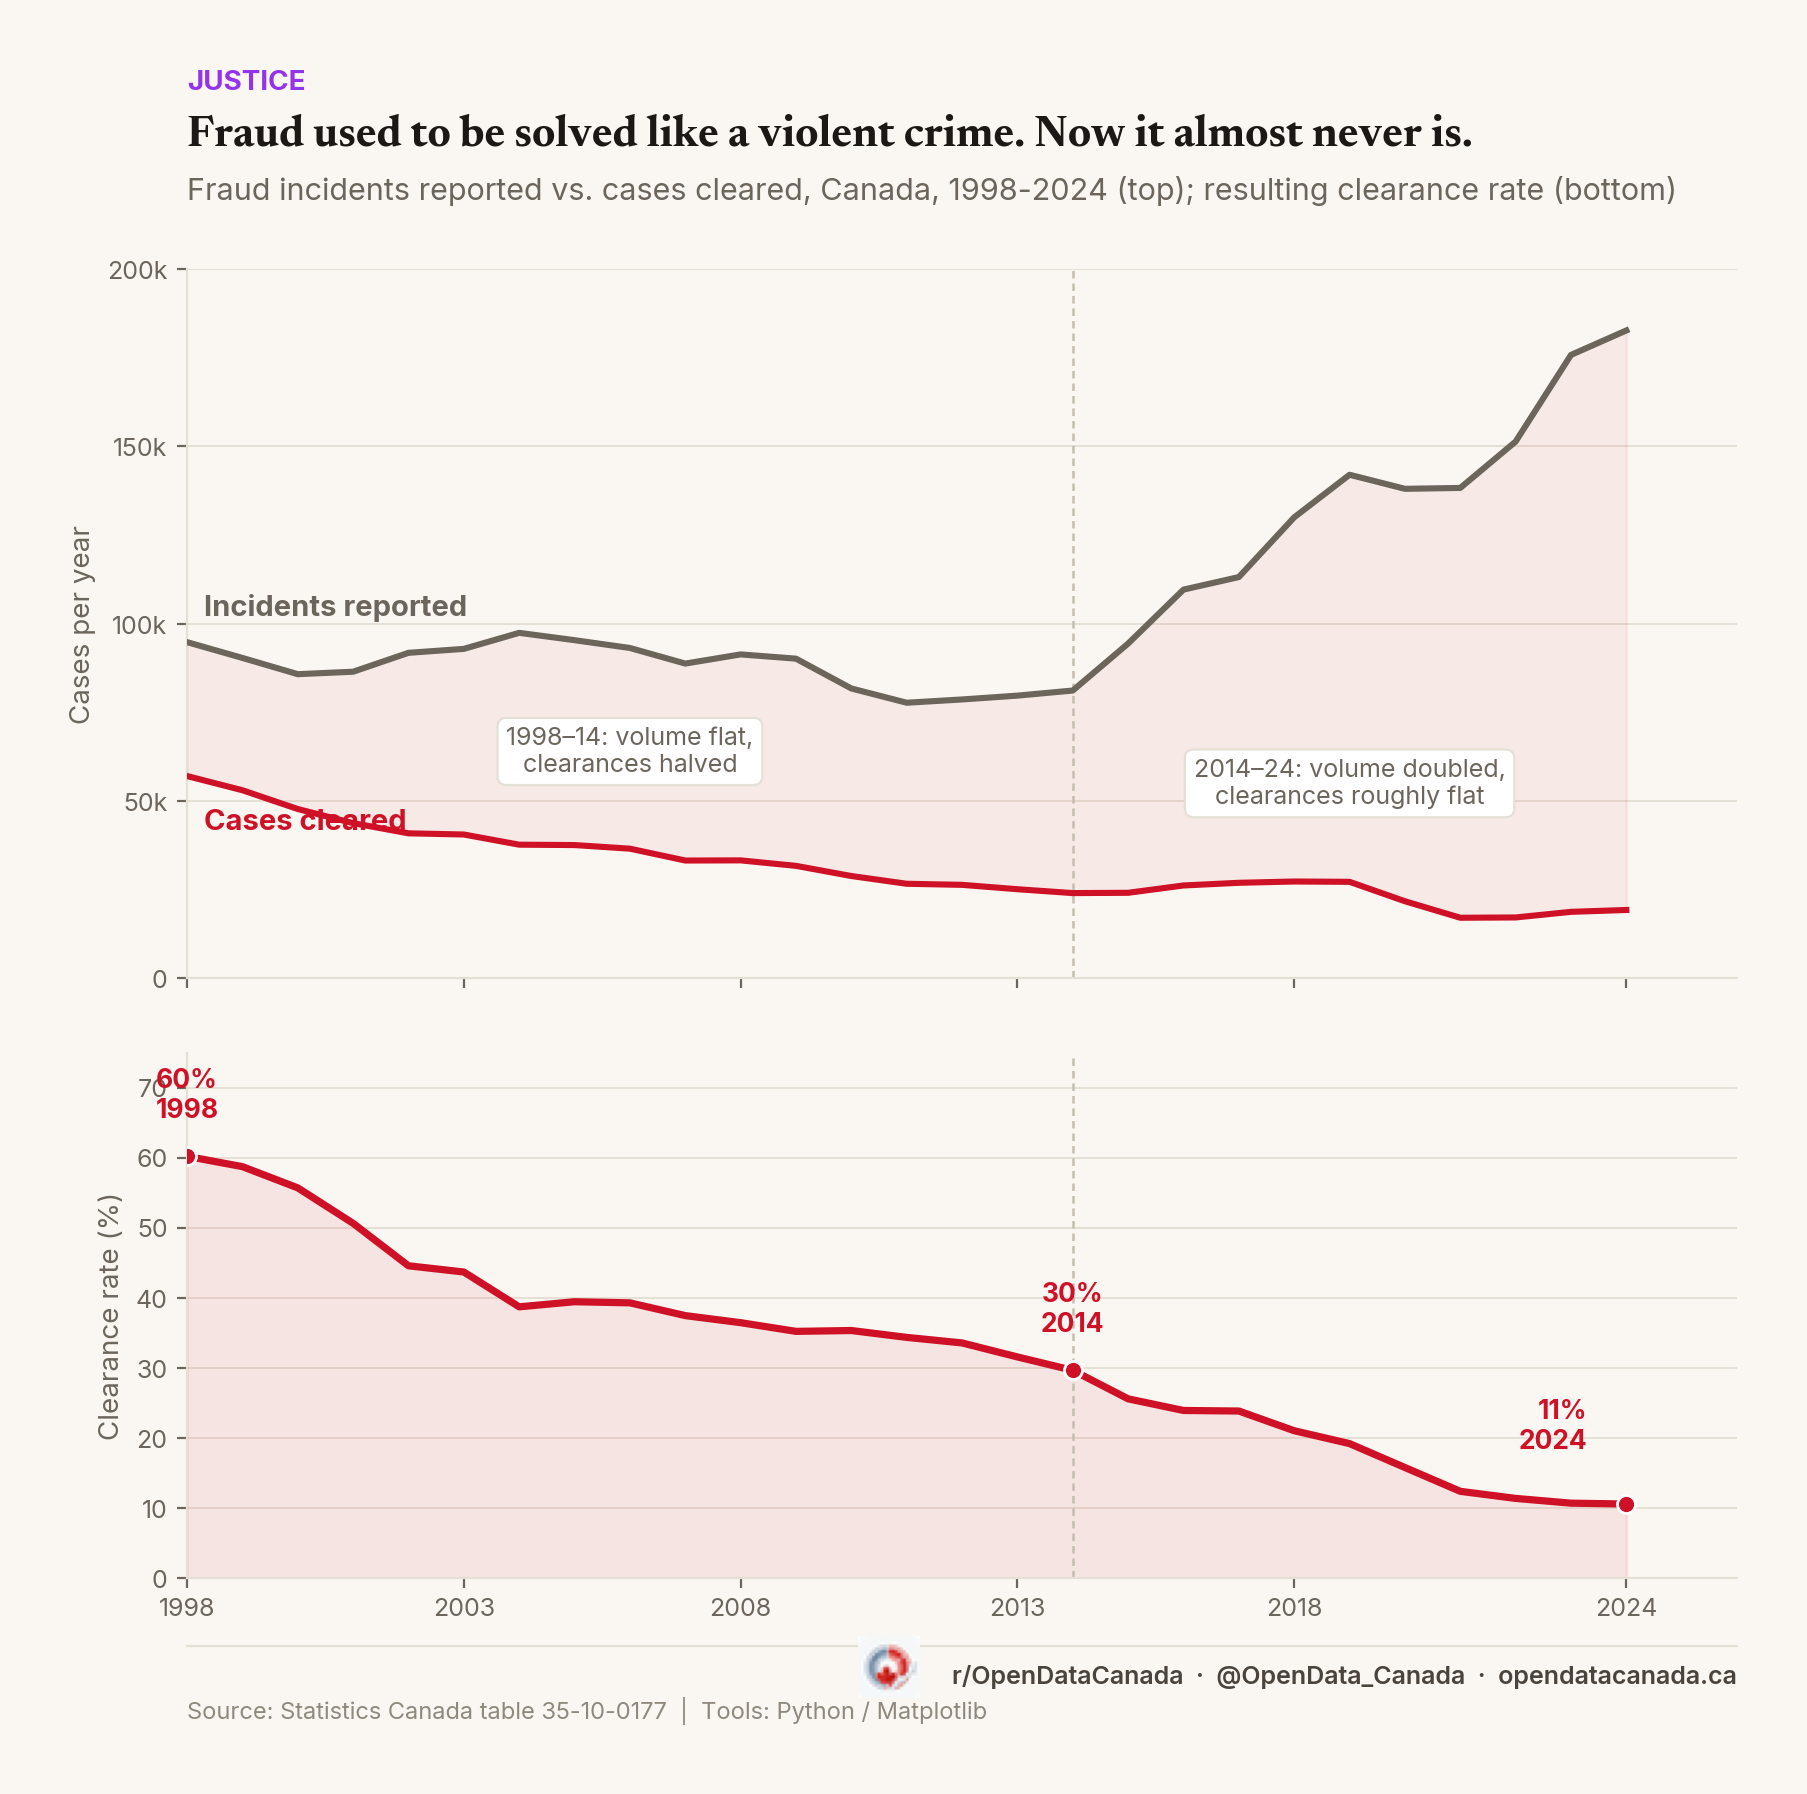
Split the 28 years in two and the "just more fraud" case gets weaker, not stronger. From 1998 to 2014, reported fraud was flat-to-down (94,819 to 81,179 incidents, −14%), yet the number of cases cleared fell by more than half (57,072 to 24,072, −58%). Police weren't being swamped by more fraud in this period. Clearances per incident just kept falling regardless of volume. From 2014 to 2025, the picture flips: reported incidents more than doubled (81,179 to 177,472, +119%), while cases cleared actually fell (24,072 to 18,309, −24%), a much smaller move set against a fast-growing pool of reports. That period genuinely does look like police clearing about the same number of cases each year regardless of how much fraud was reported.
Neither factor on its own produces today's 10.3%. If police still cleared 57,072 cases a year (the 1998 pace) against 2025's incident volume, the rate would be 32.2%. If incident volume had stayed at the 1998 level but clearances still fell the way they did, it'd be 19.3%. Getting to where fraud is now takes both: a real decline in cases cleared and a surge in cases reported.
We can't say from this data alone why clearances per incident kept falling even when volume didn't. A shift in fraud's mix toward harder-to-solve online and cross-border scams plausibly matters, as does how forces prioritize fraud investigations against violent crime, and resourcing. So does definitional churn: StatCan revised its "founded incident" rules in 2018, and its own release notes have flagged data-quality issues in individual services' fraud counts in some years. This table can't distinguish between any of them. What the data does show is that "there's just more fraud now" is at most half the story.
Violent-crime clearance bottomed out in 2023 — and still hasn't recovered
Fraud isn't declining in isolation. Canada's national violent weighted clearance rate peaked at 64.1% in 2014 and fell almost every year after, bottoming at 54.0% in 2023 — the lowest point in the 28-year series, below even 1998's 55.7%. It has ticked up slightly since, to 54.1% in 2024 and 54.5% in 2025, but remains well below its 2014 peak. The all-crime weighted clearance rate (which blends in property crime, including fraud) tells a different story: it peaked a year earlier, in 2013 at 41.0%, and has risen to 36.6% in 2025 — down from peak, but not a record low. 2003 and 2004 were both lower, near 33.5%.
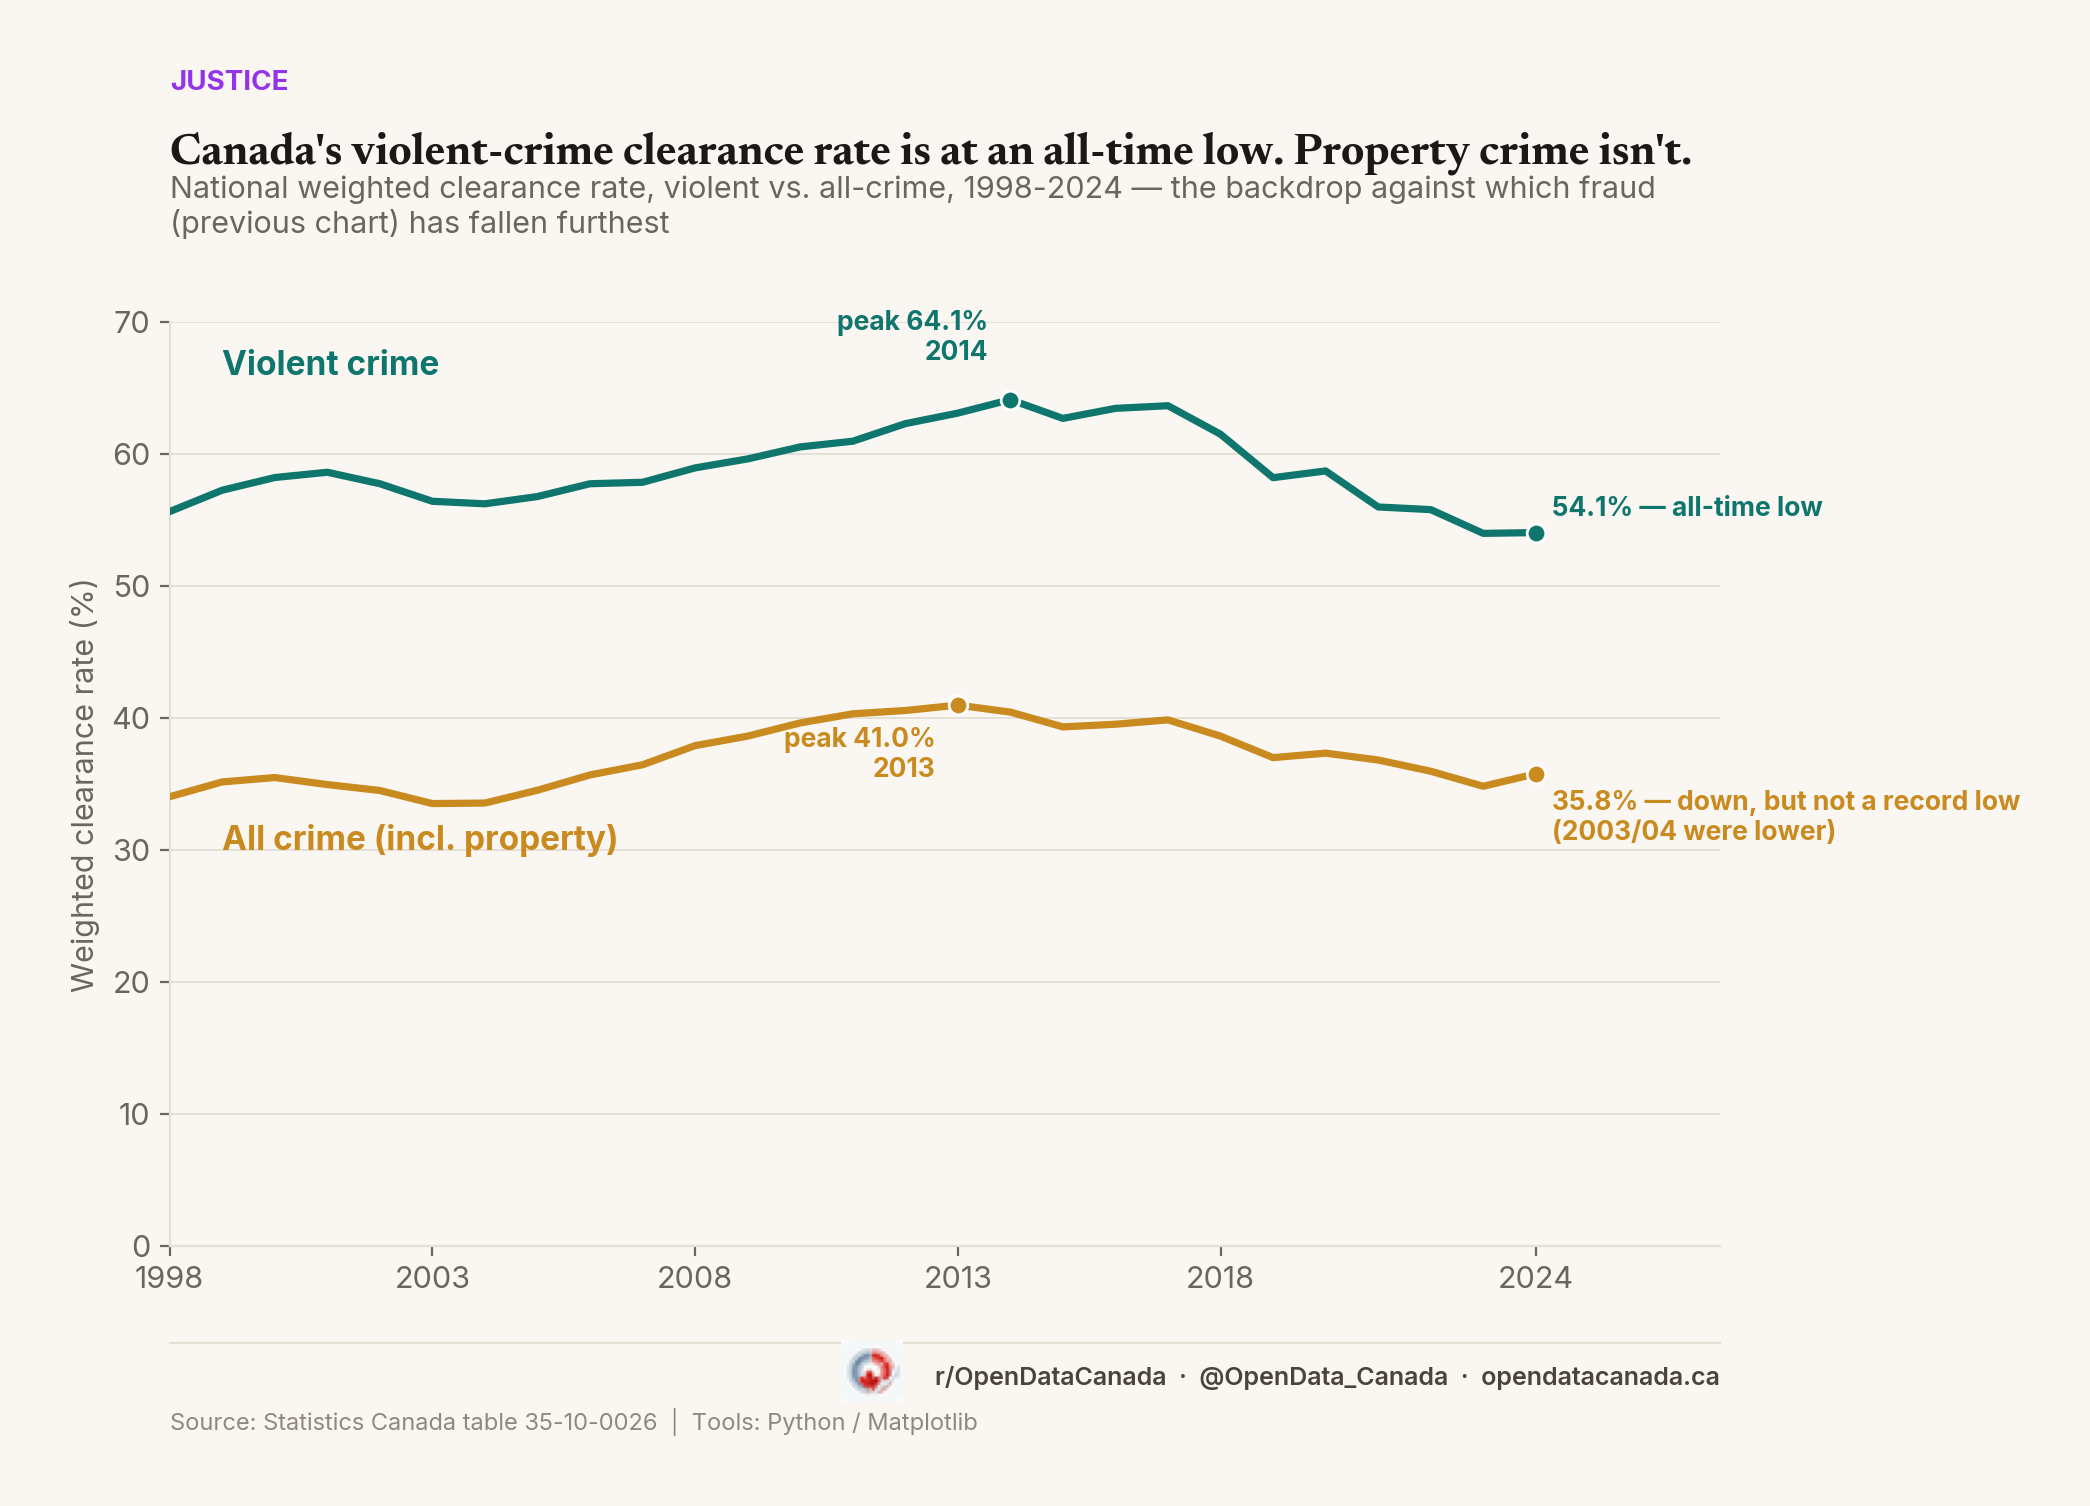
Fraud's collapse is unfolding inside that same decline: violent-crime clearance at a 28-year low as recently as 2023, only partly recovered since, even as overall crime-solving, down from its own peak, remains above its 2003–2004 low.
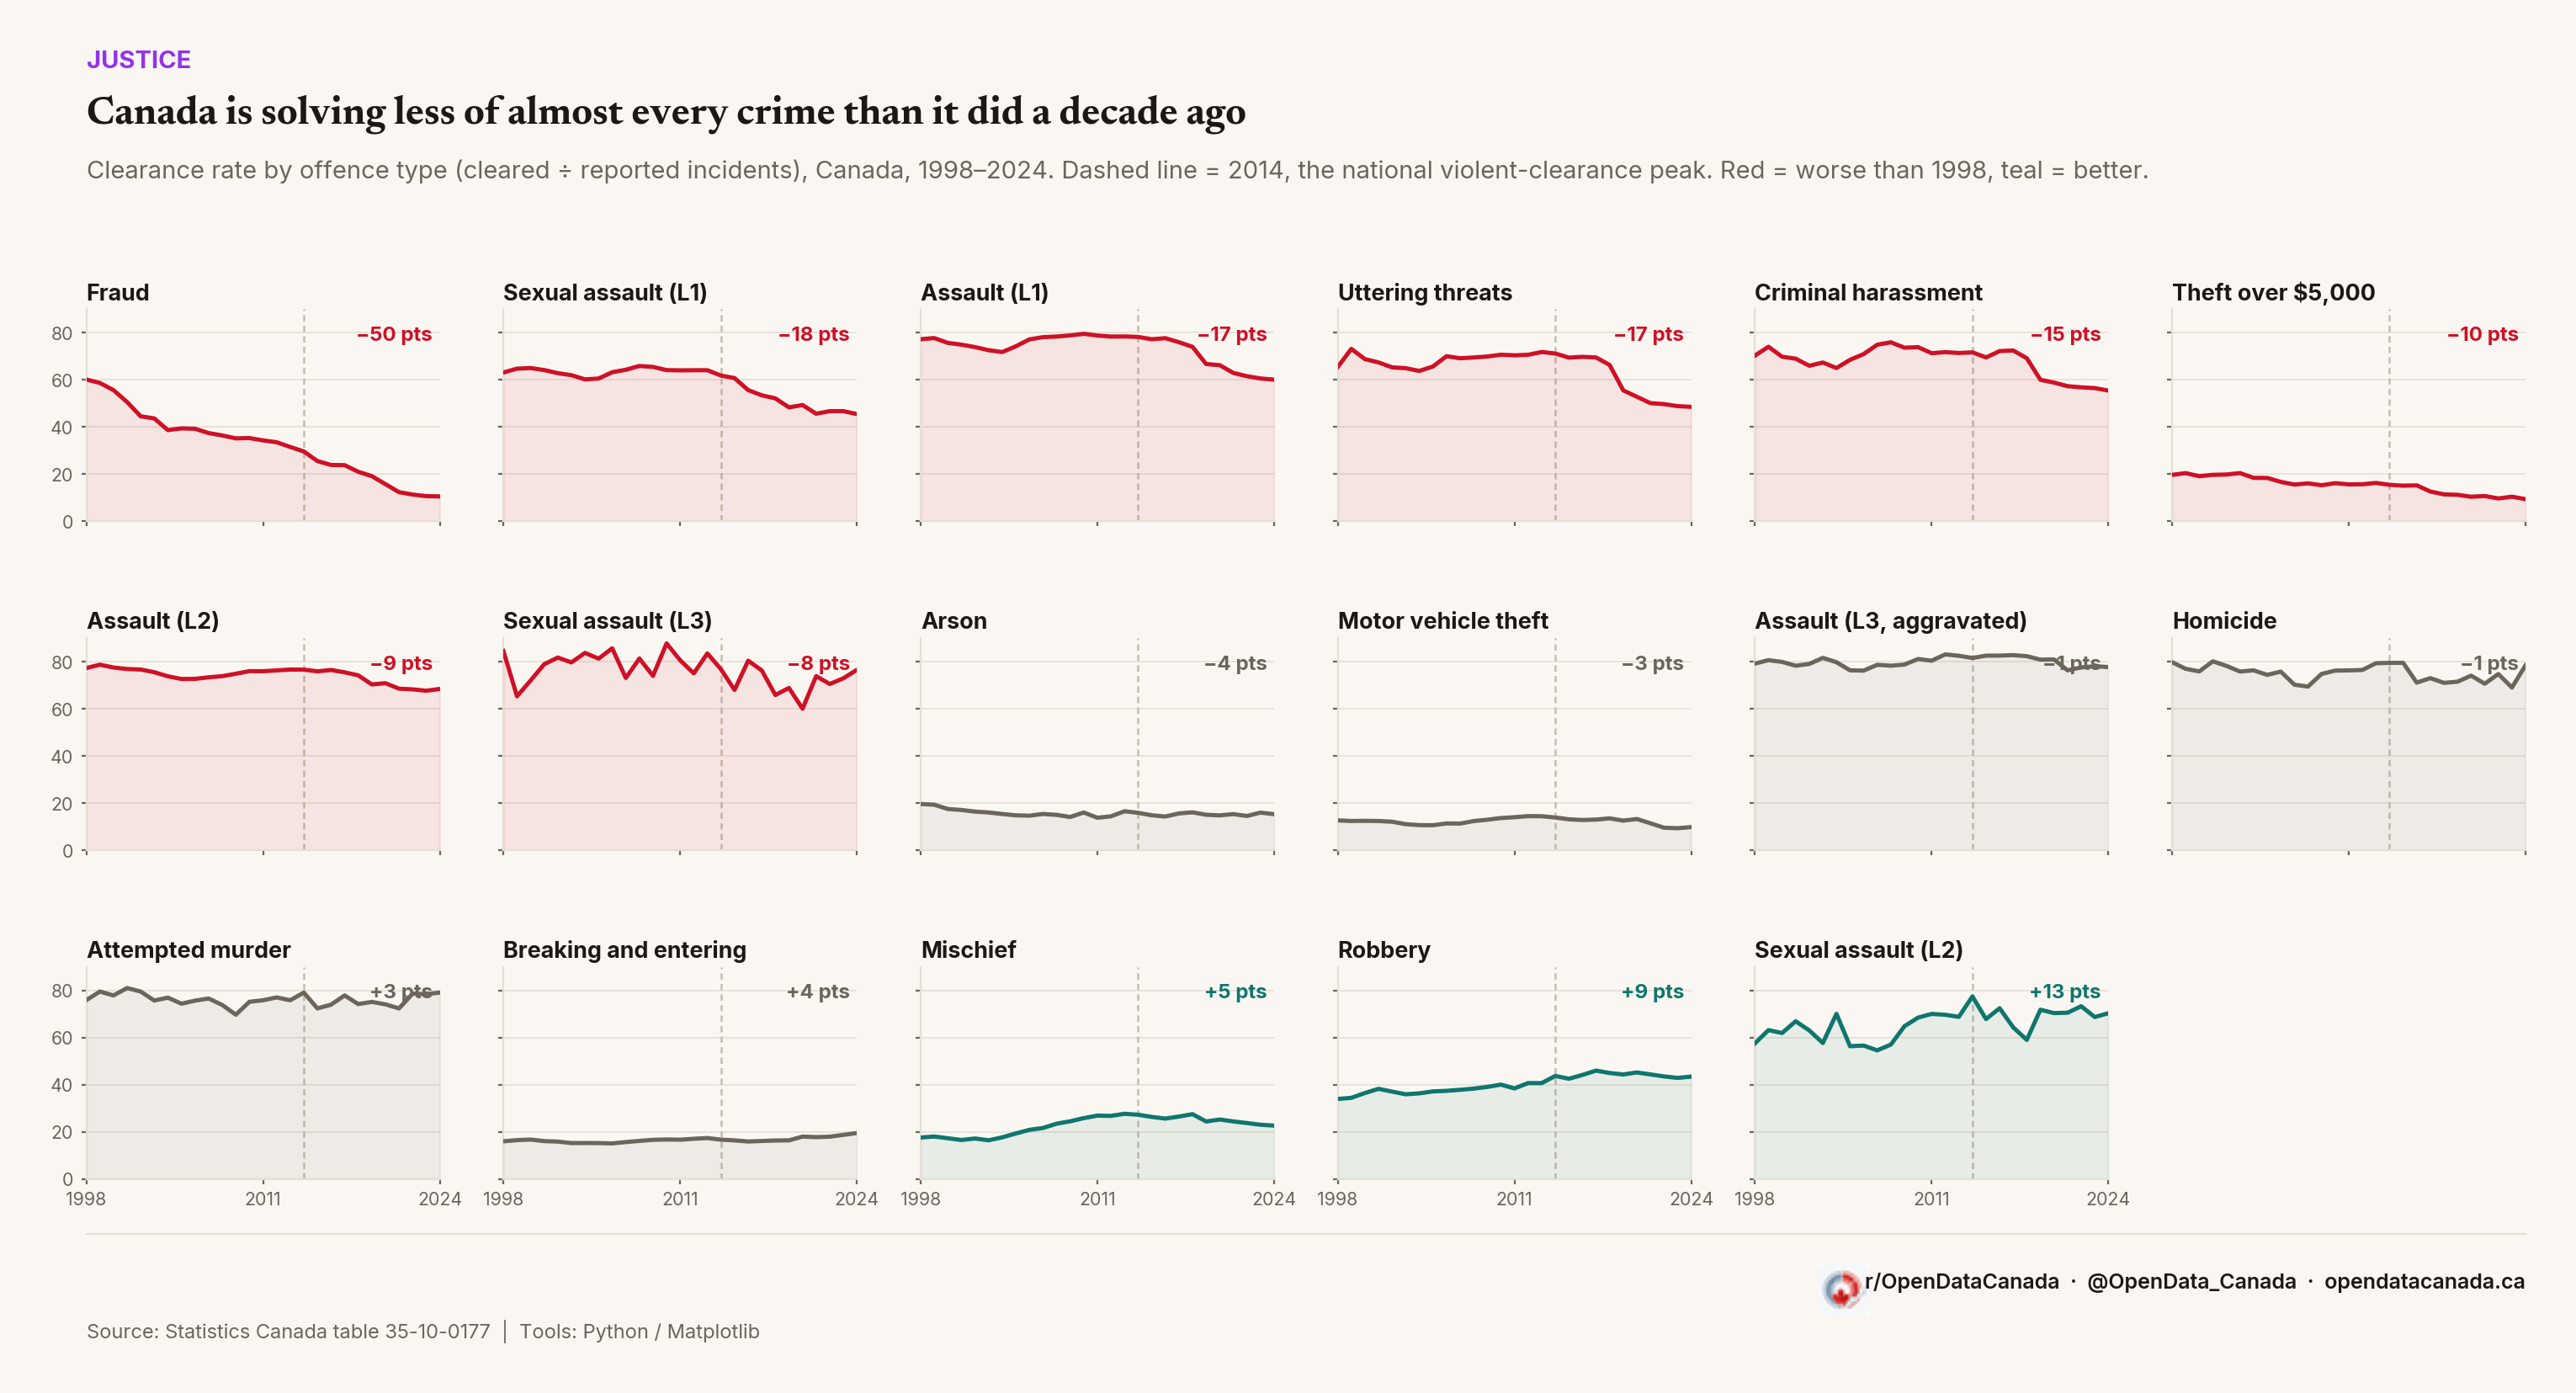
Underneath the "all crime" line, Open Data Canada looked at 17 major offence categories individually. Fraud's –49.9-point decline since 1998 is the largest single move in the data, by a wide margin — the next-largest declines are assault level 1 (–16.5 points) and uttering threats (–16.4 points). Most crimes against the person (assault level 1, sexual assault level 1, uttering threats, criminal harassment) fell substantially over the period, breaking downward within a few years of the 2014 violent-crime peak. Aggravated assault (level 3) is essentially flat across all 28 years (within a point); homicide, close to flat through 2024, shows a modest decline over the full period too (–7.3 points), though with a small annual case count a single year's swing moves that rate a lot. Five categories improved: breaking and entering and mischief modestly (+3.9 and +4.5 points), and robbery, attempted murder, and sexual assault (level 2) more substantially (+9.7, +10.1, and +19.0 points). The full offence-by-offence picture is below, for readers who want to see how fraud compares to every category we checked, not just the property-crime lines on the hero chart.
How this relates to our other clearance-rate coverage
This piece draws on the same StatCan program (Uniform Crime Reporting Survey) as "More cops, less crime?" (May 2026), which used the all-crime weighted clearance rate at the metro level — a different geography-based question from this one. What's new here is the offence-by-offence breakdown underneath the national number, and specifically that fraud, not any violent offence, has seen the single largest clearance-rate decline in the data.
Method and limits
- Fraud and offence-level metric: cases StatCan codes "Total cleared" ÷ "Actual incidents," by offence type, Canada, 1998 vs. 2025 (table 35-10-0177). "Cleared" includes both cleared by charge and cleared otherwise (e.g., the accused died, the complainant declined to proceed) — it is not a charge or conviction rate. This is a simple ratio, not the same as StatCan's published severity-weighted "clearance rate" used in our other coverage (that cube doesn't publish a weighted rate per individual offence, only raw incident and cleared counts).
- National trend metric: StatCan's published weighted clearance rate, violent and all-crime, Canada, 1998–2025 (table 35-10-0026) — this one is severity-weighted, unlike the offence-level figures above. Don't quote the two as directly comparable.
- Offence selection (small-multiples chart): 17 offences chosen for public recognizability out of 314 detailed violation codes in the source cube — not exhaustive.
- Not shown: why. See "Is this just more fraud than police can keep up with?" above — several plausible contributors to fraud's decline exist and none is isolated here.
Data queried from the Statistics Canada Web Data Service. Charts built in Python with Matplotlib.
Data sources
- Statistics Canada, Table 35-10-0177-01 — Incident-based crime statistics, by detailed violations, Canada (1998–2025)
- Statistics Canada, Table 35-10-0026-01 — Crime severity index and weighted clearance rates, national and CMA (1998–2025)