Article · Transit · 7 min read
Rosedale Tops TTC Subway Delay Intensity. The Rest Is Much Less Certain
Our last piece ranked TTC stations by 2025 delay-record counts, weighted for typical-weekday station usage. Records aren't minutes, though: a station can log a lot of delay events that each cost riders almost nothing, or a few that cost a lot. So we reran the analysis using actual delay minutes instead, and put a tougher statistical test on top of it. Rosedale, Donlands, Summerhill and Greenwood all lock in a top-five spot. The fifth is a genuine toss-up among five stations.
TTC Delay Series
- Part 1 · What's Delaying the Subway
- Part 2 · Where It's Worst
- Part 3 · Delay Minutes
Our previous piece built a delay-intensity map by counting 2025 delay records at each station and dividing by typical-weekday station usage. That fixed the busiest-station bias, but it left a different question sitting there: TTC logs a delay record whether or not the incident produced any measurable delay at all — about 65% of 2025 subway delay records carry zero recorded delay minutes. A station with a lot of quickly-cleared, zero-minute events and a station with a few genuinely long ones can post the same record count and look identical on that map. They aren't identical to a rider standing on the platform.
So this time we summed delay minutes per station instead of counting records, adjusted for the same station-usage figures, and re-ran the ranking. We also swapped in a stricter method for the uncertainty question: instead of eyeballing whether two stations' individual confidence intervals overlap, we resampled all 71 stations together, 3,000 times, and asked how often each one actually lands in first place or in the statistical top five. That's a materially harder bar to clear than "the interval touches the top."
The top four are locked in. The fifth spot is anyone's guess.
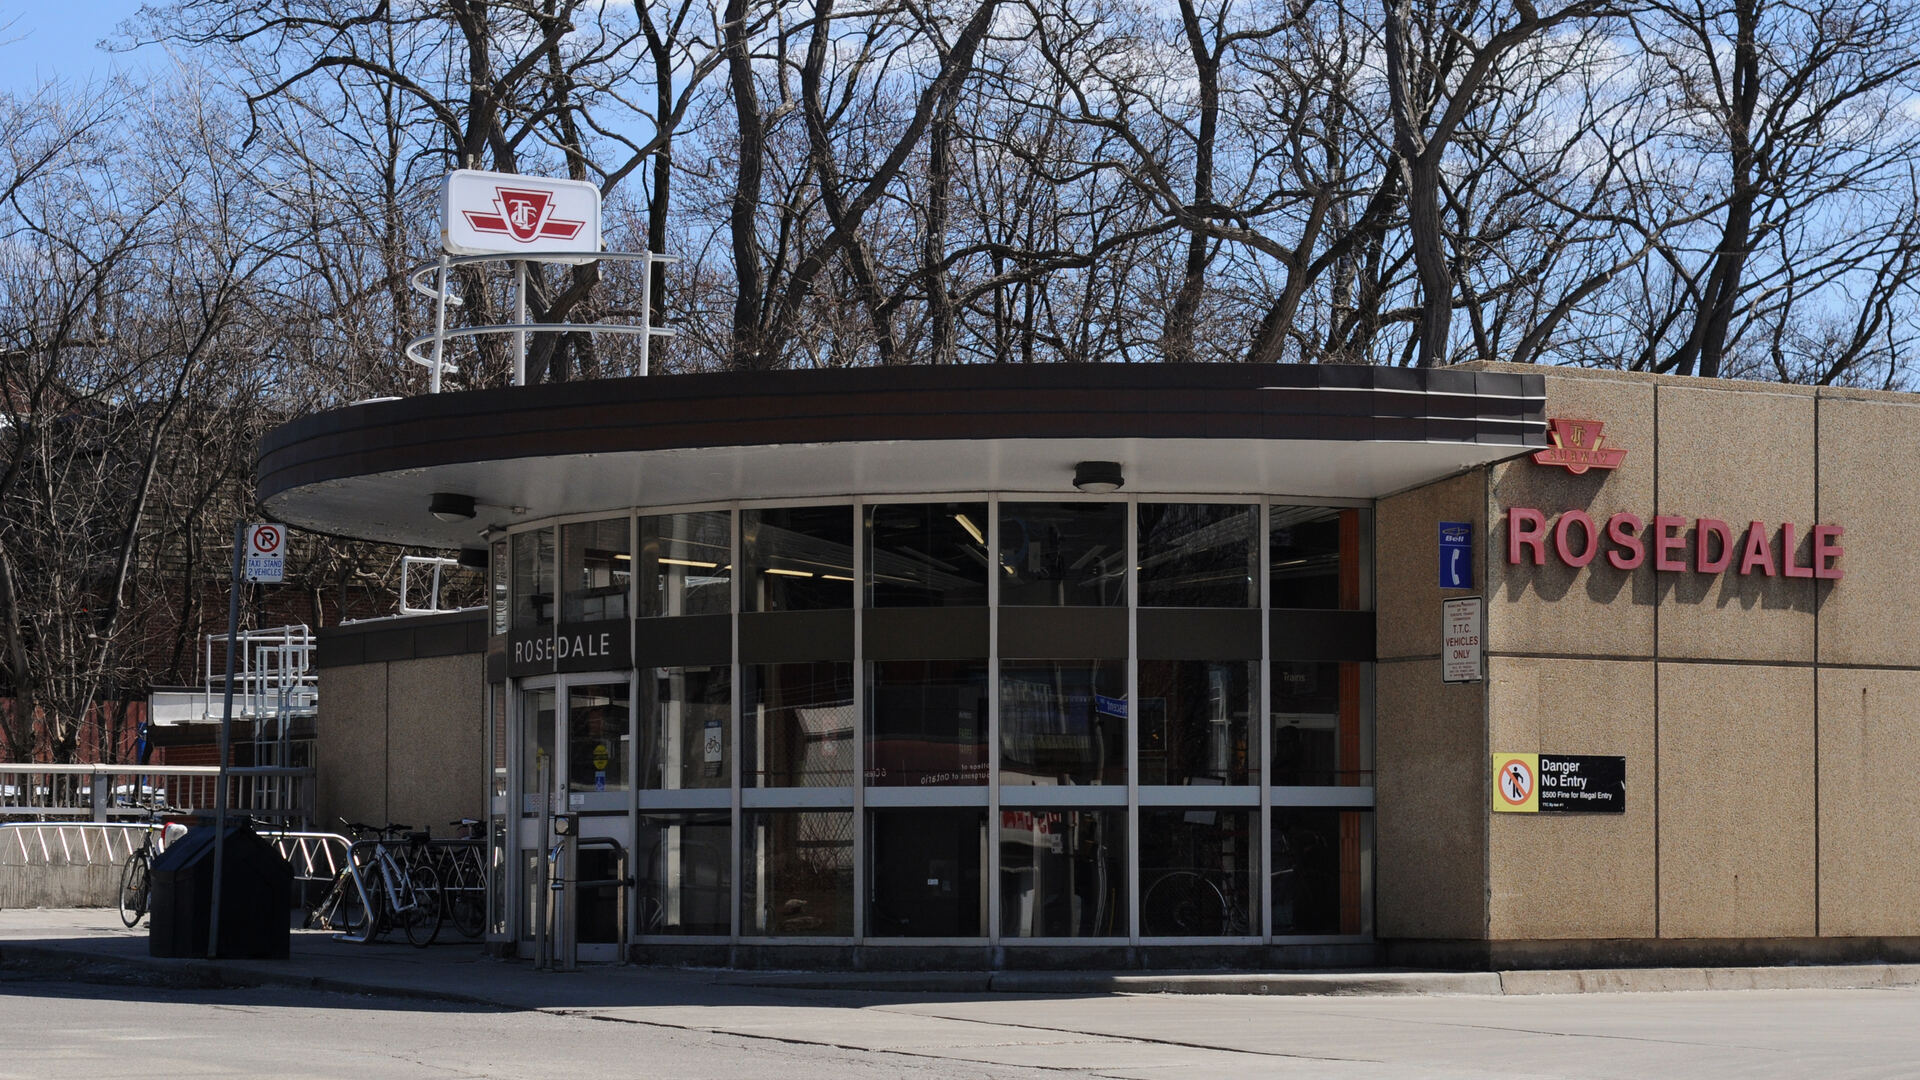
Rosedale topped our records-based ranking in the last piece, and it tops the delay-minutes ranking too — by a wide margin. Its 2025 delay-minutes intensity is 20,103 per 100,000 typical-weekday uses, against a 95% bootstrap range of roughly 16,164 to 24,123. Other stations' individual ranges technically brush against that one, but the joint resampling settles what a simple interval can't: Rosedale wins outright in 96% of resamples, a result no other station comes close to. Donlands and Summerhill, the #2 and #3 stations on the records-based list, hold those same two spots on the minutes-based list too — three names that rank near the top no matter which way you count.
A fourth name joins them on delay minutes specifically: Greenwood, which never cracked the records-based top five, lands in the statistical top five in 93% of resamples — as close to a lock as Donlands or Summerhill. That's four stations with a genuine claim on "top five." The fifth spot is a real fight, not a formality: Davisville (27%), Wilson (23%), Leslie (26%) and Chester (12%) are all plausibly the fifth-worst station in the city, and Broadview, which filled the #5 slot on the records-based list, barely hangs on at 8%. None of the five can prove it belongs there, and none can be ruled out either.
| Station | Delay-minutes intensity | 95% interval | P(worst) | P(top 5) | Tier |
|---|---|---|---|---|---|
| Rosedale | 20,103 | 16,164–24,123 | 96.2% | 100.0% | A |
| Donlands | 15,007 | 11,936–19,044 | 3.2% | 99.8% | B |
| Summerhill | 13,062 | 10,367–15,818 | 0.2% | 96.6% | B |
| Greenwood | 12,763 | 9,960–16,140 | 0.2% | 92.9% | B |
| Davisville | 10,048 | 8,514–11,840 | 0.0% | 26.5% | B |
| Wilson | 9,926 | 8,504–11,674 | 0.0% | 22.5% | B |
| Chester | 9,408 | 7,471–11,538 | 0.0% | 11.7% | B |
| Leslie | 9,228 | 5,090–15,296 | 0.2% | 26.0% | B |
| Broadview | 8,575 | 6,118–11,647 | 0.0% | 8.0% | B |
| Downsview Park | 8,544 | 5,856–11,784 | 0.0% | 8.7% | B |
| Lawrence | 8,185 | 6,199–10,794 | 0.0% | 3.5% | C |
| Coxwell | 7,673 | 6,022–9,859 | 0.0% | 0.8% | C |
Read the last two columns before the intensity column. Point estimates put a strict order on all 71 stations, but P(worst) and P(top 5) are what the resampling actually supports: only Rosedale has a real claim on first place, only four stations (Rosedale, Donlands, Summerhill, Greenwood) clear 90% odds of belonging in the statistical top five, and everything from Davisville on down is a genuine toss-up dressed up as a ranked list.
One weather day nearly rewrote the top five
Every number on this page already excludes 16 February 2025, a confirmed system-wide storm day. Leaving it in would have changed the story: Sheppard West's 2025 delay-minutes intensity nearly qualifies it for the statistical top five once that single day is counted — pull it back out and Sheppard West drops to 15th.
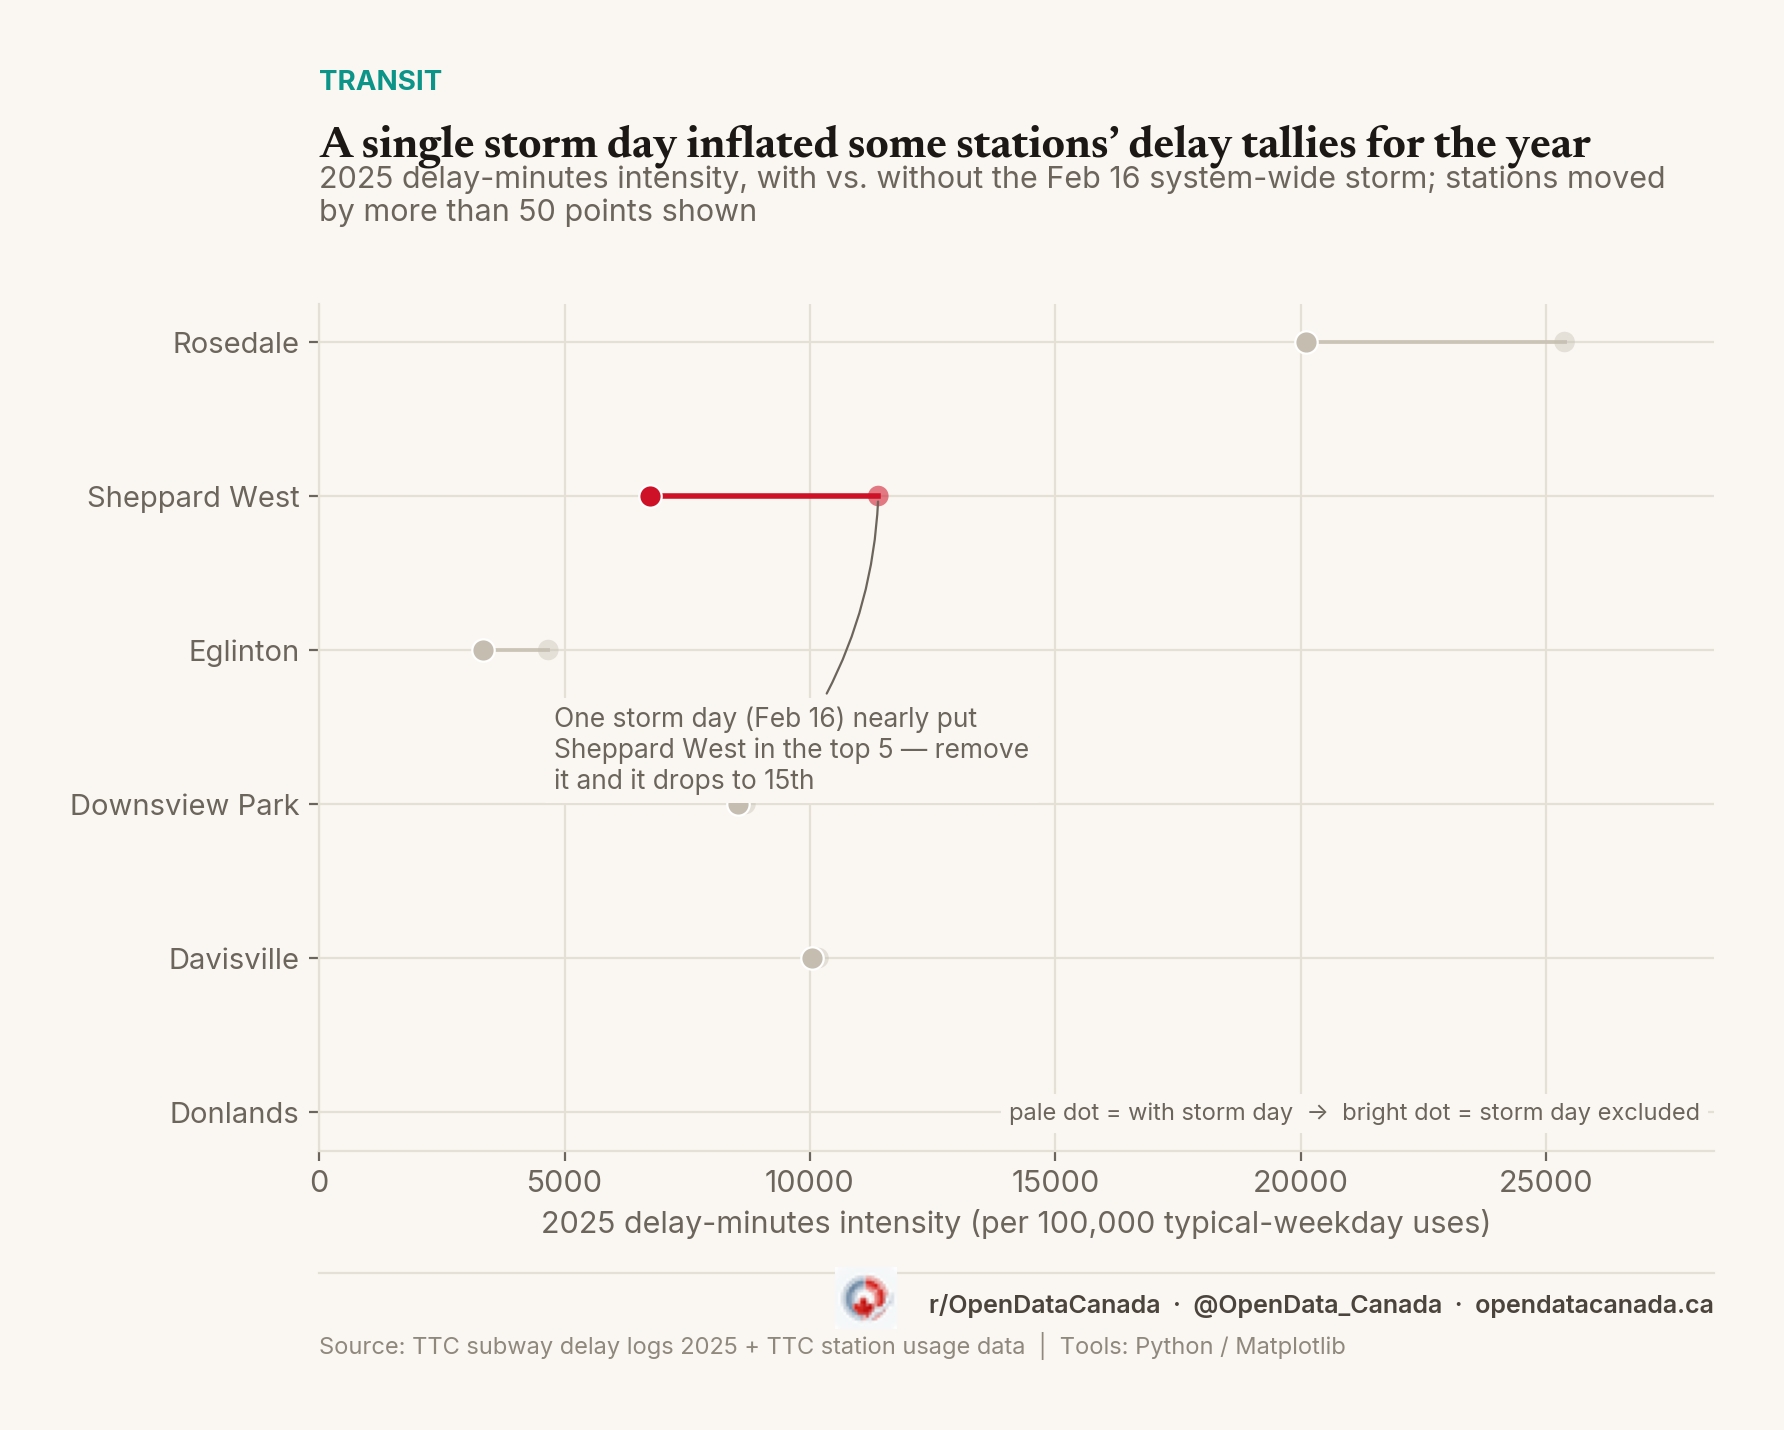
That's a caution about method, not a claim about Sheppard West. A ranking that doesn't strip out its worst weather day is measuring the storm, not the stations.
Where every station lands
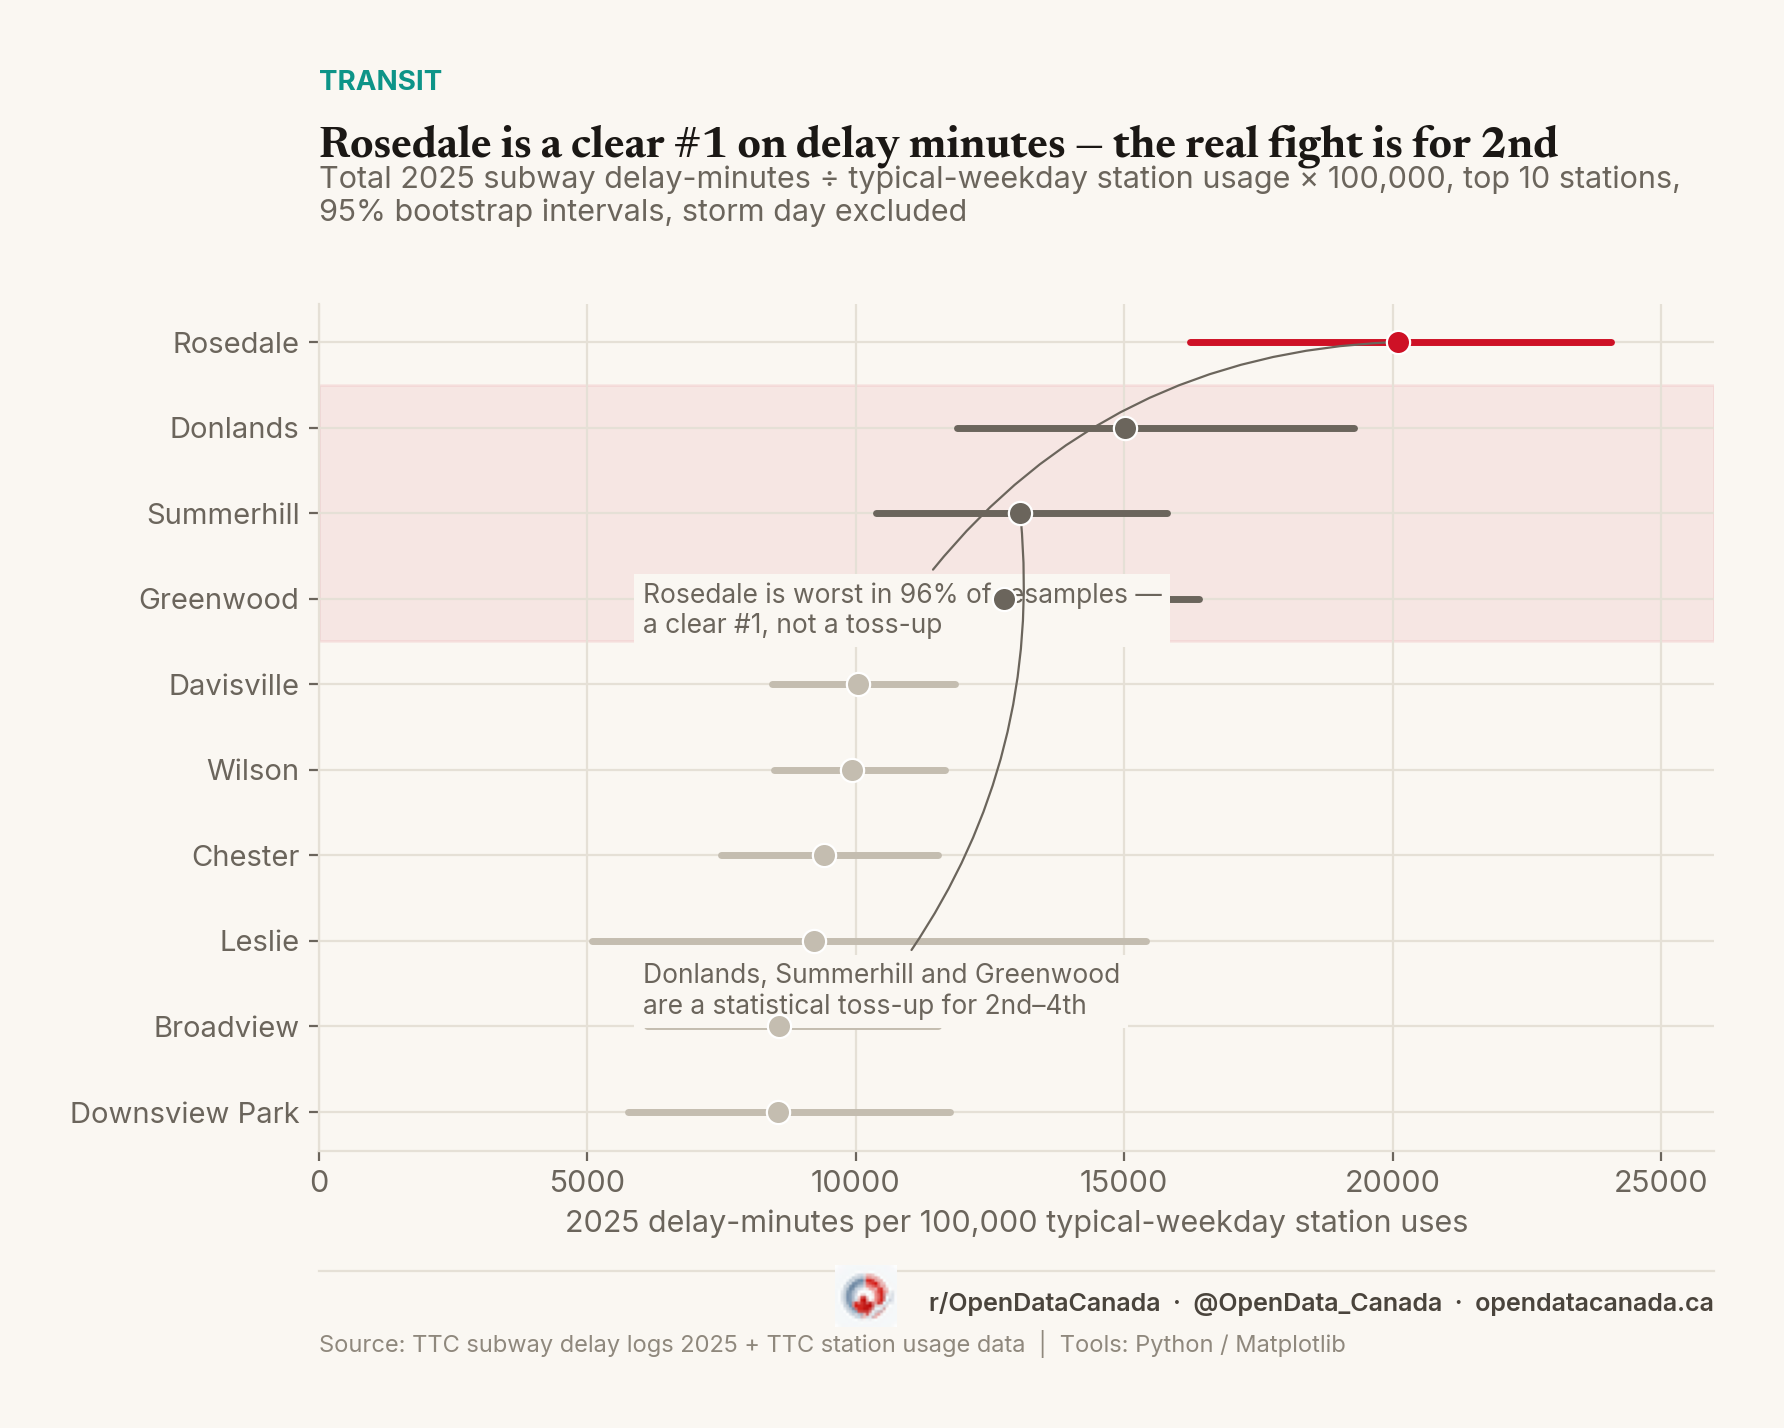
Even Donlands and Summerhill's own point estimates overlap once you widen the lens: their individual 95% ranges brush against each other, so this simple chart can't say with confidence which one is truly second and which is third — only that both are clearly ahead of the fifth-place fight. The joint bootstrap resolves it a little further (Donlands 99.8% top-five odds against Summerhill's 96.6%), but neither claim on second place specifically is airtight.
The interactive map below plots all 71 stations. Rosedale carries a halo ring because it's the only station that clears the 5% threshold for P(worst) — a real, if lonely, first place. The larger pink dots are the "statistical top five" cluster: stations with at least a 5% chance of belonging in that top five, which is a much looser bar than actually being in it. Hover any station for its own delay-minutes intensity, interval, and record count.
Rosedale earned first place in 96% of 3,000 retellings of 2025. Everyone below it is still arguing.
Data and methodology
- Delay minutes: City of Toronto Open Data, TTC Subway Delay Data, calendar year 2025,
min_delayfield summed per station, all matched stations, 16 February 2025 (confirmed system-wide storm day) excluded from every figure on this page. - Station usage: TTC Subway Ridership 2023-2024, the same typical-weekday station-usage figures used in our previous piece, covering September 2023 through August 2024.
- Delay-minutes intensity: total 2025 delay minutes ÷ typical-weekday station usage × 100,000, i.e. "2025 delay minutes per 100,000 typical-weekday station uses." An annual intensity measure, not a literal daily rate.
- Uncertainty: a joint bootstrap, not station-by-station intervals. We resampled all 71 stations' delay-minute records simultaneously, with replacement, 3,000 times. In each of the 3,000 iterations we ranked all 71 stations against each other and recorded whether a station landed in first place or in the top five for that iteration. P(worst) and P(top 5) are the share of iterations where that happened — a measure of how often a station wins the head-to-head resample, not a model of year-to-year variation in incident counts — a station's own confidence interval can overlap a rival's and still lose almost every head-to-head resample, which is why we report both. The 95% interval shown per station is the 2.5th–97.5th percentile of that station's own bootstrap distribution.
- Tiers on the map: Tier A (halo ring) requires P(worst) ≥ 5%; Tier B requires P(top 5) ≥ 5% and isn't already Tier A; everything else is Tier C, sized continuously by its own intensity.
- Station count: 71 rows, matching our previous piece's station set and station-combination rules (Bloor-Yonge kept as two rows; St George, Spadina and Sheppard-Yonge combined into one row each using their two-line usage totals). TTC counts subway interchanges once, putting its own station total in the same range once Line 1, 2 and 4 are counted on their own.
- What this doesn't show: why any station's delay minutes are high, whether the same riders are affected every time a record is logged, or that stations outside the shaded tiers on the map are "fine." It doesn't show that Rosedale causes the most delays system-wide, or that its riders lose the most total time — a small, lightly used station can post a high per-rider intensity number without moving the system's total delay-minute count much at all. It shows which stations accumulated the most 2025 delay time relative to their own typical-weekday activity, and how confident a resampling test is in each station's rank — nothing about cause.