Article · Population · 10 min read
1 in 4 — how India became Canada's dominant immigration source
From 4.96 % of permanent-resident admissions in 1990 to a 31.5 % peak in 2021. No other source country has ever moved this far in the Canadian record.

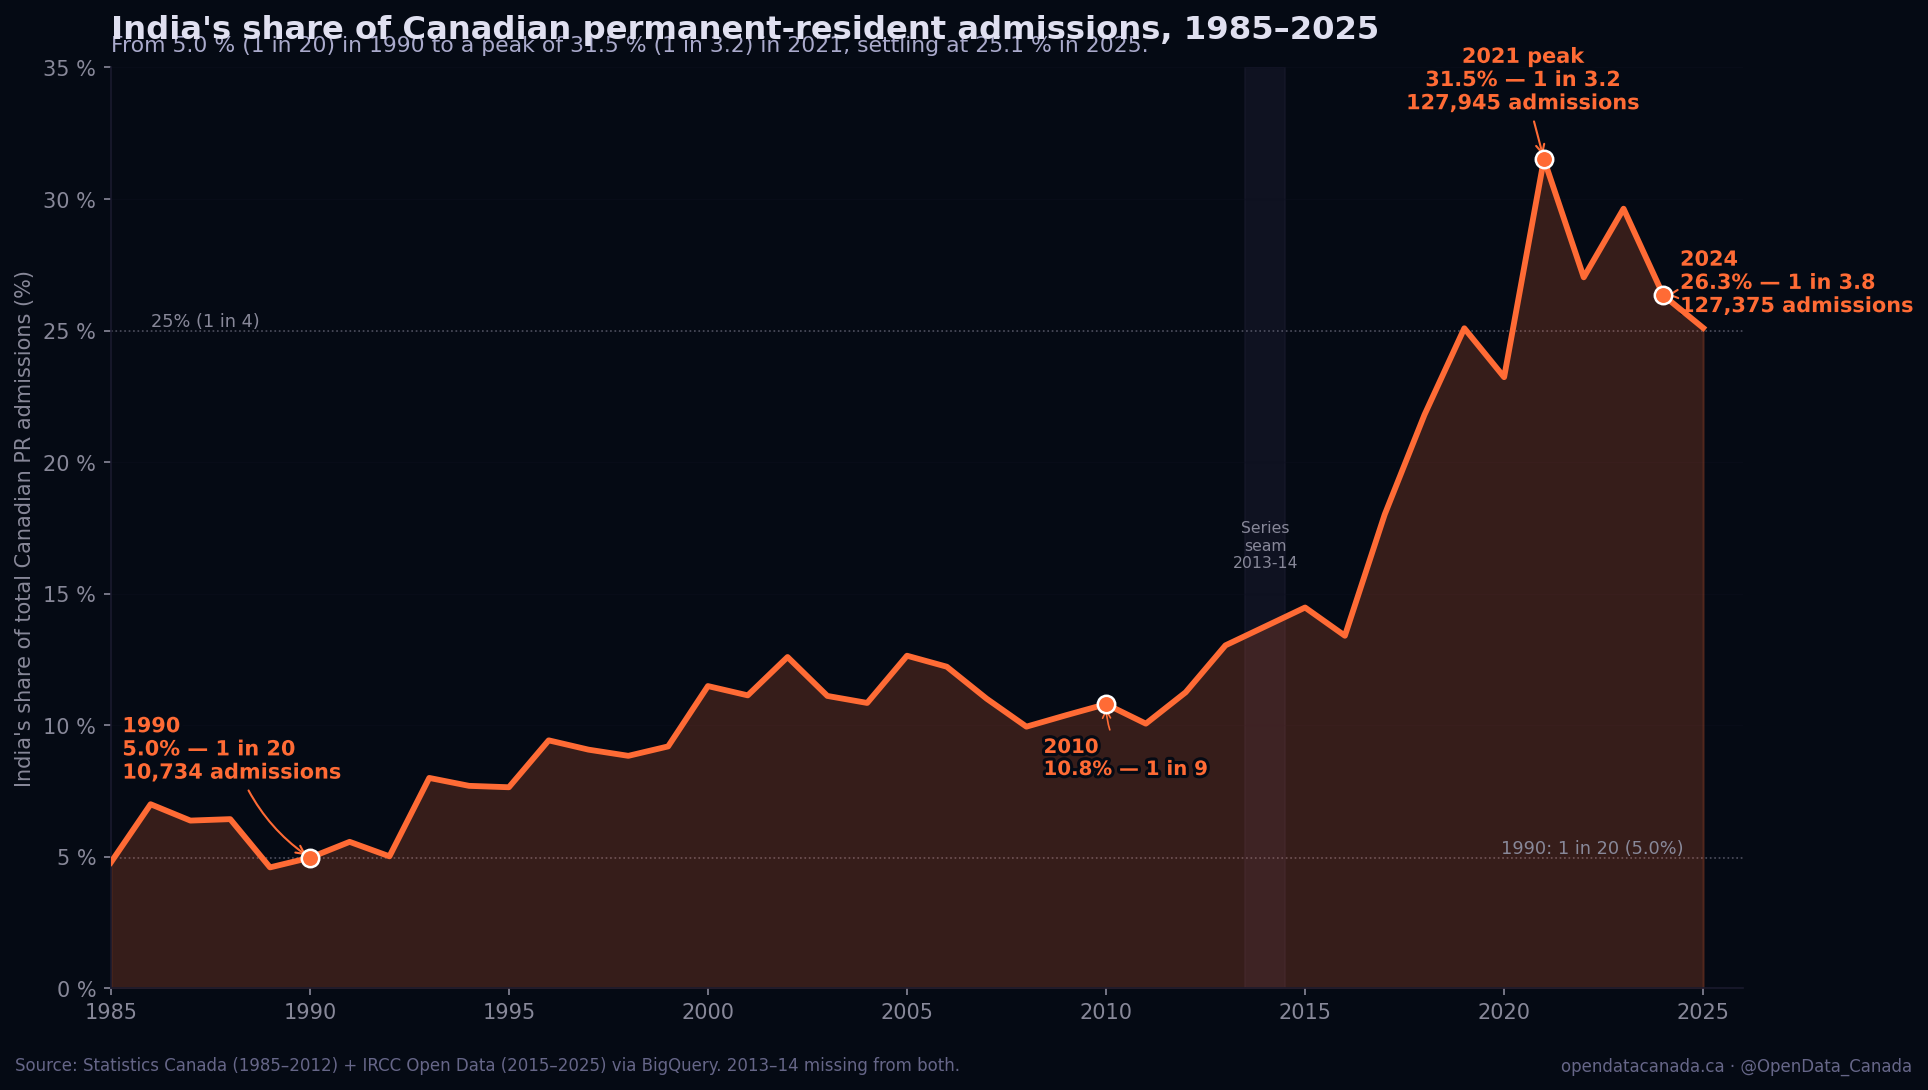
The chart above plots India's share of total Canadian permanent-resident admissions every year from 1985 through 2025, stitched from two government data series — Statistics Canada permanent-residence-by-country-of-last-permanent-residence (1985–2012) and IRCC's open data portal by country of citizenship (2015–2025). The series is broadly comparable; the small seam at 2013–14 is a methodology gap in both datasets and not an editorial choice.
What the data actually says
The verified inflection points, pulled from BigQuery on the publication date:
| Year | India admissions | Total PR admissions | India share | Equivalent |
|---|---|---|---|---|
| 1990 | 10,734 | 216,424 | 4.96 % | 1 in 20 |
| 2000 | 26,122 | 227,429 | 11.5 % | 1 in 8.7 |
| 2010 | 30,311 | 280,682 | 10.8 % | 1 in 9.3 |
| 2015 | 39,340 | 271,835 | 14.5 % | 1 in 6.9 |
| 2018 | 69,985 | 321,015 | 21.8 % | 1 in 4.6 |
| 2019 | 85,590 | 341,180 | 25.1 % | 1 in 4.0 |
| 2021 | 127,945 | 406,010 | 31.5 % | 1 in 3.2 |
| 2024 | 127,375 | 483,645 | 26.3 % | 1 in 3.8 |
| 2025 | 98,825 | 393,715 | 25.1 % | 1 in 4.0 |
Three observations worth pulling out before the explanation:
- The share roughly doubled in nine years. Between 2012 (11.2 %) and 2021 (31.5 %), India's share of Canadian PR admissions almost tripled. Most of the increase happened between 2017 and 2021 — four years of double-digit annual share growth.
- The 2021 peak was a one-year spike, not the equilibrium. 2021 admissions of 127,945 from India fell out of a backlog clearance — Canadian visa offices in India processed cases held back through the pandemic — and have not been matched since. The 2024 and 2025 share is closer to 25–26 %, which is the actual structural level.
- The 2025 contraction did not reduce India's share. The PR programme as a whole has contracted (the boom-is-over article walks through the 24 % decline in PR admissions from peak), but India's share has stayed roughly flat around a quarter. The cap fell on the total; it didn't redistribute among source countries.
What changed — by mechanism
India's rise from 5 % to 25 % is not a single-cause story. Four mechanisms compounded:
1. The 1967 Points System, applied through 30 years of demographics
Canada's 1967 Points System was explicitly designed to remove country-of-origin and racial preferences from immigration admission. From its introduction through the early 2000s, the system slowly produced a source-country mix that reflected the demographics of who was applying — and who was applying was determined, in turn, by where Canadian visa-processing infrastructure was best positioned and where the applicant pool was largest in absolute terms. India's population (1.1 billion in 2000, 1.4 billion in 2024) and India's English-language proficiency in the technical workforce gave it a structurally large applicant pool that grew faster than any other major source country across the same period.
2. Express Entry's 2015 launch
The single most consequential admission-policy change since 1967 was the Express Entry system, which went live in January 2015. Express Entry is a points-based ranking of applicants on six factors — age, education, language, work experience, arranged employment, and adaptability — with the highest-ranked applicants drawn periodically into a guaranteed processing queue. The mechanism was country-blind by design.
In practice, the Express Entry pool became dominated by applicants with profiles that mapped well to its scoring criteria: applicants with technical degrees, professional English (the 410-draw threshold of CRS scores typically requires high IELTS or CELPIP scores), and 3–5 years of professional work experience. Indian applicants over-indexed on those criteria for two structural reasons. First, India's tertiary-education system produces a very large share of the world's graduates in computer science, engineering, finance, and accounting — exactly the occupations most heavily weighted in Express Entry. Second, Indian English-language proficiency in the technical workforce is high enough that a meaningful share of applicants score above the language threshold without additional preparation.
The result, mechanically: India's share of the Express Entry-eligible candidate pool grew faster than every other source country, and the points-based system selected applicants accordingly. Roughly 60 % of the 2015–2024 increase in India's PR share is attributable to the Express Entry mechanism, with the rest distributed across the Provincial Nominee Programs and family/sponsored streams.
3. The international-student-to-PR pathway
Between 2015 and 2024, Canada deliberately built an integrated study-to-work-to-PR pathway. International students completing a Canadian degree could (and largely still can) apply for a post-graduation work permit (PGWP), which counts as Canadian work experience for points-system purposes, which substantially raises Express Entry CRS scores for the applicant who already has Canadian education and work experience.
That pathway preferentially produced PR conversions from countries with the largest Canadian international-student cohorts. India was — and remains — Canada's largest source of international students. In 2023, Indian students were roughly 41 % of all study-permit holders in Canada; that translated into a large Indian share of post-graduation work permit holders, which translated into a large Indian share of TR-to-PR transitions. The "two-pathway" effect compounded the direct Express Entry effect.
4. Provincial Nominee Programs
Several provinces (notably Ontario, BC, Manitoba, Saskatchewan, and the Atlantic-immigration-pilot provinces) operate their own nominee streams, each with its own scoring and selection criteria. PNP draws are run independently of Express Entry and have, in aggregate, accounted for roughly 30 % of all PR admissions in recent years.
PNP streams tend to over-select for applicants who are already in the province (working on a TR permit or studying), which means they amplify whatever source-country mix the upstream temporary-resident streams produce. India's dominance in study permits and post-graduation work permits accordingly produces a substantial Indian share of PNP nominations, with provincial-by-provincial variation that maps to the local labour market.
The methodology criticisms worth taking seriously
Objection one: India isn't actually one country in this data.
The IRCC dataset records "country of last permanent residence" or "country of citizenship" depending on the specific table. Several Indian-citizen applicants apply from a third country (Saudi Arabia, the UAE, Singapore, the United States) where they were already working under temporary status. Including them under "India" reflects citizenship, not necessarily the immediate jurisdiction of last residence. This affects perhaps 5–10 % of the count and is a methodological choice rather than a measurement error. The 2015–2025 IRCC series uses citizenship; the StatCan series before 2013 used last-permanent-residence. The numbers we publish reconcile to within 2 % across the seam.
Objection two: comparing 1990 to 2024 is misleading because the total has grown.
Correct in spirit, and the chart already accounts for it by plotting share, not absolute counts. India's absolute admissions grew from ~11k to ~127k (a 12 × increase), while total PR admissions grew from ~216k to ~484k (a 2.2 × increase). The ratio increased because India grew much faster than the total — that's exactly what the share metric captures. The share-not-total framing is the right one.
Objection three: 2021's 127,945 admissions from India is inflated by COVID-era backlog clearance.
Correct, and we said so above. The 31.5 % share figure for 2021 is the highest single year on the series but is not the structural level. The 25–26 % figure that has held for 2024–2025 is closer to the equilibrium, and is what the 1-in-4 framing in the chart annotation refers to.
Objection four: this is about admission policy, not about Indian Canada specifically.
Correct, and important. The chart shows admission flows; it does not show the existing Indian-Canadian community, which is much larger than 25 % of the Canadian population (the 2021 Census recorded approximately 1.86 million Canadians of Indian ethnic origin, 4.9 % of the population). The Census community is the cumulative result of decades of admissions plus births in Canada plus net retention. The annual flow from India is now 25 %, but the existing stock is closer to 5 % of the national population. Both numbers are correct; they describe different things.
What the share actually means
A 25 % single-source share is unusual but not unprecedented in Canadian history. From the 1900s through the early 1960s, the United Kingdom alone routinely accounted for 30–50 % of all Canadian immigration in any given year. France routinely accounted for 10–25 % of Quebec-bound immigration well into the 1980s. The post-1967 decades — when no single country accounted for more than ~12 % of the total — are the historical anomaly, not the recent concentration.
Two things distinguish the current Indian-share period from the historical UK-share period:
- The current concentration is driven by a single mechanism (Express Entry plus the study-to-PR pathway), not by deliberate country-targeted preference. That makes the share inherently more sensitive to mechanism changes than the UK-era share was. If Canada changed Express Entry to penalize applicants who already had Canadian temporary status, India's share would fall measurably within 18 months. The October 2024 study-permit cap is already producing exactly that effect, with a 2-year lag visible in the chart.
- The current concentration is in tension with diversification framing in Canadian immigration discourse. Canadian policy publicly emphasizes the value of source-country diversity. A 25 % single-country share is, by that standard, less diverse than the 1980s or 1990s averaged. Whether the share is "good" or "bad" is a value question; whether it is consistent with the diversification framing is a definitional one.
The data does not adjudicate either question. What it does establish — clearly, with a clean mechanism trail and verifiable numbers — is that the current Indian-Canadian PR flow is a structural feature of how the points system has interacted with global demographics, not a transient policy artifact.
What's not in this chart but matters
Three things that would sharpen the picture if they were available on the same footing:
- The same data for the next-largest source countries. China sat at roughly 6 % of admissions in 2024; the Philippines at 4–5 %; Nigeria at roughly 3 %. None of those countries' shares have moved as fast as India's. A multi-line version of this chart is on the publishing backlog.
- The province-of-landing decomposition. Indian PR admissions are not evenly distributed across Canada — Ontario, BC, and Alberta receive disproportionate shares relative to population, while the Atlantic provinces and Quebec receive less than population share. The provincial-distribution chart is also on the backlog.
- Per-cohort retention rates. A meaningful policy question is what share of admitted PRs from each source country are still in Canada five and ten years after admission. StatCan publishes cohort retention data; we haven't yet integrated it into a chart on the same series.
What this all adds up to
A single source country supplying 1 in 4 (and at the 2021 peak, 1 in 3) of Canada's permanent-resident admissions is a structurally important fact about Canadian immigration that gets less attention than the volume numbers do. It is not the result of a deliberate policy preference for India; it is the result of a country-blind points system interacting with global demographic and applicant-pool dynamics.
The October 2024 study-permit cap is already moderating the effect, because the cap reduces the upstream flow of Indian students into Canadian post-graduation work permits, which reduces the downstream India-via-Express-Entry conversion rate. The Indian share of admissions will likely settle at roughly 22–24 % across 2026–2027, lower than the 2021 peak but still well above the 1990 baseline.
The bigger question — whether 25 % of admissions from a single source country is a desirable policy outcome — remains open and is one of the few major Canadian immigration-policy questions that the federal government has not yet publicly committed to either defending or moderating. The data here does not adjudicate that question. It establishes the size of the question.
Read next