Article · Labour · 7 min read
Canada has lost 111,000 full-time jobs since January. Quebec is taking the worst of it.
April was the fourth straight monthly decline in full-time employment. Unemployment hit a six-month high. Wages still grew 4.5 percent year-over-year. The headline number of −18,000 hides what is happening underneath it.
The headline understates it
Statistics Canada's April 2026 Labour Force Survey reports a net employment decline of 17,700 jobs and an unemployment rate of 6.9 percent — a six-month high, up from 6.7 percent in March. Economists had penciled in a small gain. The print missed.
But the headline mixes two opposite trends and gives you the small difference between them. Full-time employment fell by 47,000 jobs in April. Part-time employment rose by 29,000. The economy did not lose 18,000 jobs in April. It lost 47,000 full-time positions and replaced a little over half of them with part-time work.
The pattern is not new. It is now four months old.
| Series | January–April 2026 |
|---|---|
| Total employment, net change | −112,000 (−0.5 %) |
| Full-time, net change | −111,000 (−0.6 %) |
| Self-employed, year-over-year | −55,000 (−2.0 %) |
| Year-over-year total employment | +67,000 (+0.3 %) |
The Canadian labour market is not in collapse. Year-over-year, employment is still up 67,000. But the trend over the first four months of 2026 is a quiet, sustained loss of full-time work, masked at the headline level by part-time gains and at the year-over-year level by the strength of late 2025.
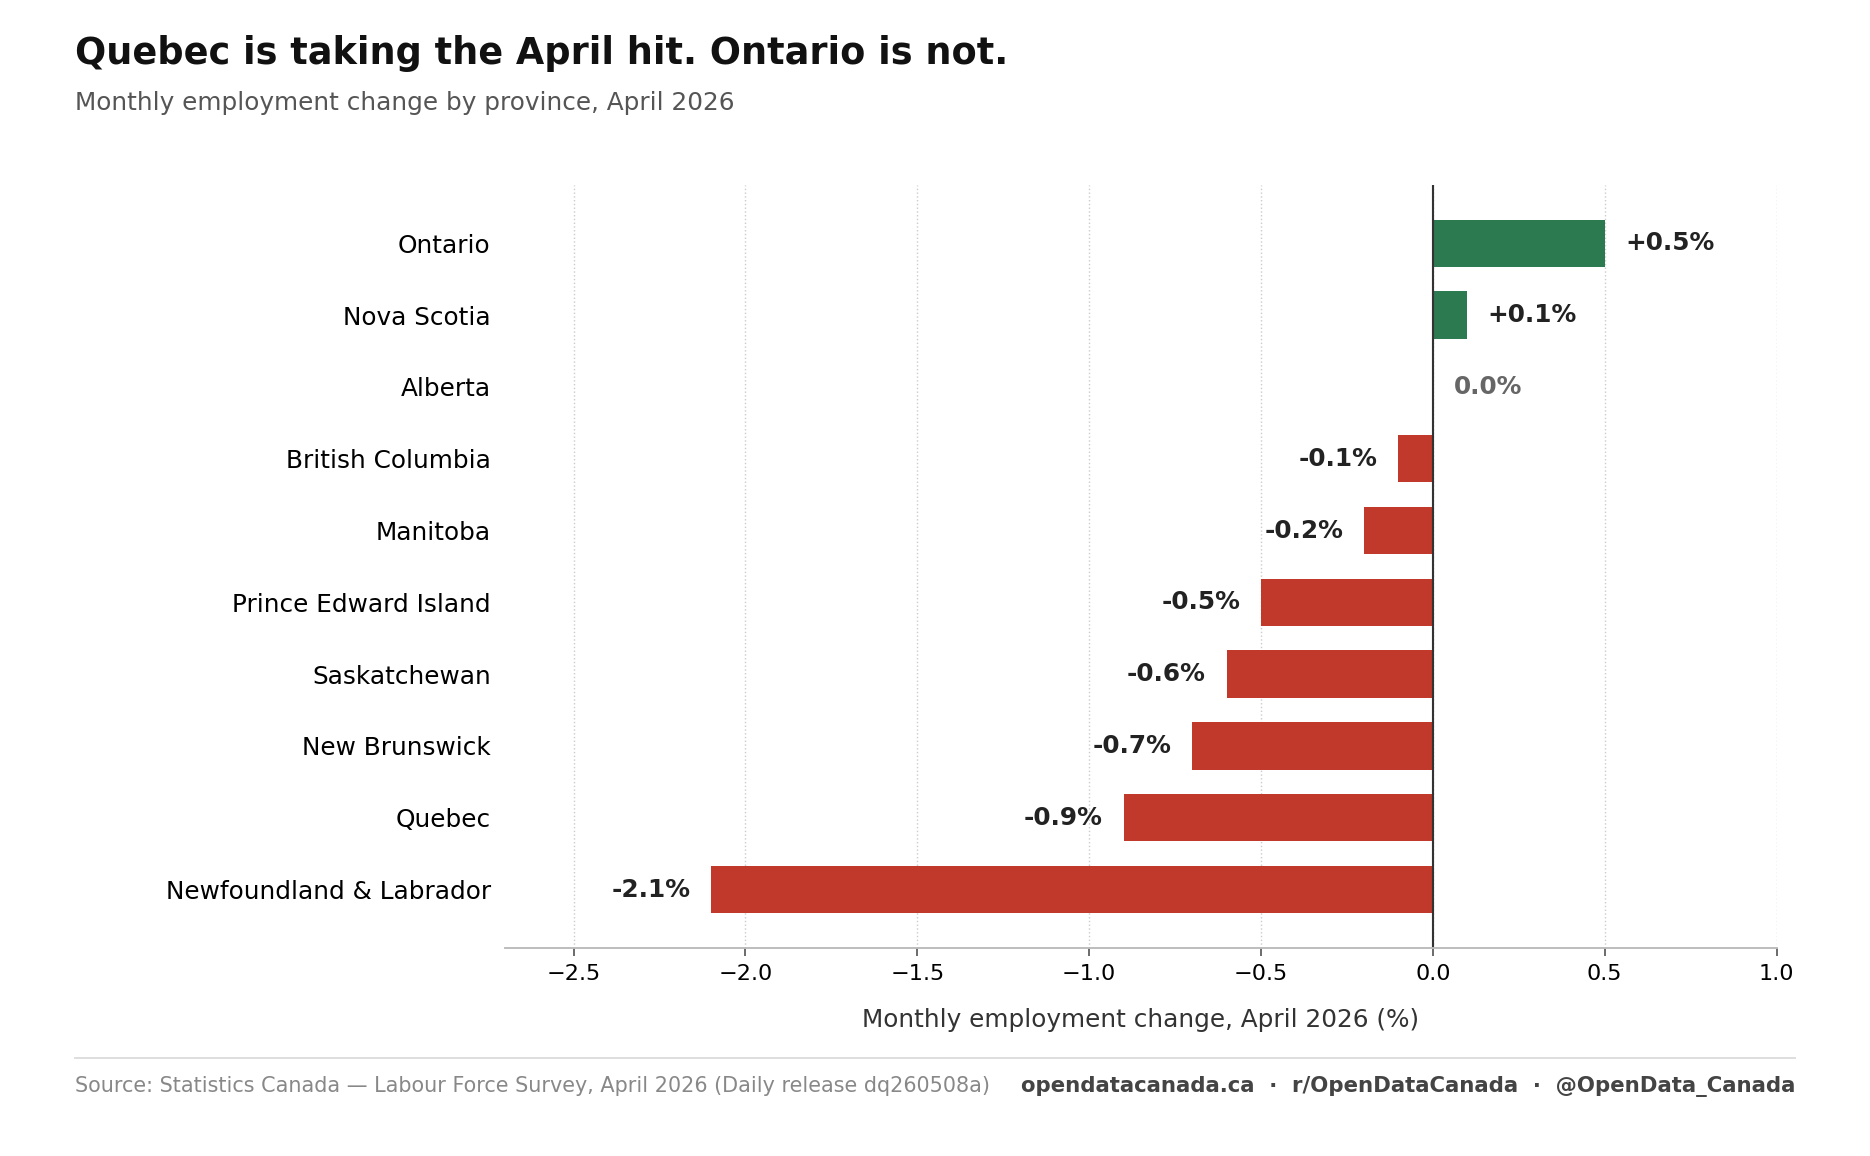
Quebec is taking the tariff hit
The geography of the April decline is striking. Ontario, the province most discussed in tariff coverage, added 41,000 jobs in April (+0.5 percent) and saw its unemployment rate edge down to 7.5 percent. Quebec lost 41,000 jobs in the same month (−0.9 percent) and its unemployment rate jumped 0.8 percentage points to 6.2 percent.
Zoom out to the four-month view and the asymmetry sharpens. Quebec has lost 91,000 jobs since January — a 1.9 percent decline. The Montréal census metropolitan area alone has lost 56,000 jobs (−2.3 percent), and its unemployment rate has risen 1.3 percentage points to 7.7 percent. There is no province in Canada with a comparable four-month deterioration.
This is consistent with the underlying exposure pattern. Quebec runs Canada's aluminum smelting industry, its aerospace cluster (Bombardier, CAE, Pratt & Whitney Canada), and a dairy and supply-managed food sector that is structurally exposed to U.S. trade policy. Ontario's auto sector is more visible in tariff headlines, but Ontario also has Toronto's financial-services concentration, a public-sector base broader than Quebec's relative to population, and a healthcare hiring pipeline that is currently leading the country.
The other provincial movers are smaller in absolute terms but worth noting:
- Newfoundland and Labrador: −2.1 percent in a single month, unemployment back into double digits at 10.0 percent. Small province, large monthly noise — but the level is the highest in the country.
- Saskatchewan: −0.6 percent, unemployment +0.6 points to 5.6 percent.
- Manitoba: tightest labour market in the country at 5.0 percent unemployment, down 0.6 points on the month.
- Alberta: flat employment, unemployment up 0.5 points to 7.0 percent — labour force grew faster than jobs.
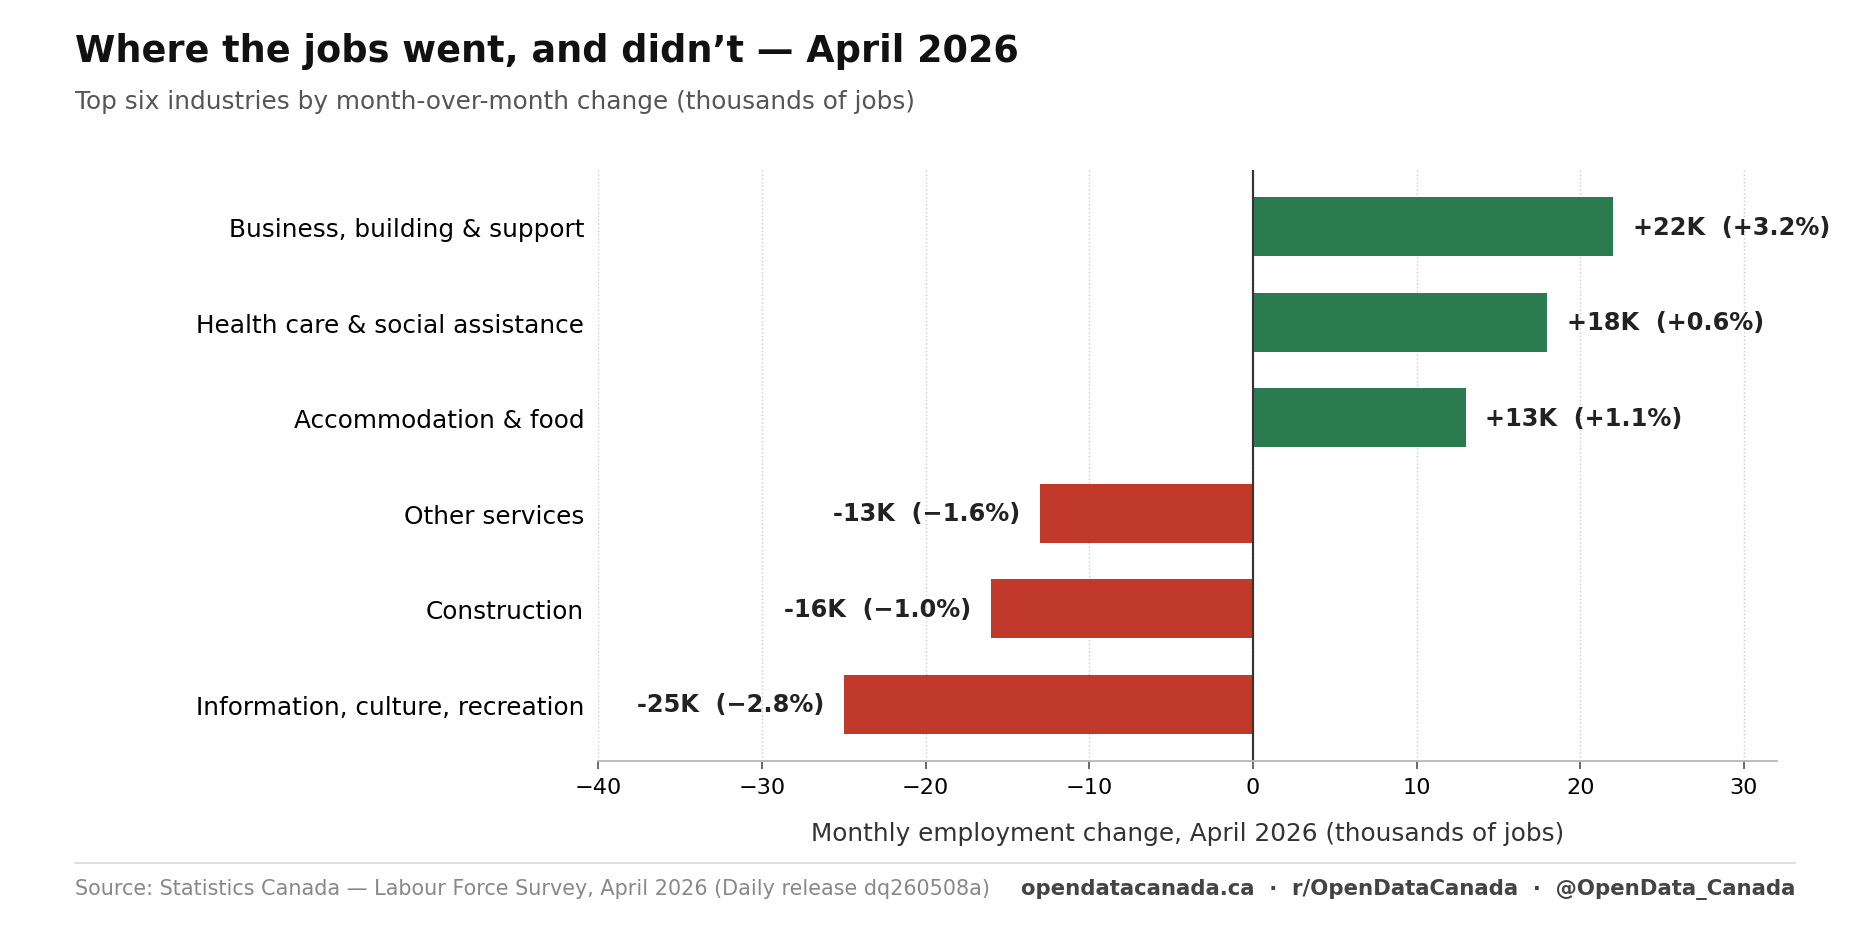
Where the jobs went, and didn't
The industry split for April matches the macro story almost perfectly.
The losses concentrated in three sectors:
- Information, culture and recreation: −25,000 (−2.8 percent). The largest single-sector decline in April, and the one most exposed to discretionary consumer spending and U.S.-facing media advertising.
- Construction: −16,000 (−1.0 percent). Permits and starts have been weakening for months; the labour-side response showed up in April.
- Other services: −13,000 (−1.6 percent).
The gains concentrated where they have for two years:
- Business, building and support services: +22,000 (+3.2 percent).
- Health care and social assistance: +18,000 (+0.6 percent), and +119,000 (+4.1 percent) over the year. This single sector is responsible for most of the year-over-year employment growth. Strip it out and the rest of the economy is roughly flat.
- Accommodation and food services: +13,000 (+1.1 percent).
Healthcare is doing what healthcare does in every advanced economy with an aging population: hiring through the cycle. The question is what happens to the jobs print when healthcare's pace inevitably moderates against fiscal-tightening pressure at the provincial level. The rest of the economy is not currently positioned to pick up the slack.
Wages are still hot, which is the puzzle
Average hourly wages grew 4.5 percent year-over-year in April, to $37.77. That is roughly the same pace as March (+4.7 percent) and well above the 3.4 percent average of 2025. Wage growth at the bottom of the distribution was +3.5 percent; at the top, +4.8 percent. Even the composition-adjusted measure — which strips out the effect of more workers being employed in higher-paying occupations — sits at +3.4 percent.
This is the puzzle. Unemployment is at a six-month high. Full-time work has declined four months in a row. Long-term unemployment (those out of work 27 weeks or more) sits at 22.5 percent of the unemployed, well above the 17.1 percent pre-pandemic average. There is more slack in the system than there has been in months. And nominal wages are still growing in the four-and-a-half-percent range.
Two readings of this are possible. One is that Canadian wage growth is stuck on cost-of-living auto-pilot — collective agreement schedules, minimum-wage indexation, and union settlements running hot through grievance — and is decoupled from labour-market slack in the short run. The other is that the slack itself is concentrated in occupations and demographics (younger workers, lower-skill service sectors, recent immigrants in the side-door pipeline that closed last year) whose wages don't show up cleanly in the average hourly print.
Both readings are probably true at the same time. The aggregate wage number is still rising, but the people most affected by the four-month full-time job decline are not the ones whose wages are pulling the average up.
What this is, and isn't
This is not yet a recession in the labour market. Year-over-year, employment is positive. The layoff rate, at 0.6 percent monthly, is in line with pre-pandemic norms — the slack is showing up through reduced hiring and slower flows out of unemployment, not through a wave of cuts.
But it is the most sustained period of full-time job loss since the pandemic, and it has now lasted long enough that calling it noise is hard to defend. Four consecutive monthly declines in full-time employment, an unemployment rate at a six-month high, and a regional concentration in Quebec consistent with the stated channel of policy concern (U.S. tariffs) is a coherent picture, not a coincidence.
The next print is in five weeks. If full-time goes negative again in May, it will be five in a row. At that point the framing should probably change — from "soft labour market" to something more direct.
Read next