Article · Population · 9 min read
When Canada closed the side door to permanent residency, 100,000 'students' vanished
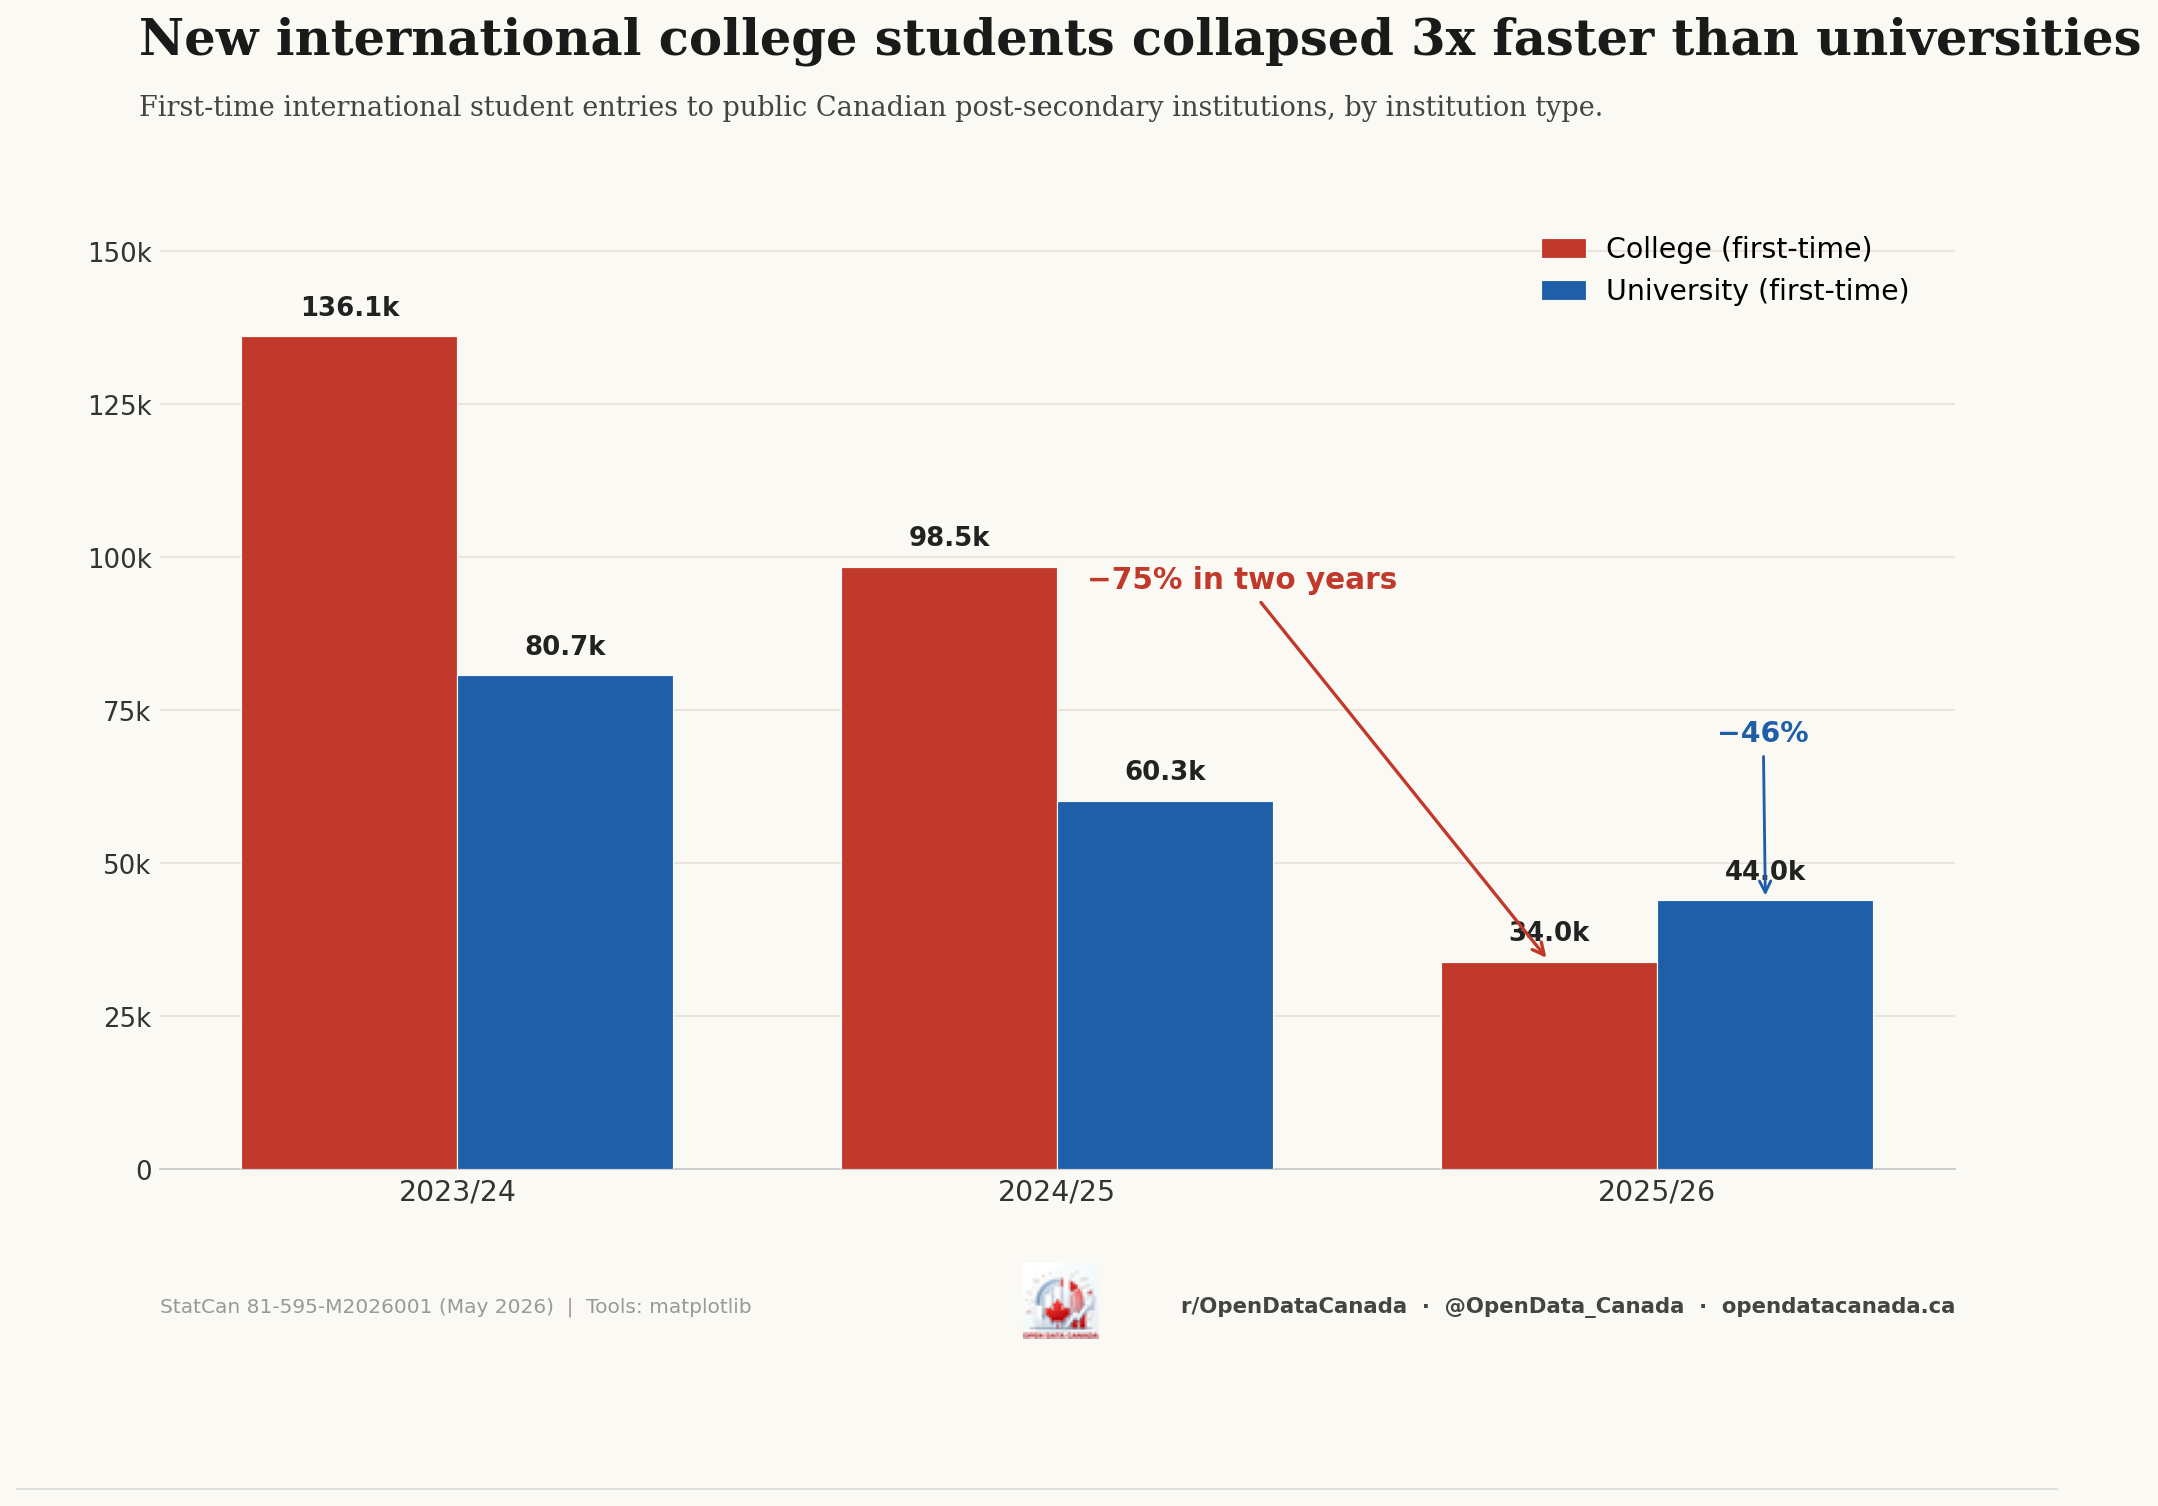
New first-time international college entries fell 75 percent in two years. Universities fell 46 percent. The gap is the story.
Statistics Canada released a feasibility study this week — catalogue number 81-595-M2026001 — estimating the international student population from administrative data. It's the first near-real-time read on what the IRCC cap announced in January 2024 actually did. The aggregate numbers are striking: total international enrolment in public post-secondary institutions fell from 428,077 in 2023/24 to 303,746 in 2025/26, a decline of 124,331 students, or 29 percent, in two years.
But the aggregate hides the actual story. Canadian colleges and universities did not respond to the same policy environment the same way.
The asymmetry
| Series | 2023/24 | 2024/25 | 2025/26 | Change |
|---|---|---|---|---|
| Total population — colleges | 206,013 | 200,374 | 120,130 | −42 % |
| Total population — universities | 222,064 | 210,092 | 183,616 | −17 % |
| New first-time entries — colleges | 136,148 | 98,482 | 33,960 | −75 % |
| New first-time entries — universities | 80,719 | 60,271 | 43,979 | −46 % |
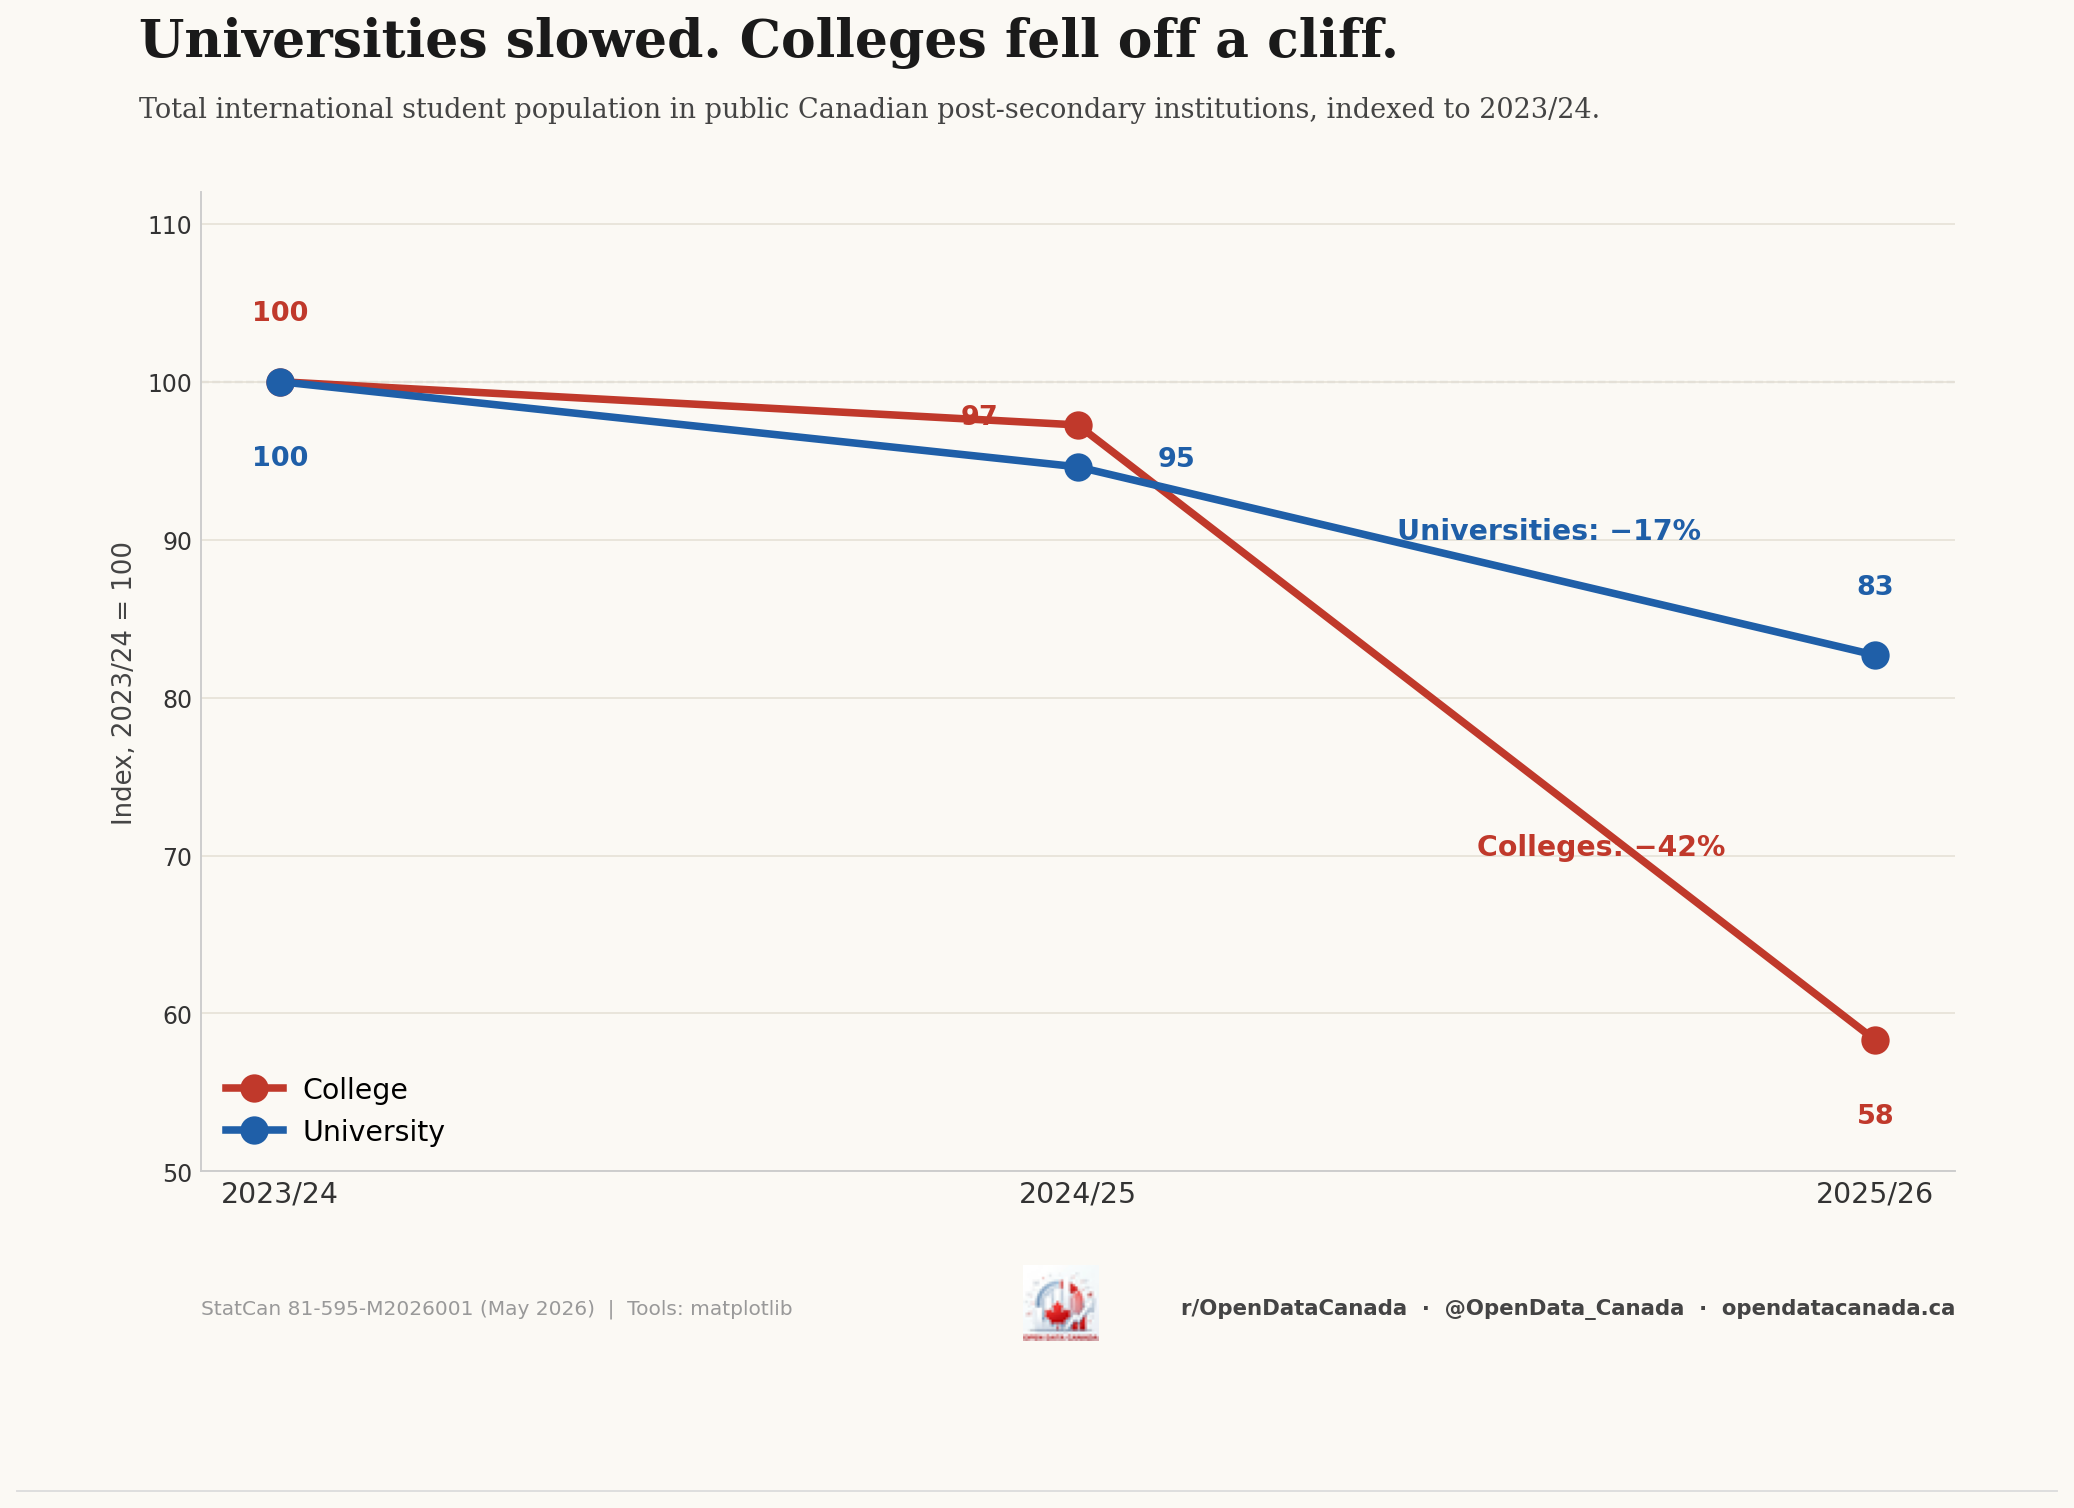
The total college population fell more than twice as fast as the university population. New entries — the demand signal that is most responsive to policy in any given admissions cycle — fell more than three times as fast in colleges as in universities.
If colleges and universities were both selling education to international students, the responses would scale together. Tighter financial requirements, a permit cap, and stricter language and admissions rules would compress both intakes by similar percentages. Instead, the college number cratered while the university number declined gracefully.
The asymmetry is the data signature of a pricing change that hit one product hard and another product softly. The product wasn't education. It was post-graduation status.
What was actually being sold
The Post-Graduation Work Permit (PGWP) is an open work permit issued to international graduates of recognized Canadian institutions. It does not require a job offer. It does not restrict employer, occupation, or location. For a graduate of a two-year college diploma, the PGWP duration was three years — long enough to accumulate the Canadian work experience needed to qualify for permanent residency through the Canadian Experience Class or various provincial nominee streams.
Through the late 2010s and into the 2020s, this pathway became Canada's largest unannounced immigration channel. Its volume rose without ever being formally legislated as an immigration target, because the front door was a study permit, not an immigration application. A college diploma and the work permit that came with it functioned as a renewable, transferable claim on a residency pathway.
The federal government's 2024 changes did three things in sequence:
- January 2024: Cost-of-living financial requirement for study permit applicants was raised. A two-year cap on new study permit issuance was announced on January 22.
- May 15, 2024: International students graduating from Ontario public-private partnership (PPP) college programs operating under curriculum licensing arrangements lost PGWP eligibility. (The change had been announced in January 2024 with a September effective date; it was accelerated.)
- Late 2024 onward: PGWP eligibility was tied more tightly to programs of study aligned with declared in-demand occupations, narrowing eligibility further.
The first two of those changes hit colleges — and specifically PPP-licensed colleges — far harder than universities. Universities don't operate curriculum-licensing partnerships with private storefronts. Universities don't structure their two-year programs around the PGWP eligibility rules. Universities had a smaller share of marginal applicants whose enrolment decision hinged on the work-permit-and-residency pathway.
When the rules tightened, the universities lost some students and adjusted. The colleges lost the product and the customers walked away.
Provincial geography
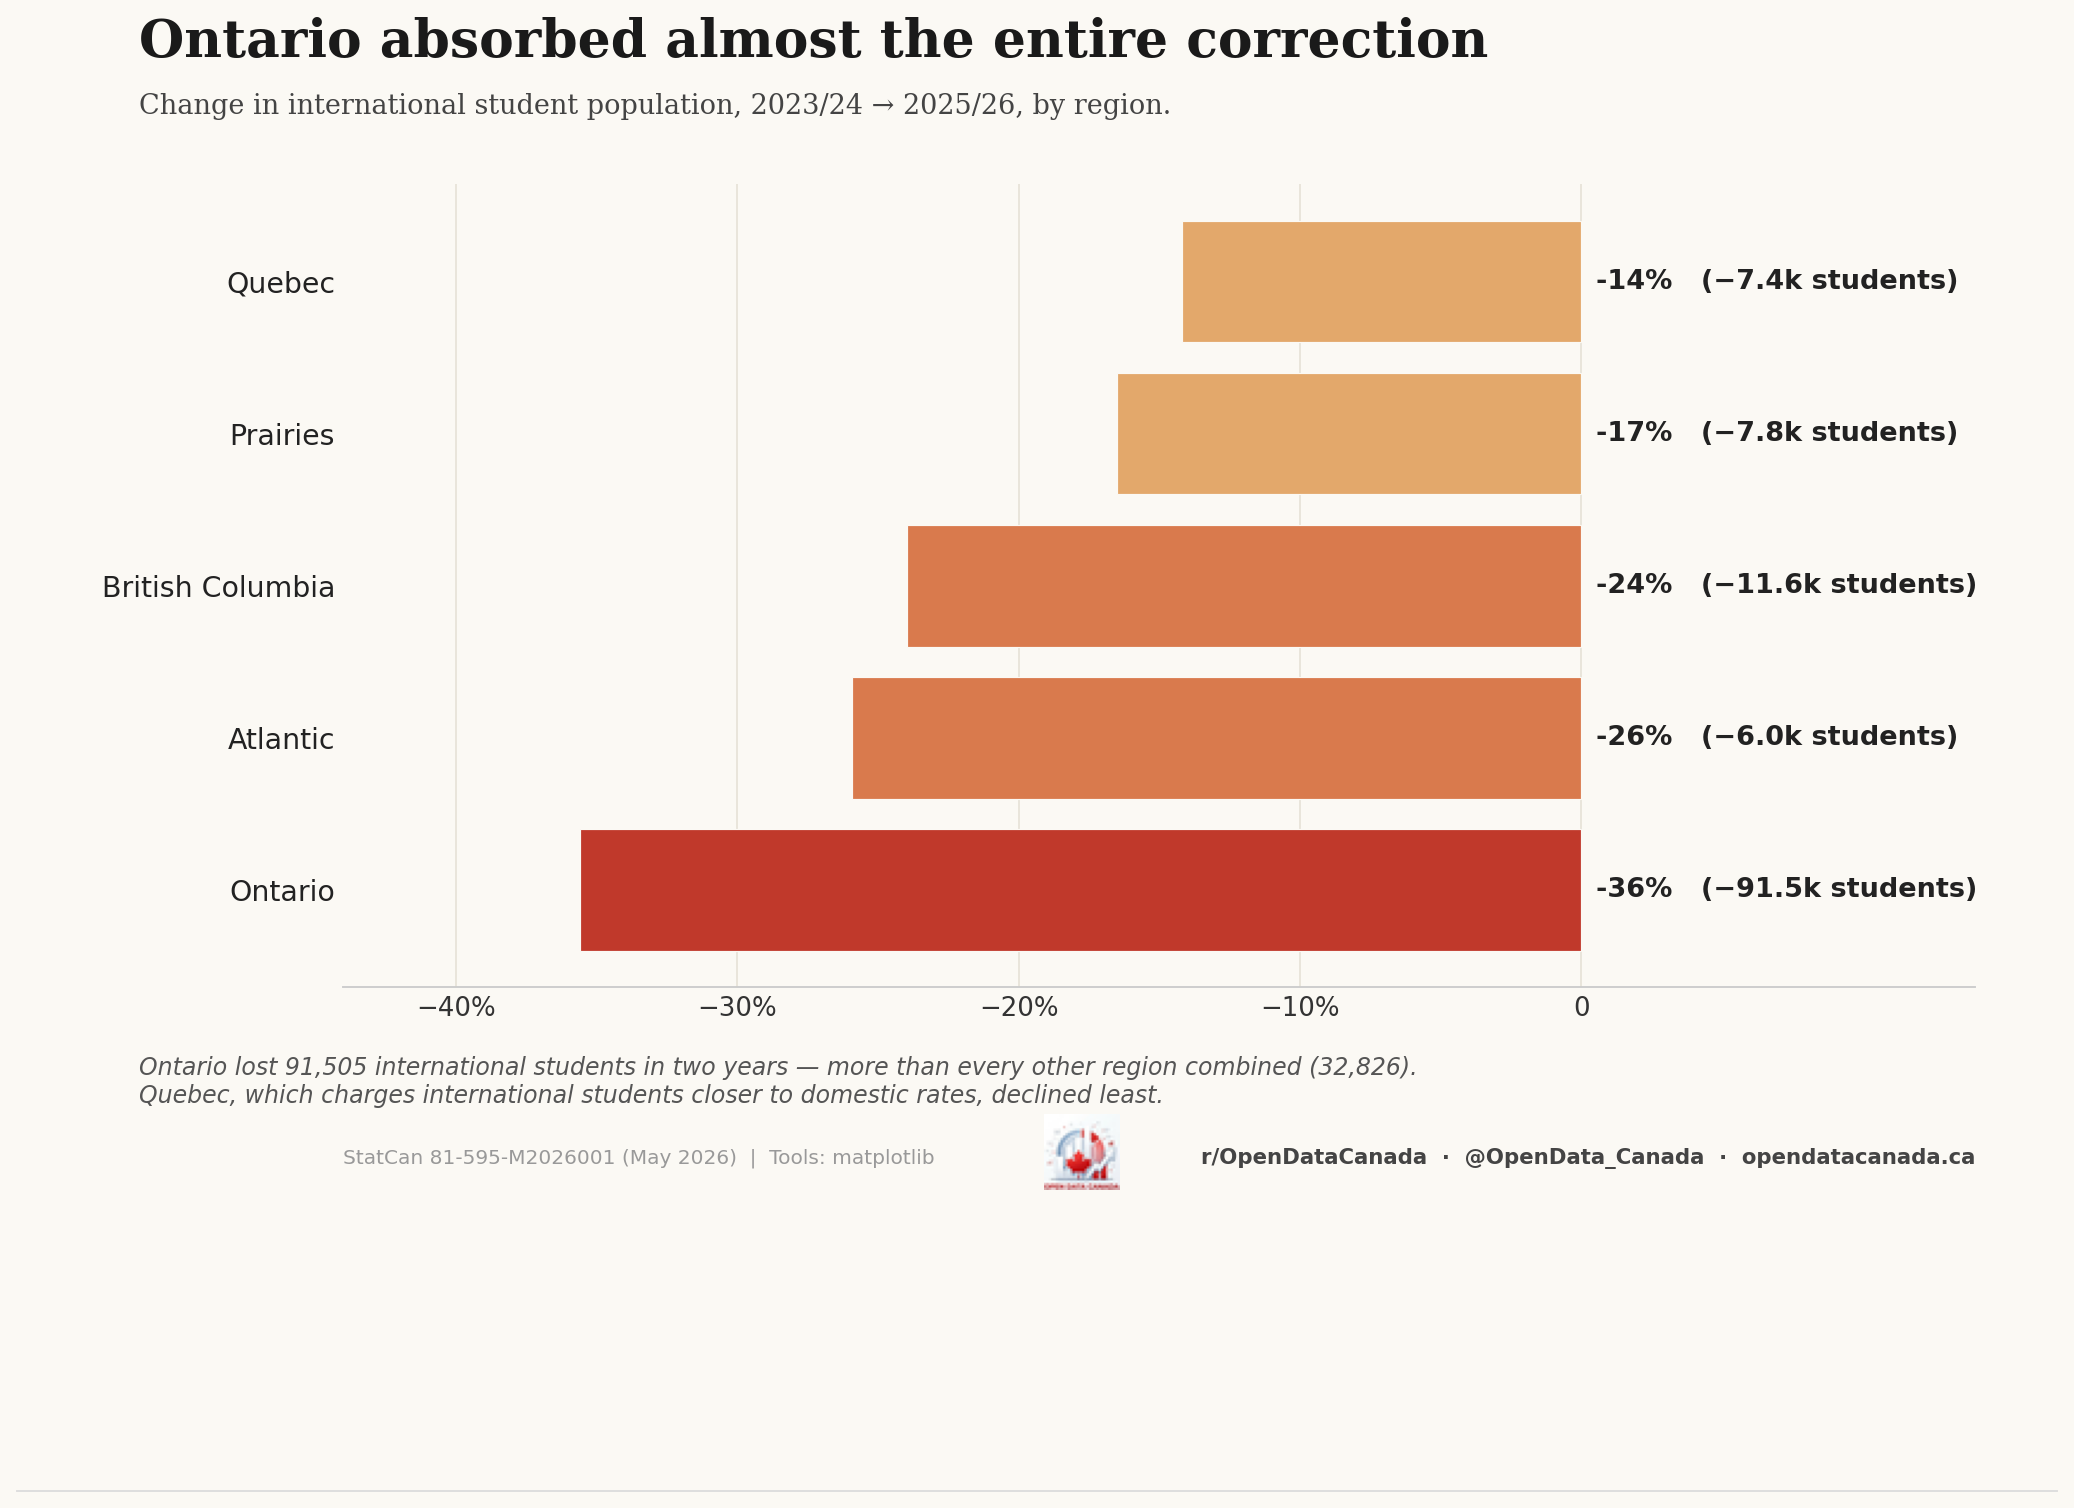
Ontario absorbed almost the entire correction. Of the 124,331 students who left the system between 2023/24 and 2025/26, Ontario lost 91,505 — more than every other region in Canada combined (32,826).
Quebec is the most informative comparison. It declined the least, at minus 14 percent. Quebec runs international student admissions through its own provincial selection mechanism (the CAQ), charges international students closer to domestic tuition rates at francophone institutions, and does not have a public-private-partnership college sector. Without the side-door product, no boom. Without the boom, no bust.
The geographic pattern is consistent with the structural reading. The province with the largest pre-2024 PPP college sector lost the most students. The province with no PPP college sector and a different tuition structure lost the fewest. The other provinces fall in between in the order their college-sector exposure to the international pipeline would predict.
What the data does not say
The feasibility study covers full-time international students at public post-secondary institutions. It does not capture the private career colleges, ESL schools, and unregulated training providers that absorbed an unknown share of marginal applicants prior to the 2024 changes. The 124,331-student decline in the public system is a floor on the total contraction, not a ceiling.
The data also does not capture downstream labour-market and housing effects directly, although both have begun showing up in adjacent series — rental vacancy rates rose nationally in 2025, and college-town markets in Ontario have led the move. We are not making a quantitative claim about either channel here. Both warrant separate analysis when the next round of CMHC and labour-force data lands.
What this all adds up to
The conventional framing of the 2024 cap was that Canada had let international student volumes outrun the system's housing and program-integrity capacity, and that the cap would moderate growth back toward sustainability. That framing implicitly assumes that the demand it was moderating was demand for education.
The Statistics Canada feasibility study is the first dataset that lets us interrogate that assumption with fresh numbers. The asymmetry it documents — a 75 percent collapse in new college entries against a 46 percent collapse at universities, concentrated almost entirely in Ontario — is hard to reconcile with the educational-demand framing. It is straightforward to reconcile with the framing that a meaningful share of the demand was for the post-graduation work permit and the residency pathway it enabled.
That doesn't make the policy wrong. It does change what the policy was. Closing the cap was less about cooling an education boom and more about closing a parallel low-skill immigration channel that had been operating through college admissions offices for the better part of a decade. The 124,331 students who left between 2023/24 and 2025/26 are the dataset's answer to a question Ottawa has spent two years declining to ask aloud: how much of the international student program had quietly become an immigration program?
The numbers say: the part that disappeared in eighteen months.
Read next