Article · Public health · 7 min read
Ontario's opioid crisis is concentrated in the North — Thunder Bay's death rate is nearly 4× the provincial average
Ontario as a whole had 2,242 opioid toxicity deaths in 2024 — a rate of 13.9 per 100,000, well below Canada's 17.7 national rate. But the provincial average hides a sharp split: the five northern Public Health Units sit between 35 and 54 deaths per 100,000, three to four times the provincial number, while Toronto and Peel sit near or below the average.
Ontario had 2,242 opioid toxicity deaths in 2024 — a rate of 13.9 per 100,000. The chart below maps every Public Health Unit's 2024 rate.
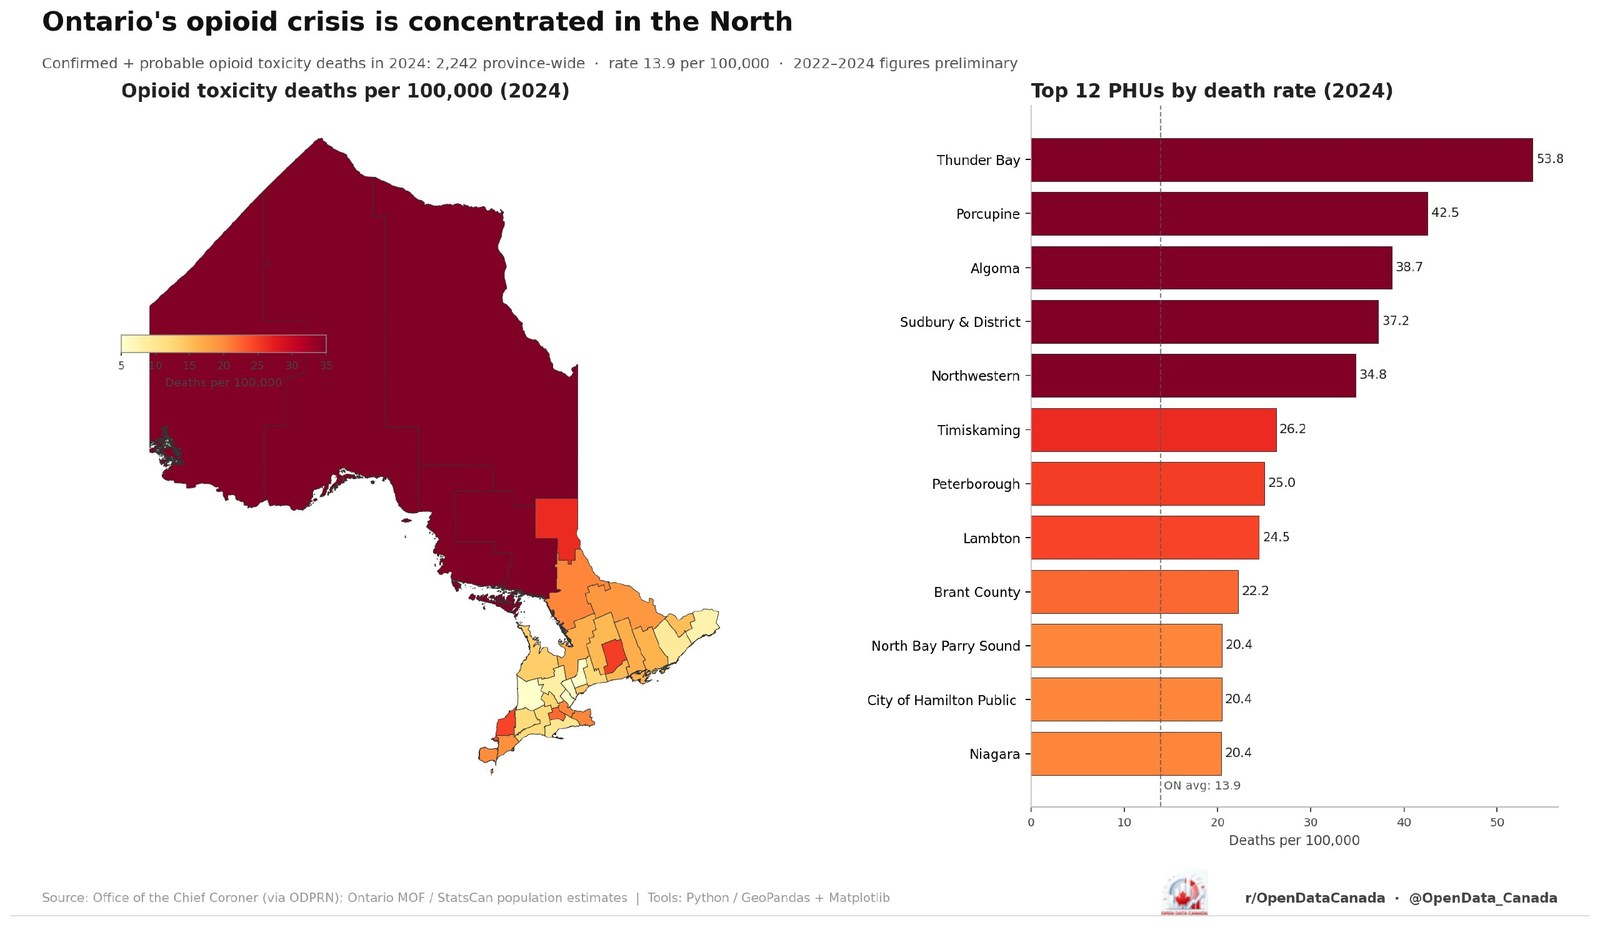
Every PHU in Northern Ontario sits in the highest band of the scale; Southern Ontario sits in the lightest. Three reference points:
- Thunder Bay — 88 deaths, 163,554 residents — 53.8 per 100,000.
- Toronto — 463 deaths, 3.27 million residents — 14.1 per 100,000.
- Peel — 94 deaths, 1.66 million residents — 5.7 per 100,000.
A Thunder Bay resident was about 9.5× as likely to die of an opioid toxicity death in 2024 as a Peel resident, in the same province with the same drug supply, the same coroner, and the same OHIP coverage.
Top 12 Public Health Units, 2024
| Rank | Public Health Unit | Deaths | Population | Rate / 100k |
|---|---|---|---|---|
| 1 | Thunder Bay | 88 | 163,554 | 53.8 |
| 2 | Porcupine | 38 | 89,326 | 42.5 |
| 3 | Algoma | 49 | 126,589 | 38.7 |
| 4 | Sudbury & District | 84 | 225,525 | 37.2 |
| 5 | Northwestern | 29 | 83,317 | 34.8 |
| 6 | Timiskaming | 9 | 34,298 | 26.2 |
| 7 | Peterborough | 42 | 167,979 | 25.0 |
| 8 | Lambton | 35 | 143,116 | 24.5 |
| 9 | Brant County | 39 | 175,696 | 22.2 |
| 10 | North Bay Parry Sound | 30 | 146,766 | 20.4 |
| 11 | City of Hamilton | 129 | 632,111 | 20.4 |
| 12 | Niagara | 110 | 539,180 | 20.4 |
The top five PHUs are all northern; six of the top ten. Sudbury & District has 225,525 residents and still sits at 37.2, so this isn't a small-denominator artefact.
The provincial number is the population-weighted average of a 5.7 (Peel) and a 53.8 (Thunder Bay). If Ontario as a whole had the death rate of the GTA suburbs, the 2024 toll would be roughly 1,150 instead of 2,242. If it had the rates of the five northern PHUs, it would be 6,400.
What's behind the gap
The factors public health researchers cite overlap geographically. Opioid agonist therapy (methadone, buprenorphine) cuts overdose mortality by roughly half but is harder to start and stay on in northern PHUs because there are fewer prescribers and longer travel times to clinics. The unregulated drug supply is dominated by fentanyl across the province, but adulterants like benzodiazepines and xylazine appear in different ratios in different regions. Supervised consumption sites, naloxone distribution networks, and overdose response teams are concentrated in southern urban areas. Several northern PHUs cover regions with high First Nations populations, and Indigenous people in Ontario die from opioid toxicity at roughly 5× the provincial rate. None of these alone explains the gap; they compound in the same geography.
The 2,242 figure is the Office of the Chief Coroner's "confirmed and probable" count, republished by ODPRN with data effective August 2025. The OCC flags 2024 as preliminary — probable cases convert to confirmed in later releases and the count revises upward — so the number here is a floor. PHU is the finest geography at which the OCC publishes comparable rates; the underlying ODPRN file goes one level deeper, to Census Subdivision, for anyone who wants to look inside a specific PHU.
Data sources: Office of the Chief Coroner of Ontario, opioid toxicity deaths (confirmed + probable) by Census Subdivision 2018–2025 Q1, republished by the Ontario Drug Policy Research Network (odprn.ca), data effective 12 August 2025. Population denominators: Ontario Ministry of Finance population projections for the 34 Public Health Units, 2024 (data.ontario.ca). PHU boundaries: Ontario GeoHub. Tools: Python · GeoPandas · Matplotlib. All figures verified against source files on 5 May 2026.