Energy · 8 min read
Canada's nuclear strategy is built on a number the regulator's own model doesn't deliver
Canada's new National Nuclear Energy Strategy promises to supercharge atomic power. The CER's own net-zero model hands nuclear 5 percent of new capacity through 2050, while assigning wind 62 percent. Ontario alone faces a potential 14.6 GW nuclear delivery gap by midcentury.
On June 22, 2026, the federal government released Canada's National Nuclear Energy Strategy. The document calls for up to 10 new large-scale reactors plus a fleet of small modular reactors, framing the push as essential to decarbonizing a grid that must roughly double in size to electrify transportation, heating, and industry.
The "doubling" framing appears throughout. It is also the most conservative of the Canada Energy Regulator's four published scenarios. The gap between the government's language and the CER's own net-zero math is what this article examines.
Canada's net-zero grid needs 402 GW, not 308
Canada's installed electricity capacity today is approximately 164 GW. The government's preferred framing, "doubling the grid," maps to roughly 308 GW by 2050, the CER's Current Measures scenario.
That scenario assumes policies already on the books, nothing more. The CER's Canada Net-zero scenario, which models a trajectory consistent with the country's 2050 climate commitment, reaches 402 GW — 2.5 times today's capacity, compared with 1.9 times under the government's preferred Current Measures scenario.
Both scenarios are marketed as paths to net-zero. The more demanding the target, the more work falls to technologies that can be deployed quickly.
The CER's build-rate arithmetic is blunt. Getting from 164 GW to 308 GW in 25 years means adding 5.8 GW per year, more than Canada has ever sustained outside the 1970s hydro and CANDU boom (peak: 3.7 GW/yr). Getting to 402 GW requires 9.5 GW per year, more than five times the 1.7 GW/yr Canada has averaged over the past two decades.
Wind, not nuclear, drives CER net-zero capacity additions
The nuclear strategy is framed as the path to a net-zero grid. So what technology does the CER's net-zero scenario actually rely on to get there?
Between 2025 and 2050, Canada Net-zero adds roughly 238 GW of new capacity. Nuclear accounts for 11.9 GW of that — growing from 12.9 GW today to 24.8 GW (Ontario at 19.2 GW, Alberta at 3.5 GW, the rest elsewhere). That is about 5 percent of total new capacity added.
Wind accounts for approximately 148 GW, or 62 percent of the total.
None of this is an argument against nuclear expansion. The National Nuclear Energy Strategy is right about the firmness case: nuclear provides baseload capacity that runs around the clock regardless of weather, something wind and solar cannot offer. A gigawatt of firm nuclear is worth more to grid reliability than a gigawatt of intermittent wind.
Generation share reflects that. Canada's existing nuclear fleet produces roughly 13 percent of the country's electricity from about 8 percent of installed capacity, because it runs at high capacity factors year-round.
But the CER's net-zero scenario is clear about where the volume of new capacity must come from. A strategy that frames nuclear as the centrepiece of grid decarbonization does not square with a model that gives it one-twentieth of the additions.
The CER's net-zero scenario also projects natural gas capacity growing from 31 GW to 42 GW by 2050 — not shrinking. The increase comes through gas plants equipped with carbon capture and storage (CCUS), which the CER counts as compatible with the net-zero target. Whether CCUS-equipped gas materializes at that scale is contested, but it is another place where the CER model diverges from the common assumption that decarbonization means gas disappears.
Ontario nuclear delivery gap: 14.6 GW short of IESO targets
The real test of the nuclear strategy is Ontario, where all the concrete announcements have been made and the IESO has published its own numbers.
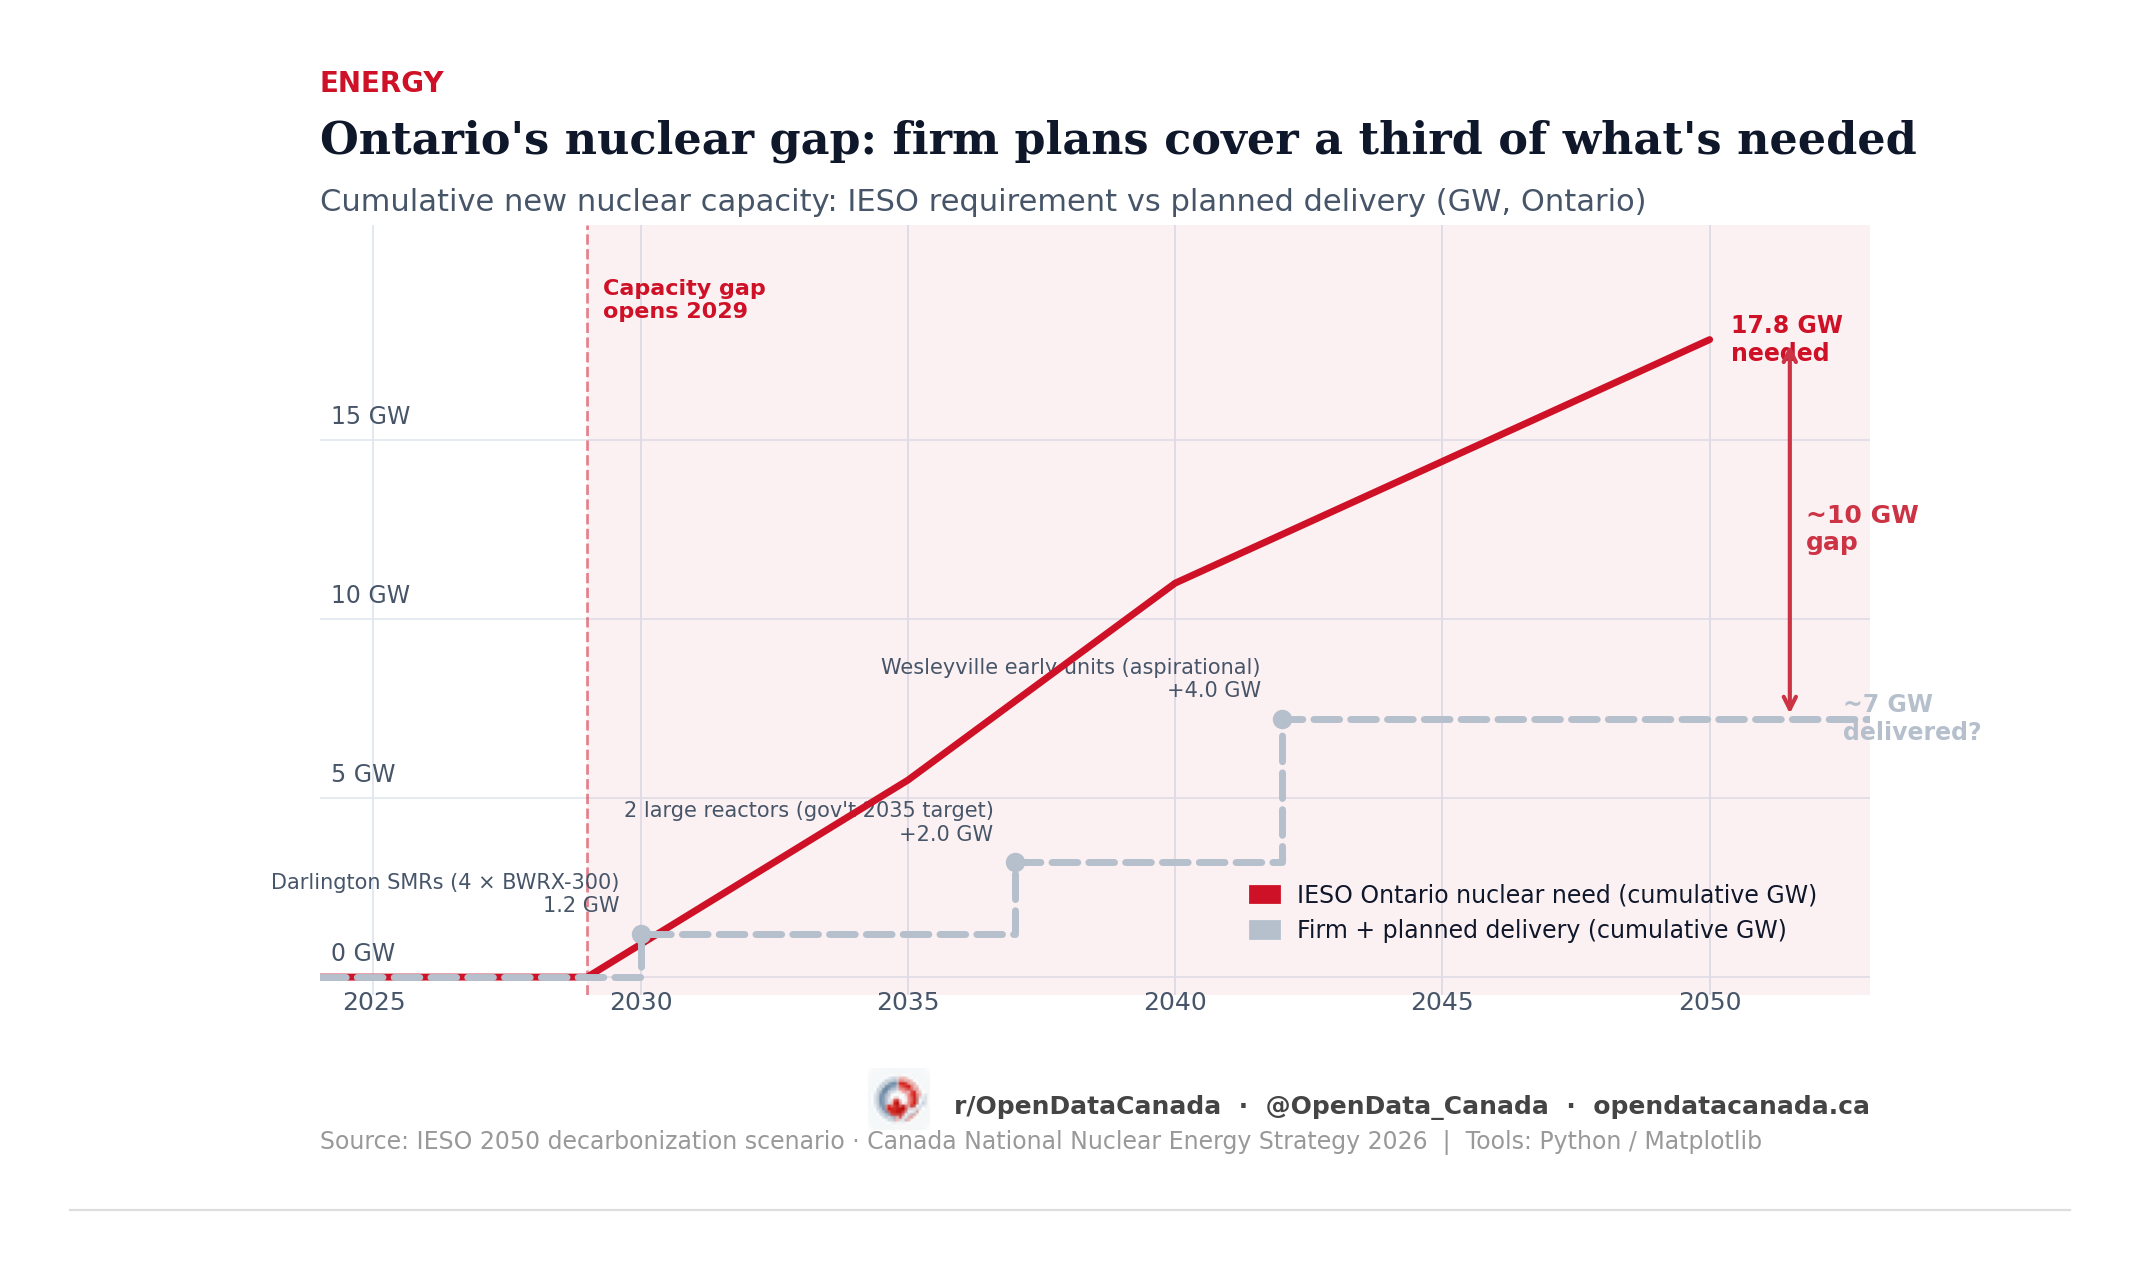
The Independent Electricity System Operator's 2050 decarbonization scenario calls for ~17.8 GW of new nuclear capacity in Ontario to meet electrification demand. The firm plans on the table are:
- Darlington New Nuclear: four BWRX-300 small modular reactors (300 MW each = 1.2 GW total). First unit targeted around 2030, classified as SMR capacity.
- Two large reactors at existing sites, targeted by 2035: approximately 2 GW.
That brings confirmed plans to roughly 3.2 GW against a 17.8 GW IESO target, a potential shortfall of ~14.6 GW in Ontario alone by 2050.
The Wesleyville site on Lake Ontario's north shore has been proposed for up to 10 GW of large reactors, with construction potentially starting in 2033 and the first unit online around 2040. That timeline is aspirational, contingent on site approval, regulatory licensing, supply chain, and labour, in a global environment where every country with a net-zero target is competing for the same reactor builders.
The nuclear strategy signals intent to close that gap. Whether announcements become operating reactors depends on execution at a pace Canada has not demonstrated in 40 years.
Three numbers: 402 GW needed under CER net-zero, nuclear at 5 percent of the additions required to get there, and a 14.6 GW delivery gap in Ontario before Wesleyville breaks ground. None of these are arguments that the nuclear strategy is wrong. Firm, dispatchable baseload power has real value that capacity-share statistics cannot capture.
They are, however, the numbers worth reading before the strategy document.