Environment · Great Lakes
Lake Ontario Is Running Above Normal. Lake Superior Is Below It
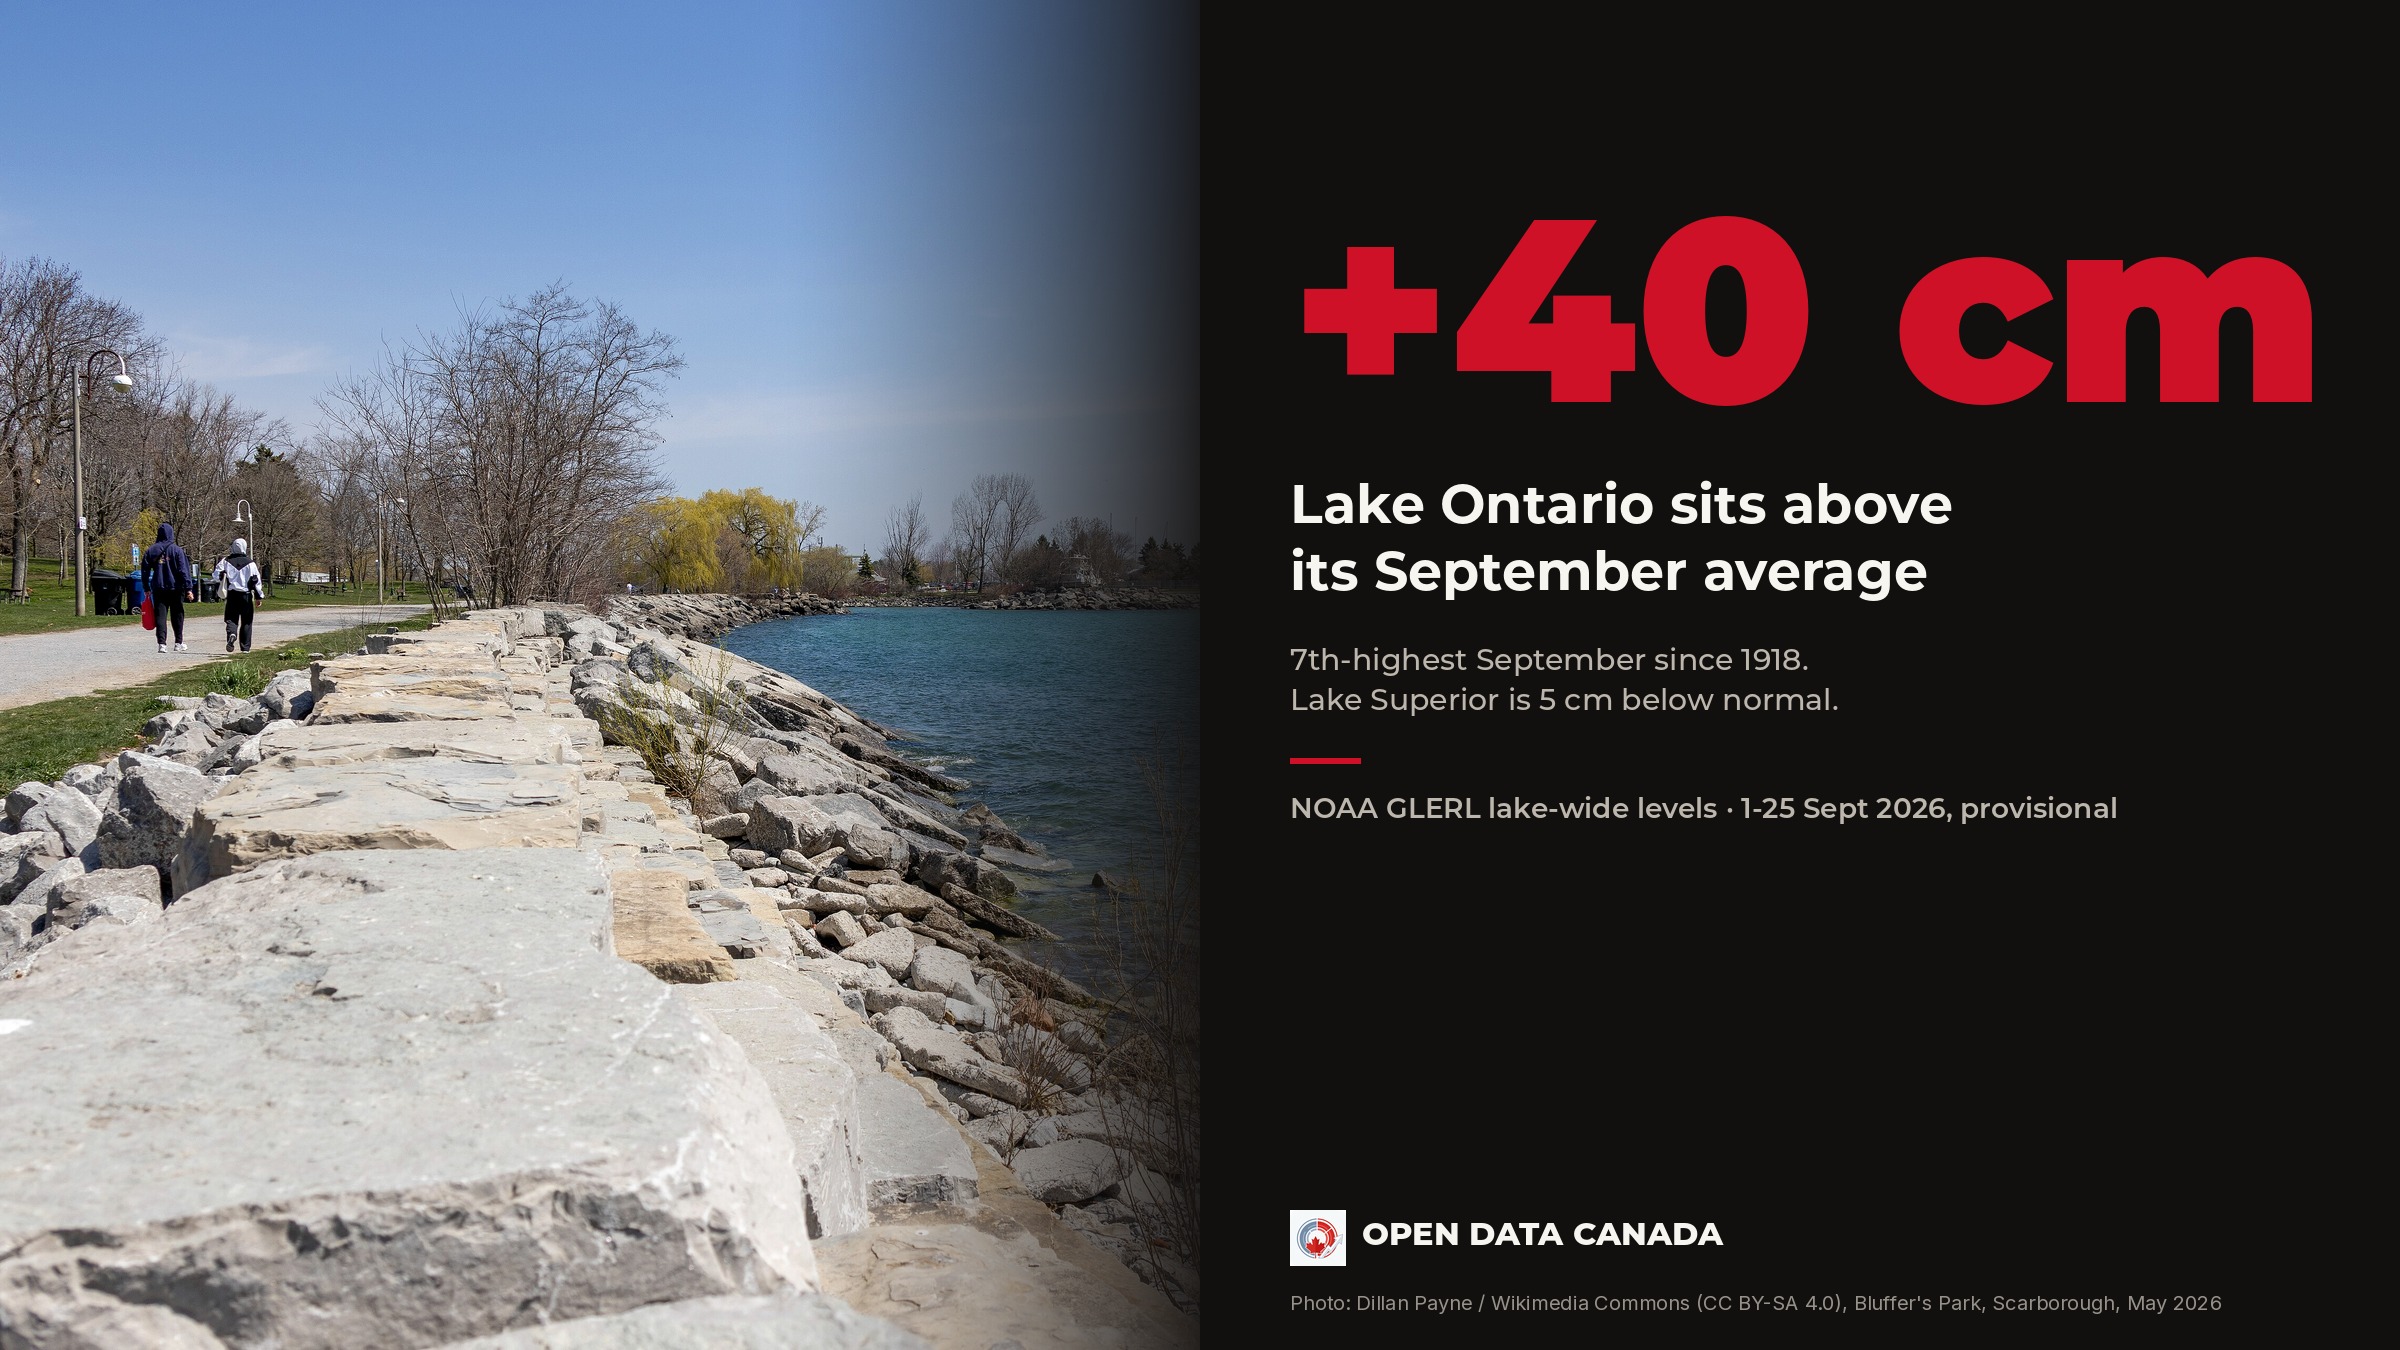
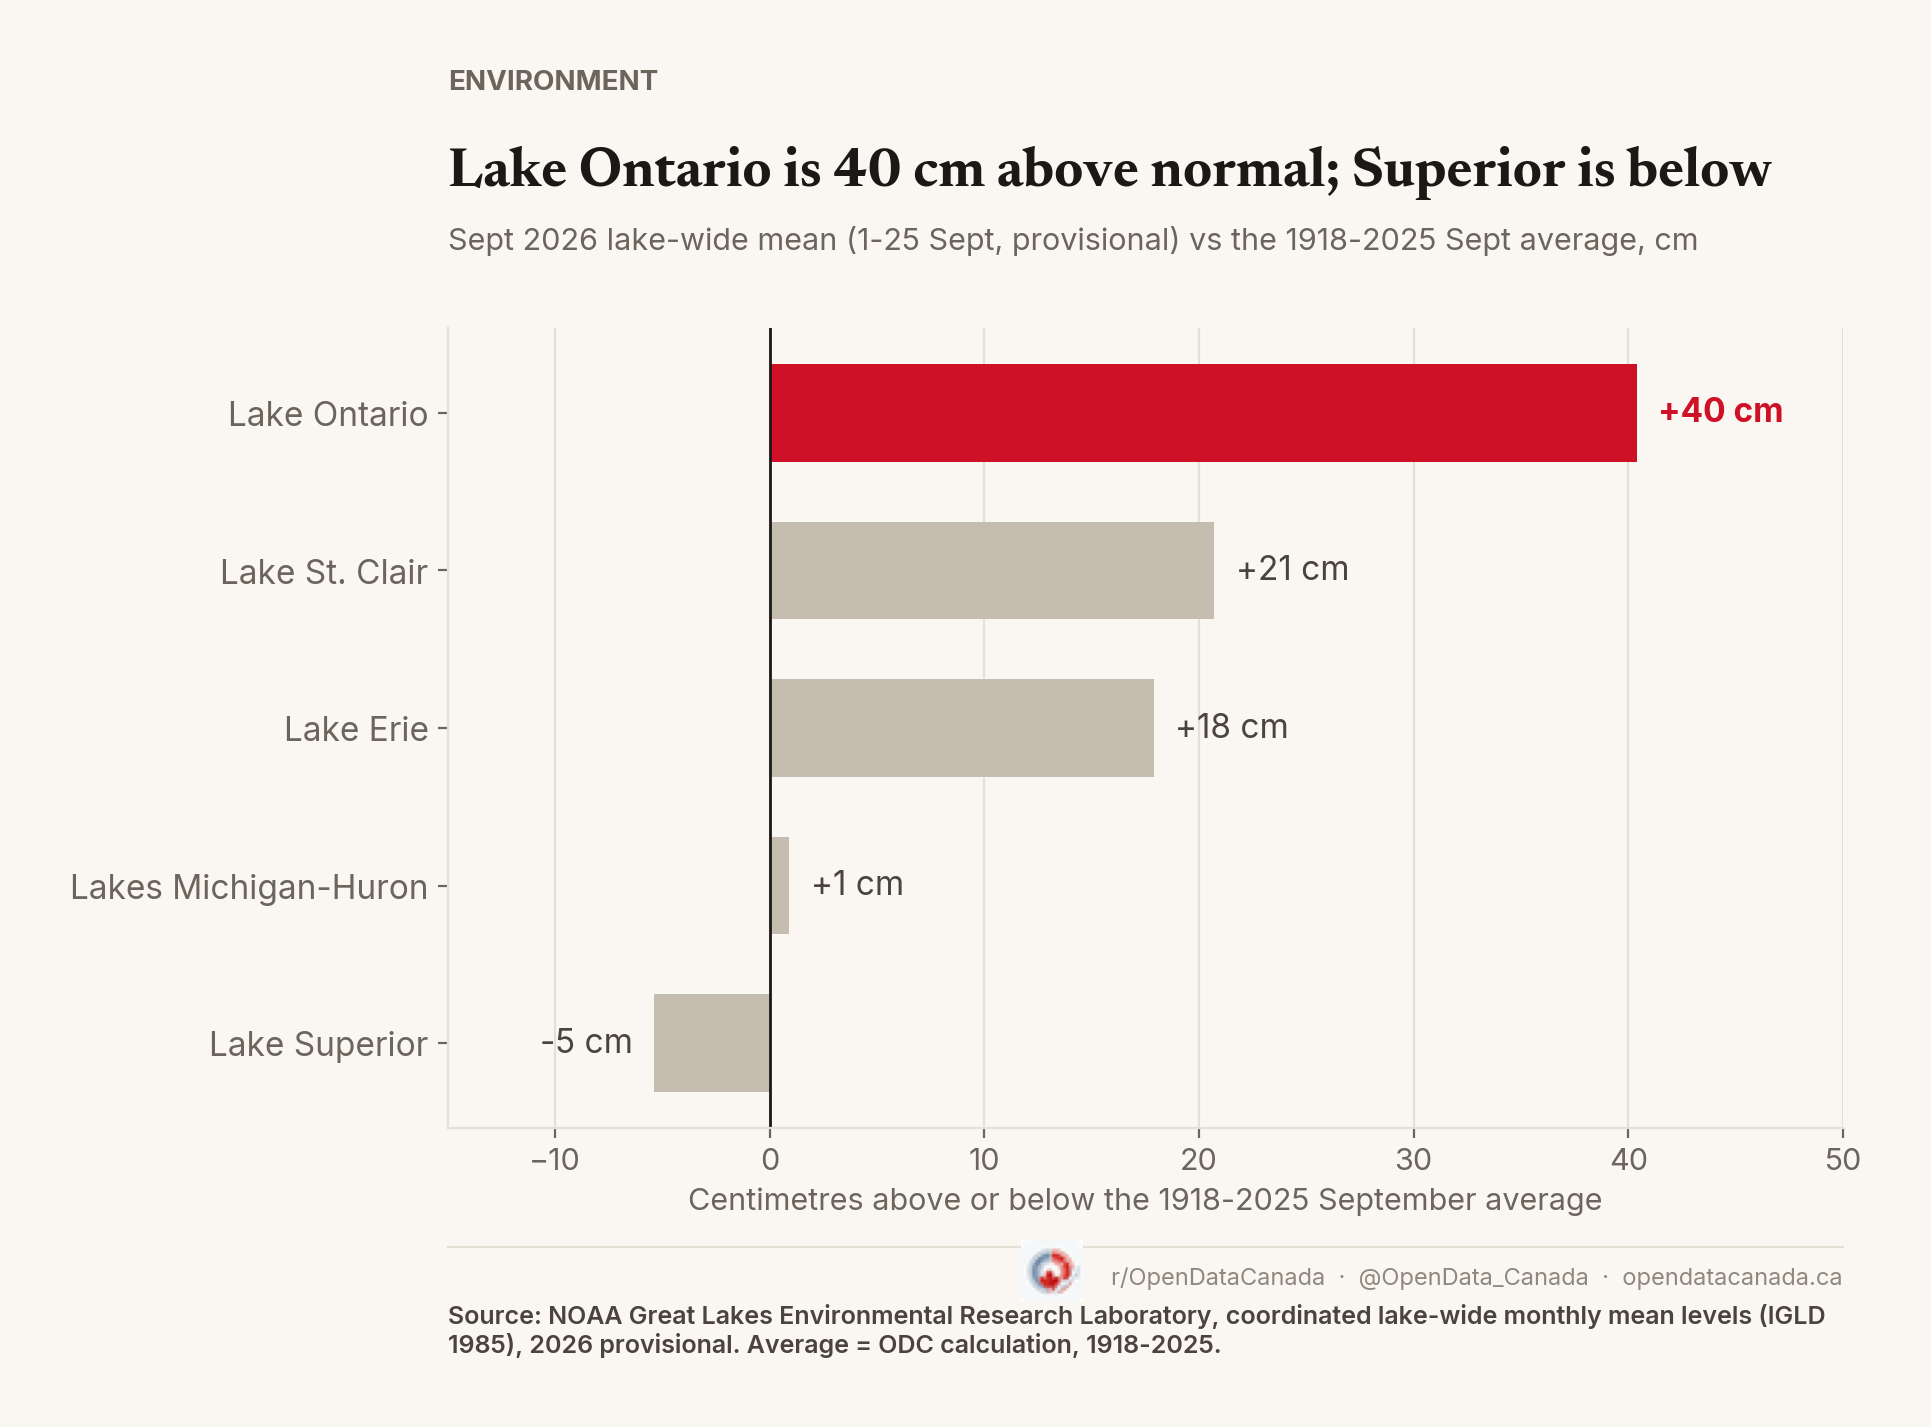
Every Great Lake started 2026 below its long-term average. By September, on provisional figures, Lake Ontario was 40 centimetres above it, its 7th-highest September since 1918, while Lake Superior sat 5 centimetres under.
In January, all five Great Lakes were below their long-term averages. Lakes Michigan and Huron, which are measured as a single body because they share one water surface, were 31 centimetres short. Lake Ontario was 11 centimetres short.
Nine months later the picture has split. Lake Ontario's lake-wide average level for September 2026, on provisional data covering 1 to 25 September, was 75.15 metres above sea level, 40 centimetres higher than its September average from 1918 to 2025. Only six Septembers on record were higher: 1929, 1943, 1947, 1951, 1952 and 2019. At the other end of the system, Lake Superior was 5 centimetres below its September average.
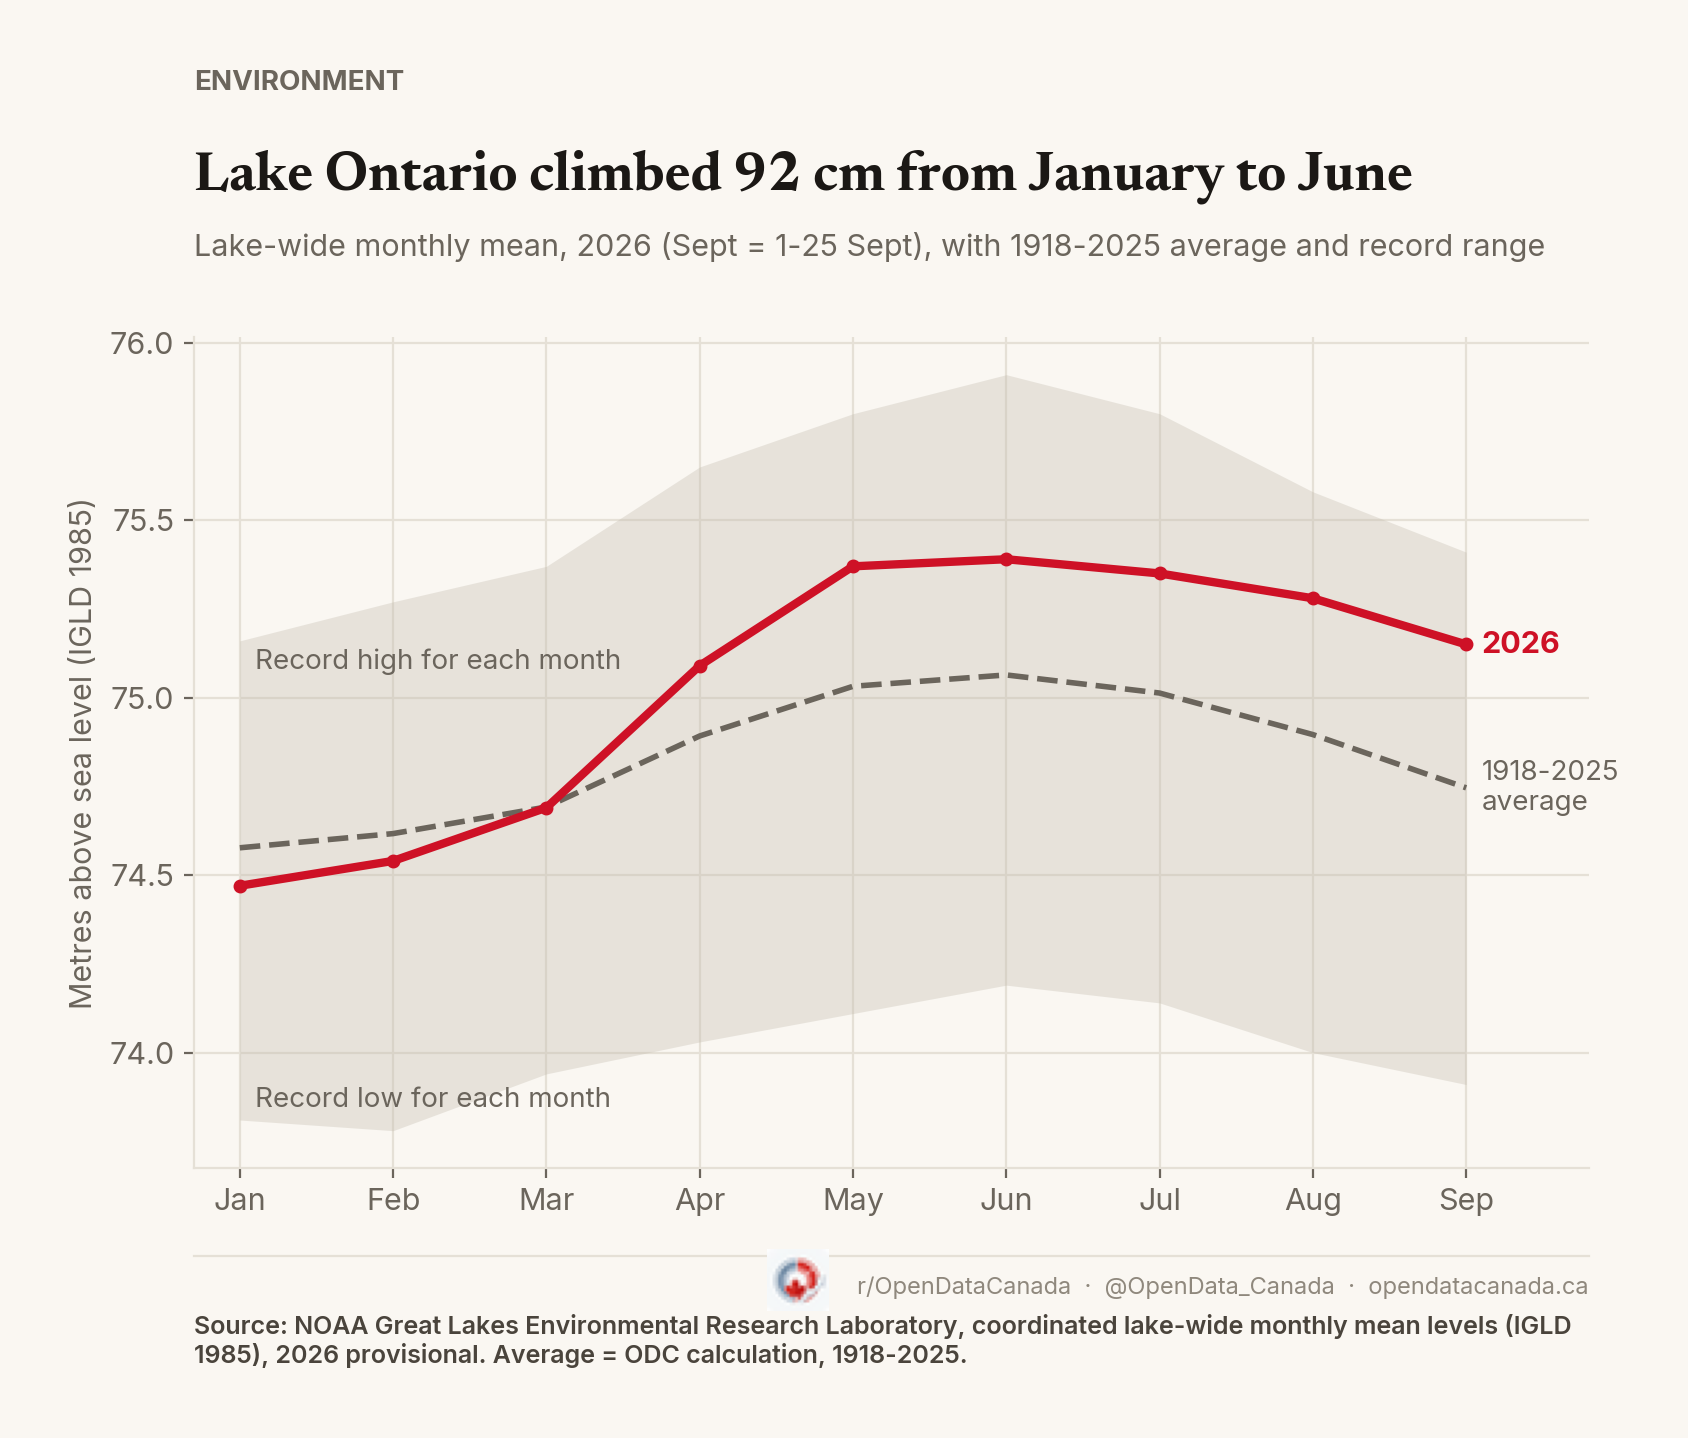
A late-spring surge on Lake Ontario
The lakes rise every spring as snowmelt and rain arrive, then fall through late summer and autumn. What happened on Lake Ontario this year was the size of that rise. From January to its June peak of 75.39 metres, the lake climbed 92 centimetres. In an average year, the January-to-June rise is 49 centimetres.
Most of the gap opened in April and May. Lake Ontario was right on its March average, then 20 centimetres above average in April and 34 centimetres above in May. It has stayed more than 30 centimetres above average every month since.
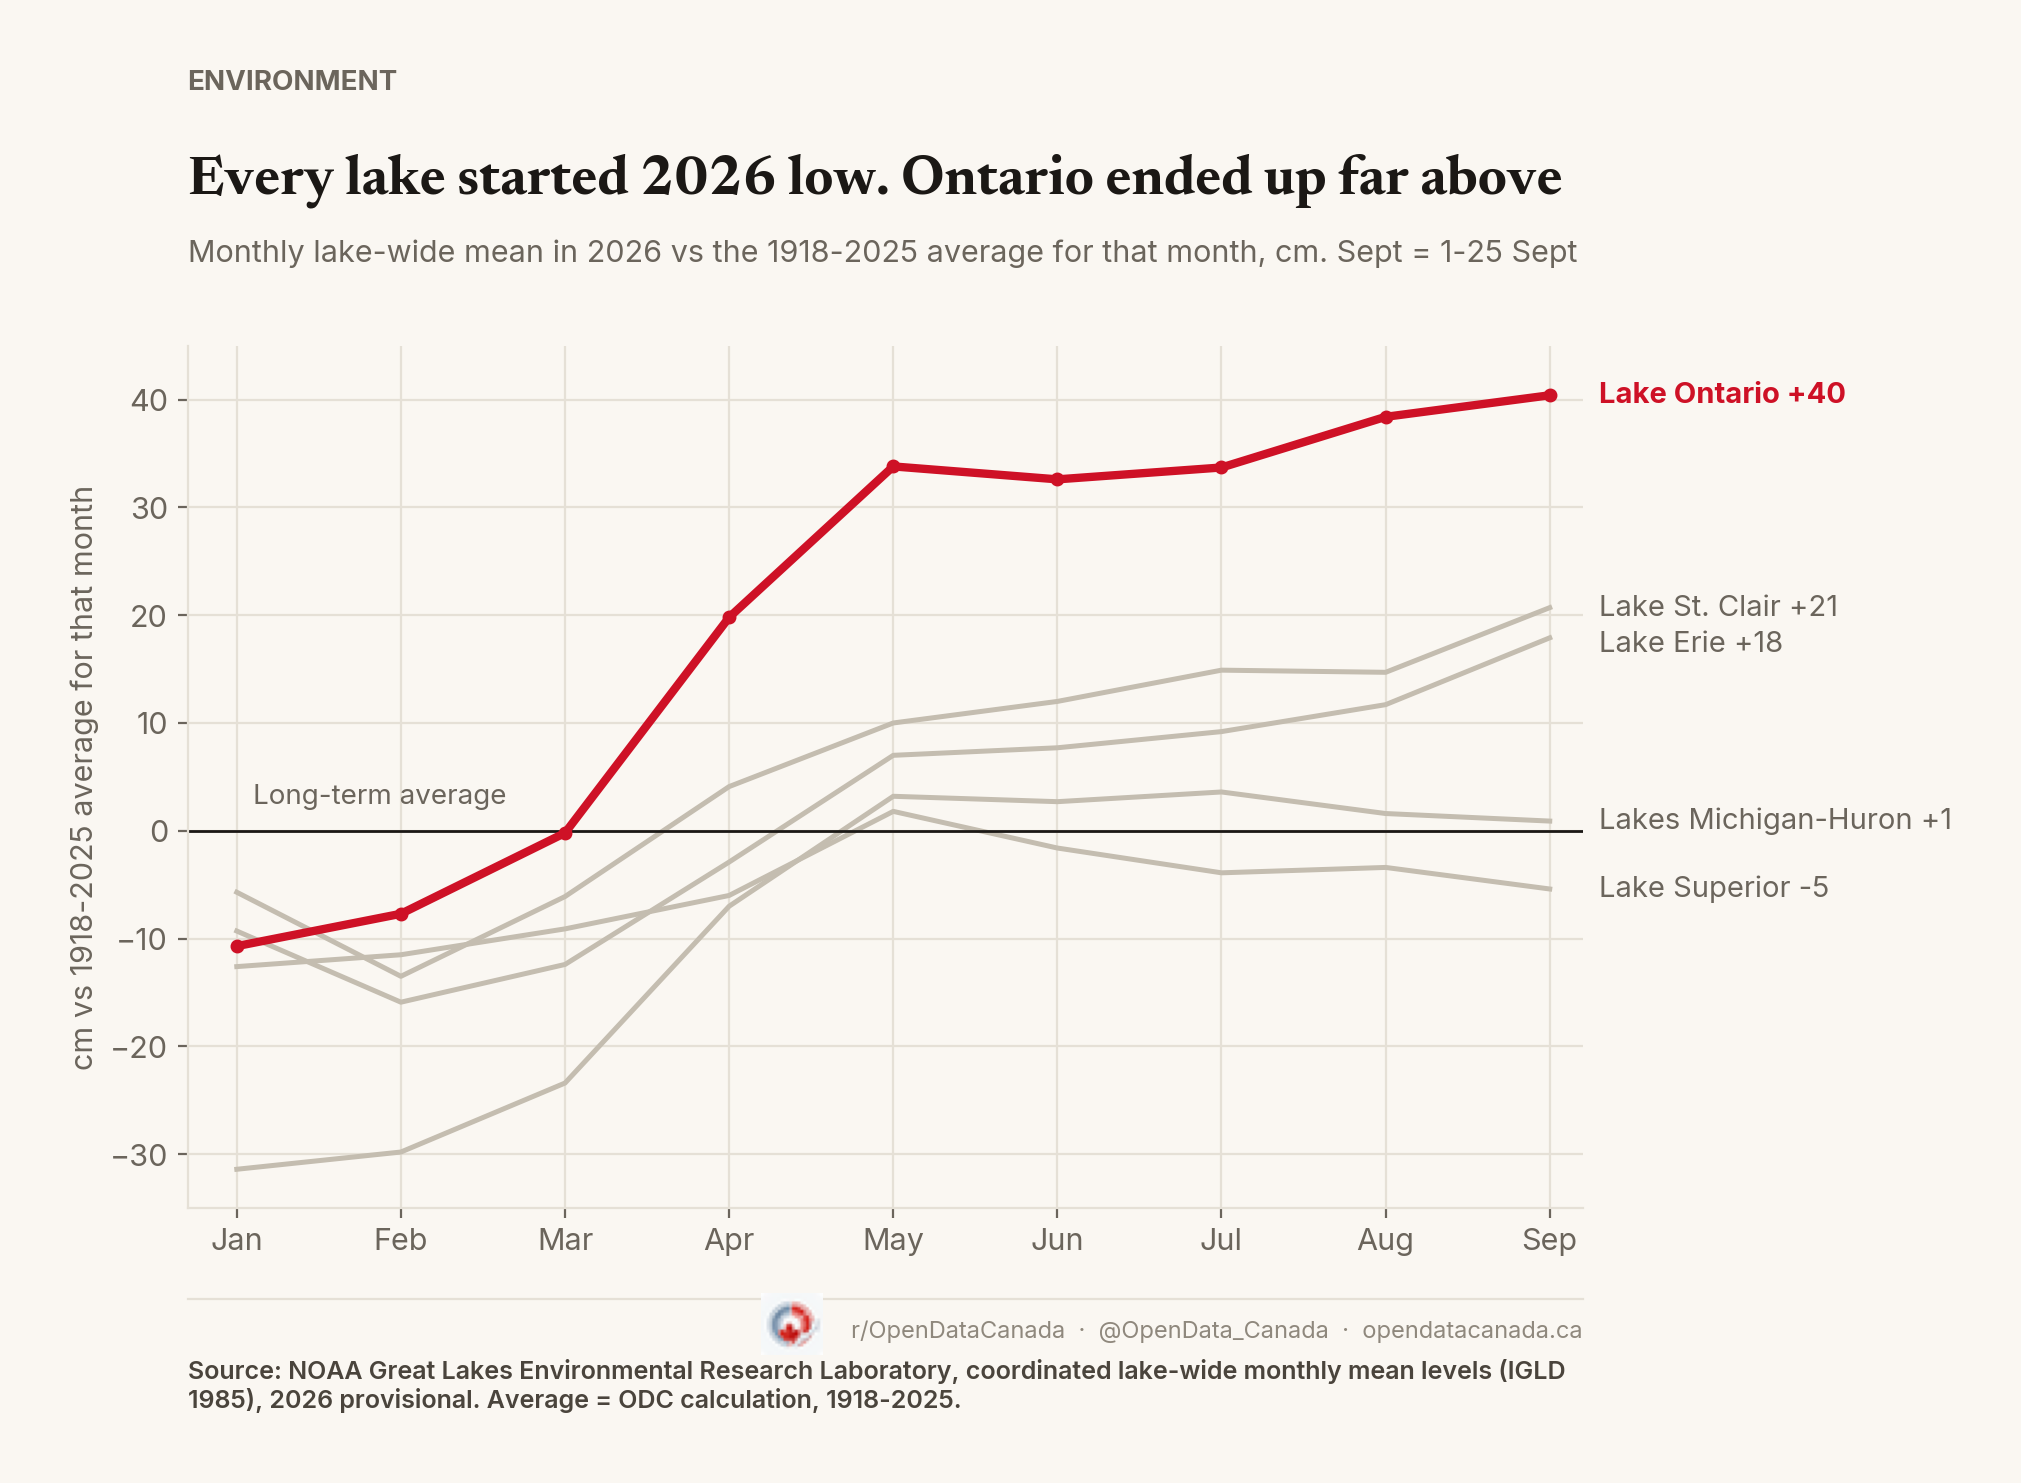
The other lakes rose too, just less dramatically. Lake Erie gained 51 centimetres to its June peak, against a typical January-to-June rise of 34. Lake St. Clair, the small lake between Huron and Erie, gained 56 centimetres to a July peak. Michigan-Huron climbed 63 centimetres to a July peak, which erased a deep winter deficit but only brought it back to roughly average. Superior gained 30 centimetres by August and never got above its long-term average by more than 2 centimetres, in May.
Not 2019, and slow to drain until September
This is not a repeat of 2017 or 2019, the two recent high-water years on Lake Ontario. Its June 2026 peak was 52 centimetres below the June 2019 record of 75.91 metres, and 42 centimetres below June 2017.
What stood out instead was how slowly the lake came back down. From June to August, Lake Ontario usually drops about 17 centimetres. This year it dropped 11. So the gap above average kept widening through the summer, from 33 centimetres in June to 38 in August, even as the water itself was going down. September to date is 7 centimetres above September 2017 and 9 centimetres below September 2019.
That changed in September. NOAA's daily lake-wide readings show Lake Ontario fell 23 centimetres between 1 and 25 September, from 75.19 to 74.96 metres. In a typical year the lake loses about 13 to 15 centimetres in a whole month at this time of year. By 25 September it stood 21 centimetres above the September average, roughly half the gap in the month-to-date figure. The full-month number will almost certainly come in below 40 centimetres, and the 7th-place ranking may not hold.
The year-over-year swing is large as well. Lake Ontario's September level so far is 42 centimetres higher than in September 2025, and Michigan-Huron's is 19 centimetres higher. Superior is exactly where it was a year ago.
For how the lakes themselves divide between the two countries, see our map of how much of each Great Lake is Canadian.
Lake Ontario spent the summer holding on to its spring surge. In September it started letting go, at roughly twice the usual pace.