Article · Trade · 6 min read
Every major Canadian airport lost US flights in 2026
The 52.8 percent cross-border collapse was mostly cars. In the air the pullback is gentler and very uneven: Toronto and Vancouver carry the most US exposure, but the prairie airports fell the hardest.
Our earlier piece showed Canadian return trips from the United States falling 52.8 percent from their August 2024 peak. That number comes from border-crossing data covering every mode of travel, and most of it is cars. The land border carries far more traffic than the airports, and the trips that vanished were the cancellable ones: same-day runs to fill up on gas, shop, or catch a game across the Niagara and Windsor crossings.
Flying is a different decision. People do not pop across the border by air for an afternoon, so the air pullback is smaller and slower to show up. To measure it we switch datasets. Border crossings give way to Statistics Canada Table 23-10-0312, which counts passengers screened by the Canadian Air Transport Security Authority (CATSA) at the country's eight largest airports. The table splits every passenger into one of three sectors: domestic, US (transborder), and overseas international.
The national picture: a tenth, not a half
Across the eight airports together, US-sector screened passengers are down about 10 percent since December 2024, on a 12-month rolling basis. That is far short of the 52.8 percent border-crossing figure, and that gap is what matters. The two numbers measure different things. One is a peak-to-trough drop in all-modes trips, dominated by cars. The other is the rolling change in air passengers. Together they describe one shift: cancelling was easy for drivers and hard for flyers.
Domestic and overseas air traffic each grew about 8 percent over the same period. Flying held up. It rotated away from the United States. The US share of screened passengers at the eight airports slipped from about 27 percent of all traffic to 24 percent, with domestic picking up roughly two points and overseas one.
Every figure here uses 12-month rolling totals. Raw monthly airport counts swing hard between the summer peak and the winter trough, and the rolling total averages that seasonality out.
Who is most exposed, and who fell hardest
These are two different questions, and the airports answer them differently.
Exposure is how much of an airport's traffic is US routes today.
| Airport | 12-mo passengers | Domestic | US | Overseas |
|---|---|---|---|---|
| Toronto YYZ | 21.0M | 33% | 28% | 39% |
| Vancouver YVR | 11.3M | 47% | 27% | 26% |
| Calgary YYC | 7.3M | 62% | 25% | 13% |
| Montréal YUL | 9.4M | 26% | 24% | 49% |
| Ottawa YOW | 2.3M | 73% | 15% | 12% |
| Edmonton YEG | 3.5M | 82% | 11% | 7% |
| Winnipeg YWG | 2.1M | 86% | 9% | 6% |
| Halifax YHZ | 2.0M | 80% | 8% | 12% |
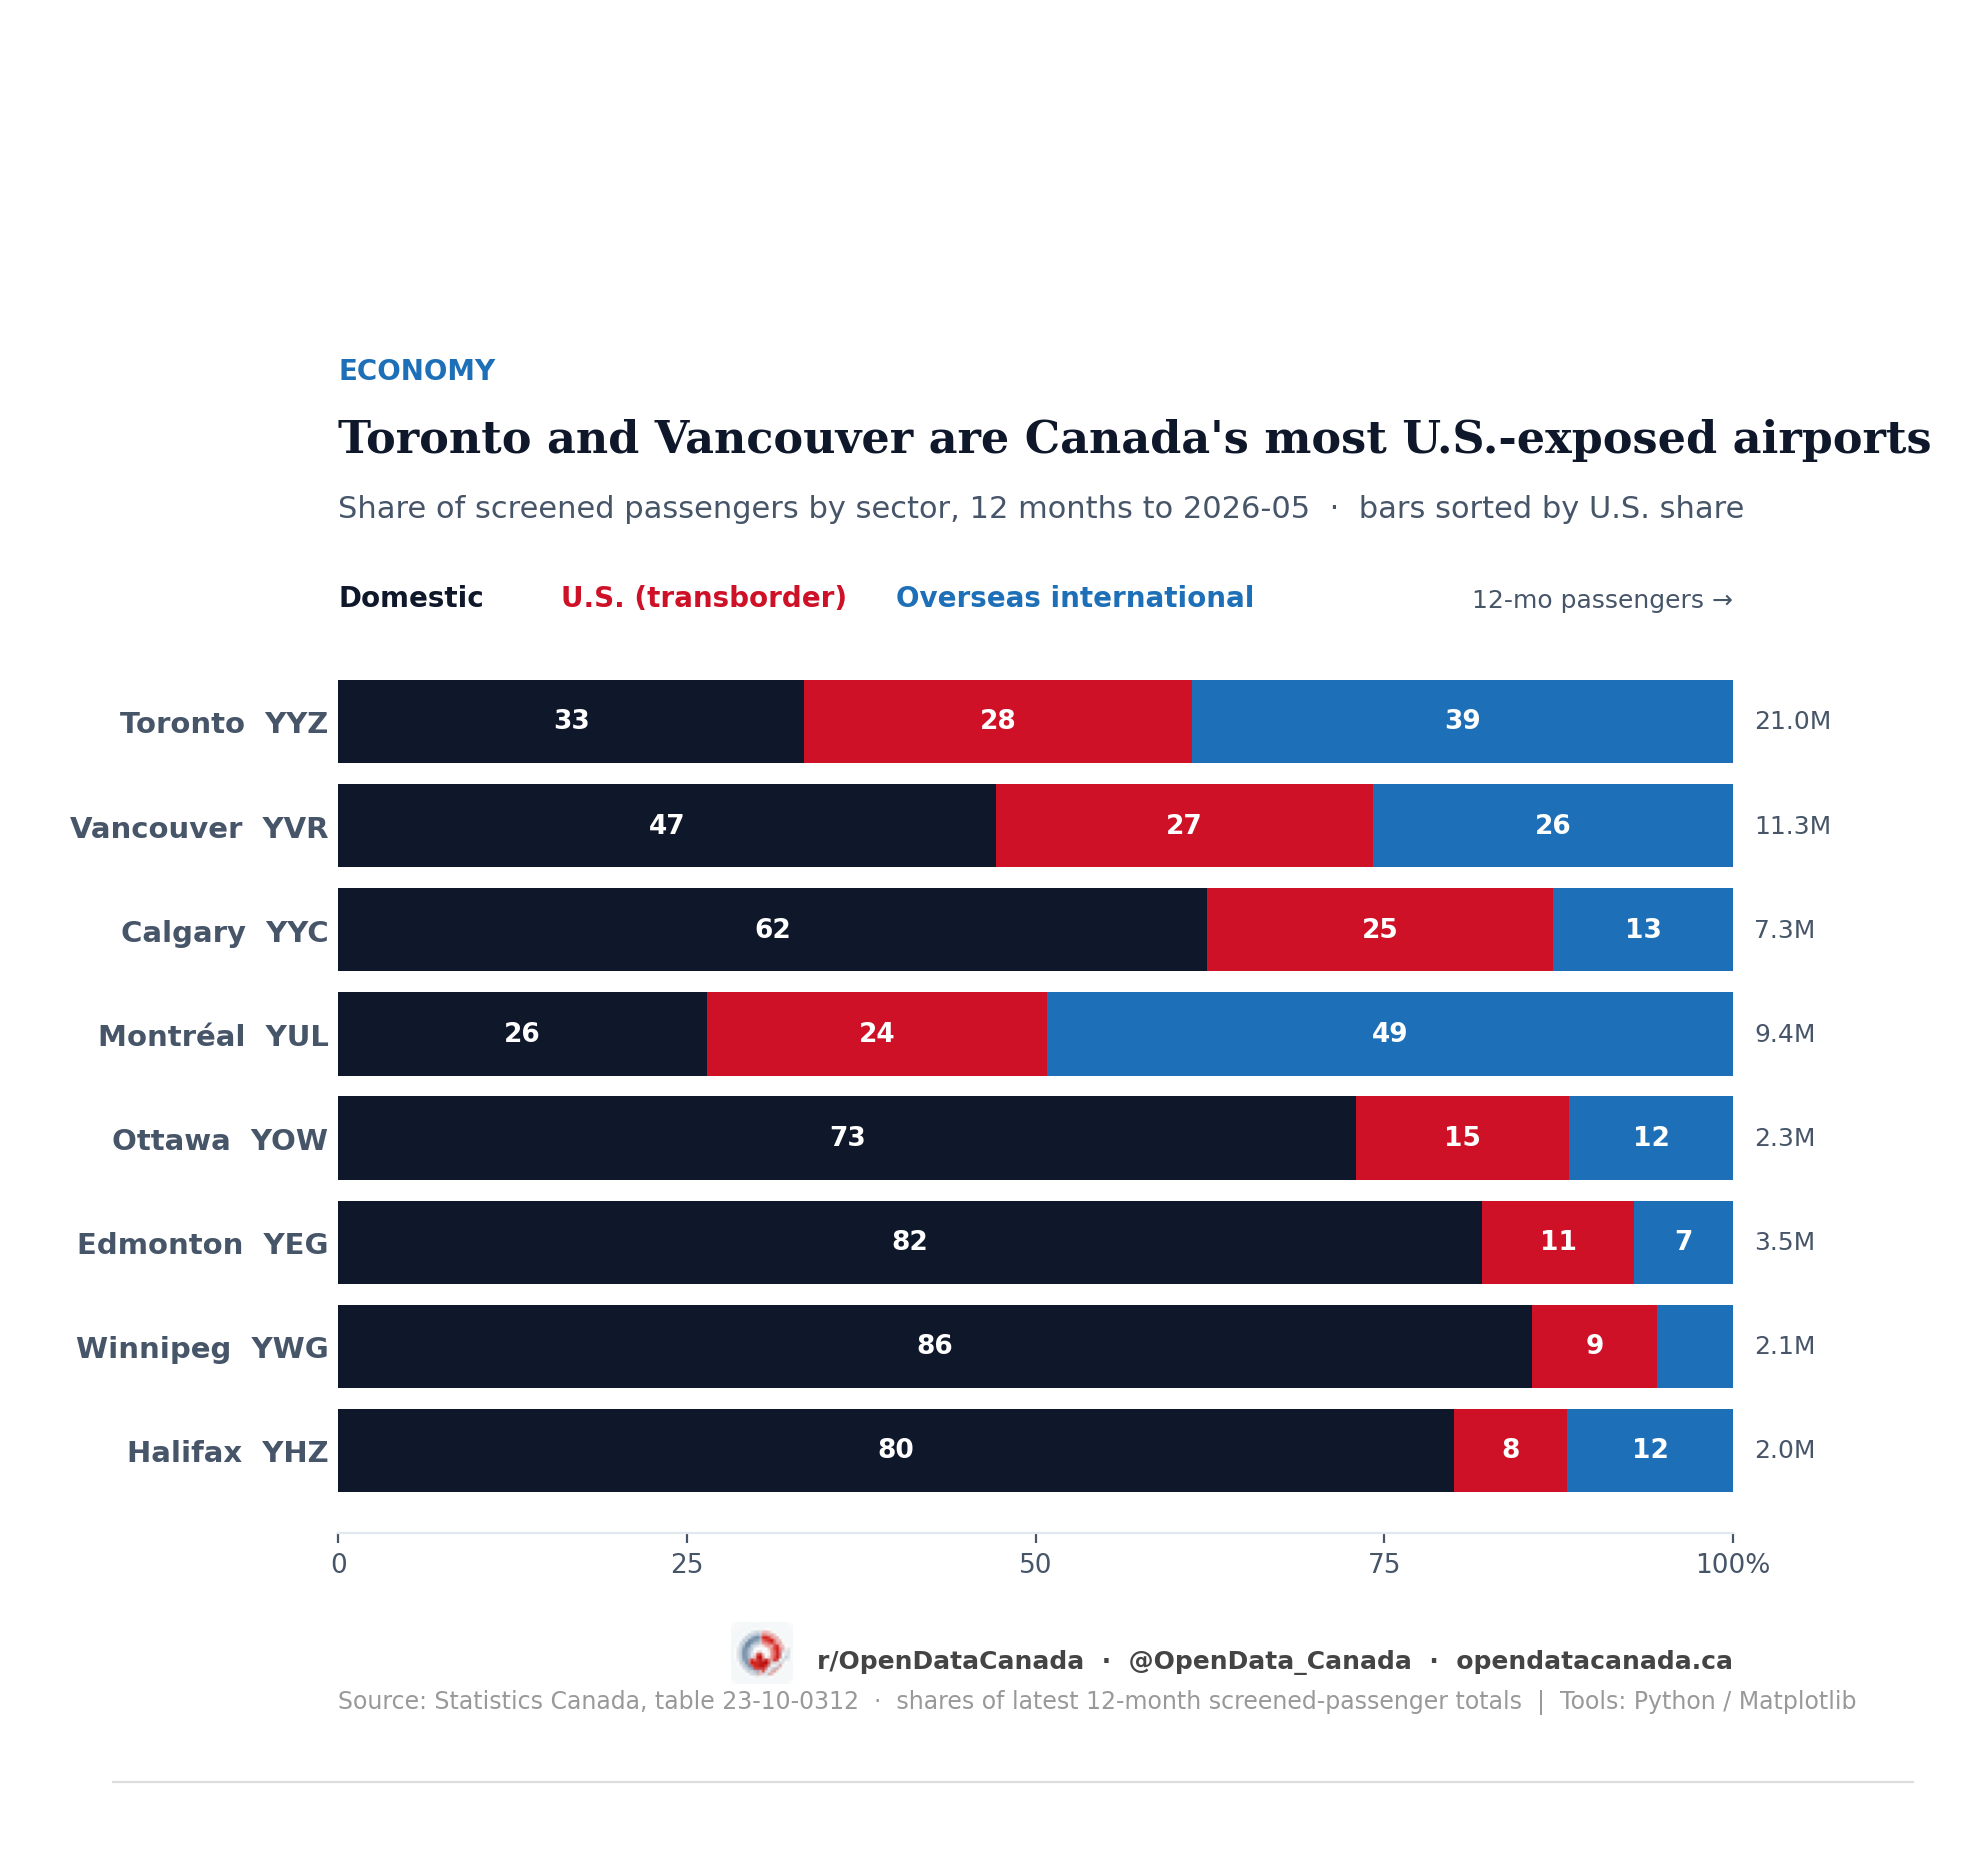
The big gateways are the most US-dependent. More than a quarter of everyone screened at Toronto and Vancouver is flying to or from the States. Calgary stands out. At 25 percent US it is a genuine transborder hub, more US-exposed than its reputation suggests.
The decline tells a different story. It is steepest at the smallest, most domestic airports.
| Airport | US sector since Dec 2024 |
|---|---|
| Edmonton YEG | −19% |
| Winnipeg YWG | −19% |
| Montréal YUL | −12% |
| Toronto YYZ | −10% |
| Vancouver YVR | −8% |
| Calgary YYC | −7% |
| Ottawa YOW | −7% |
| Halifax YHZ | −4% |
Edmonton and Winnipeg lost close to a fifth of their US air traffic, about double the national rate, even though US routes are a small slice of what they do. The gateways, with the most to lose, lost proportionally less.
The chart below shows all three sectors at each airport, indexed so December 2024 reads as 100. The red US line falls in every panel. The domestic and overseas lines climb.
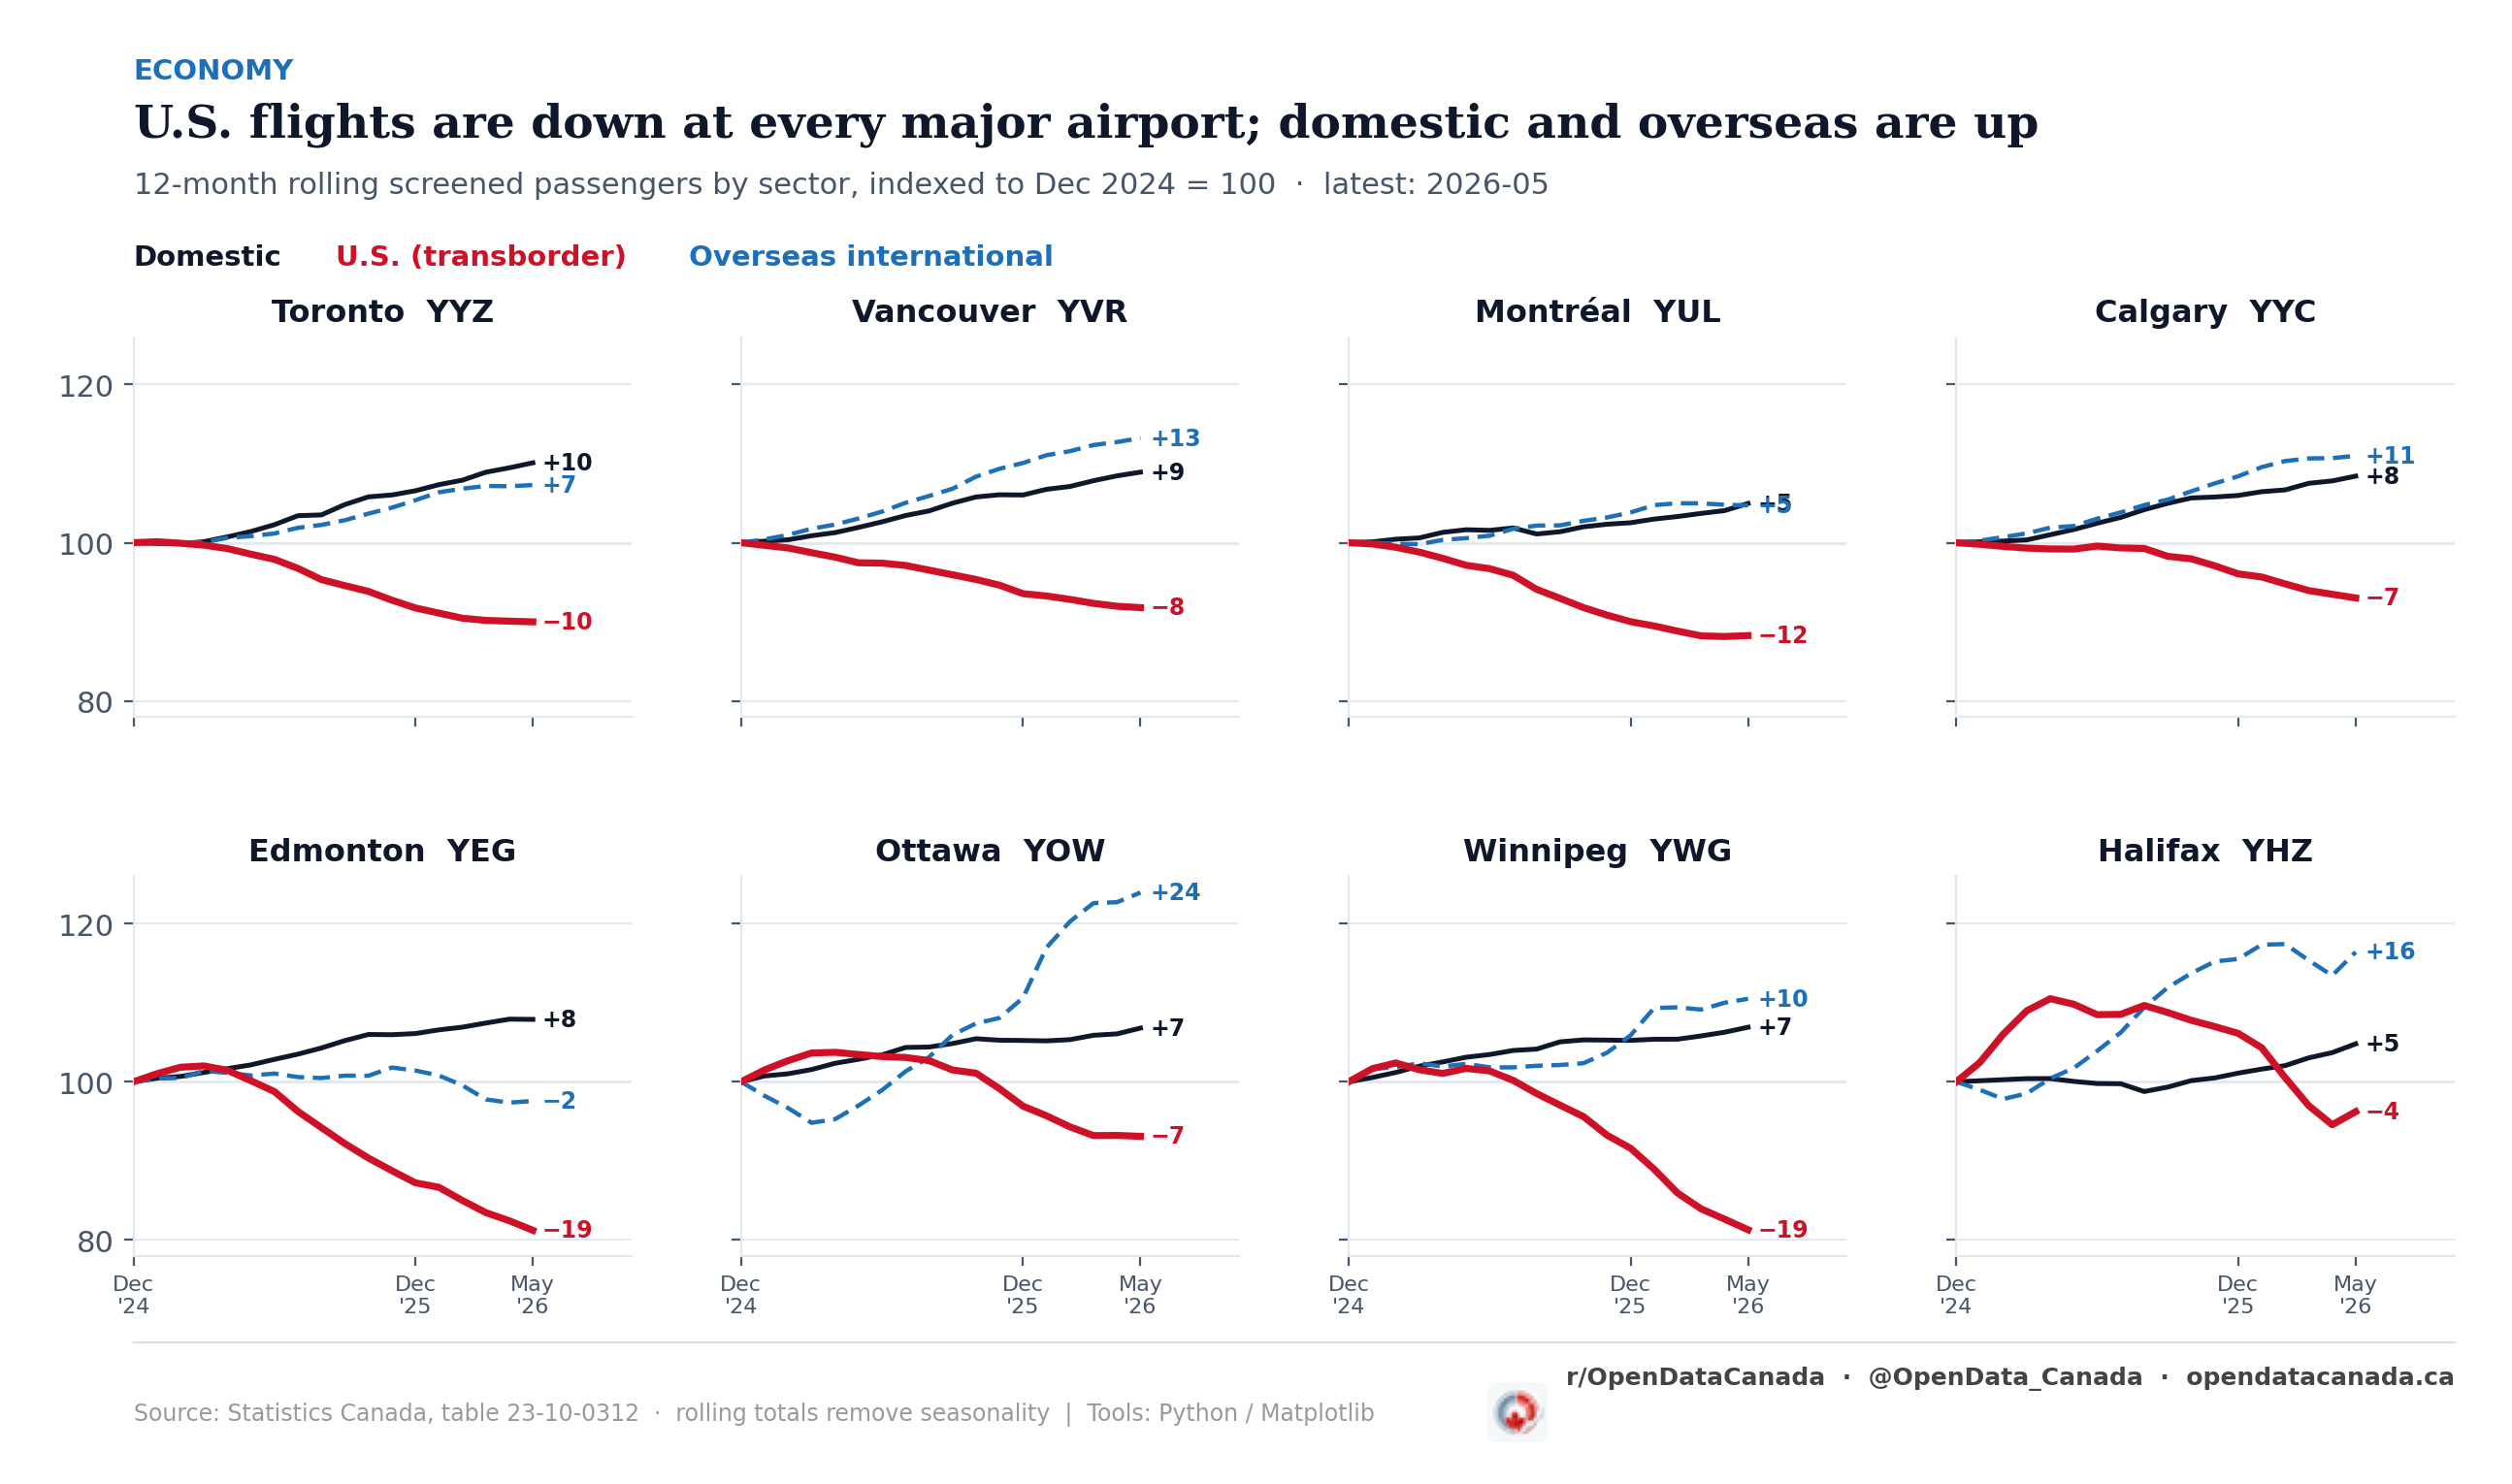
Where the demand went depended on the region
The freed-up capacity did not vanish. It moved, and it moved differently depending on the airport.
In the West, travellers stayed home. At Edmonton and Winnipeg almost all of the US shortfall was replaced by domestic flying. Edmonton's overseas traffic actually shrank.
At the international gateways, the swap went overseas instead. Vancouver's overseas screened passengers are up 13 percent. Montréal has tilted hard international, with overseas now 49 percent of its traffic. The biggest overseas jumps of all came at two mid-size hubs: Ottawa up 24 percent and Halifax up 16 percent.
The pattern matches the behavioural story from the first article. Westerners who would have flown to the US are flying inside Canada. Travellers at the big international gateways are swapping a US trip for one further afield.
The laggard: Halifax
One airport barely moved. Halifax's US sector is down only 4 percent, and it was still rising into the spring of 2025, peaking about 11 percent above its December 2024 level before it turned over. It climbed higher than any of the others and was the last of the eight to roll. Even in the most recent year, three of its twelve months were still up against the year before, the only airport where that happened. Halifax is small enough that a single seasonal sun route can swing its numbers, so it reads as the noisy exception rather than a counter-trend.
What this adds to the border story
The 52.8 percent border-crossing collapse and this 10 percent air decline do not contradict each other. They measure the same shift two different ways. Cars do the cancellable, same-day trips, so the all-modes number is huge. Flights are planned and paid for in advance, so the air number is smaller. It is still negative at every major airport, and it points the same way everywhere: US traffic down, domestic up in the West, overseas up at the big hubs.
The next two quarters will show whether the US air sector recovers toward its December 2024 level as cross-border tensions ease, or whether some of the rerouting outlasts the dispute that drove it, the way much of the border-crossing drop already has.