Economy
Foreign Control of Canada's Businesses Has Been Shrinking for 14 Straight Years — And More Than Half of What's Left Is American
In 2024, foreign investors legally controlled 13.9% of the assets held by businesses operating in Canada, the lowest figure Statistics Canada has recorded since the series began in 2010. Of that shrinking foreign share, the United States alone accounts for more than half.
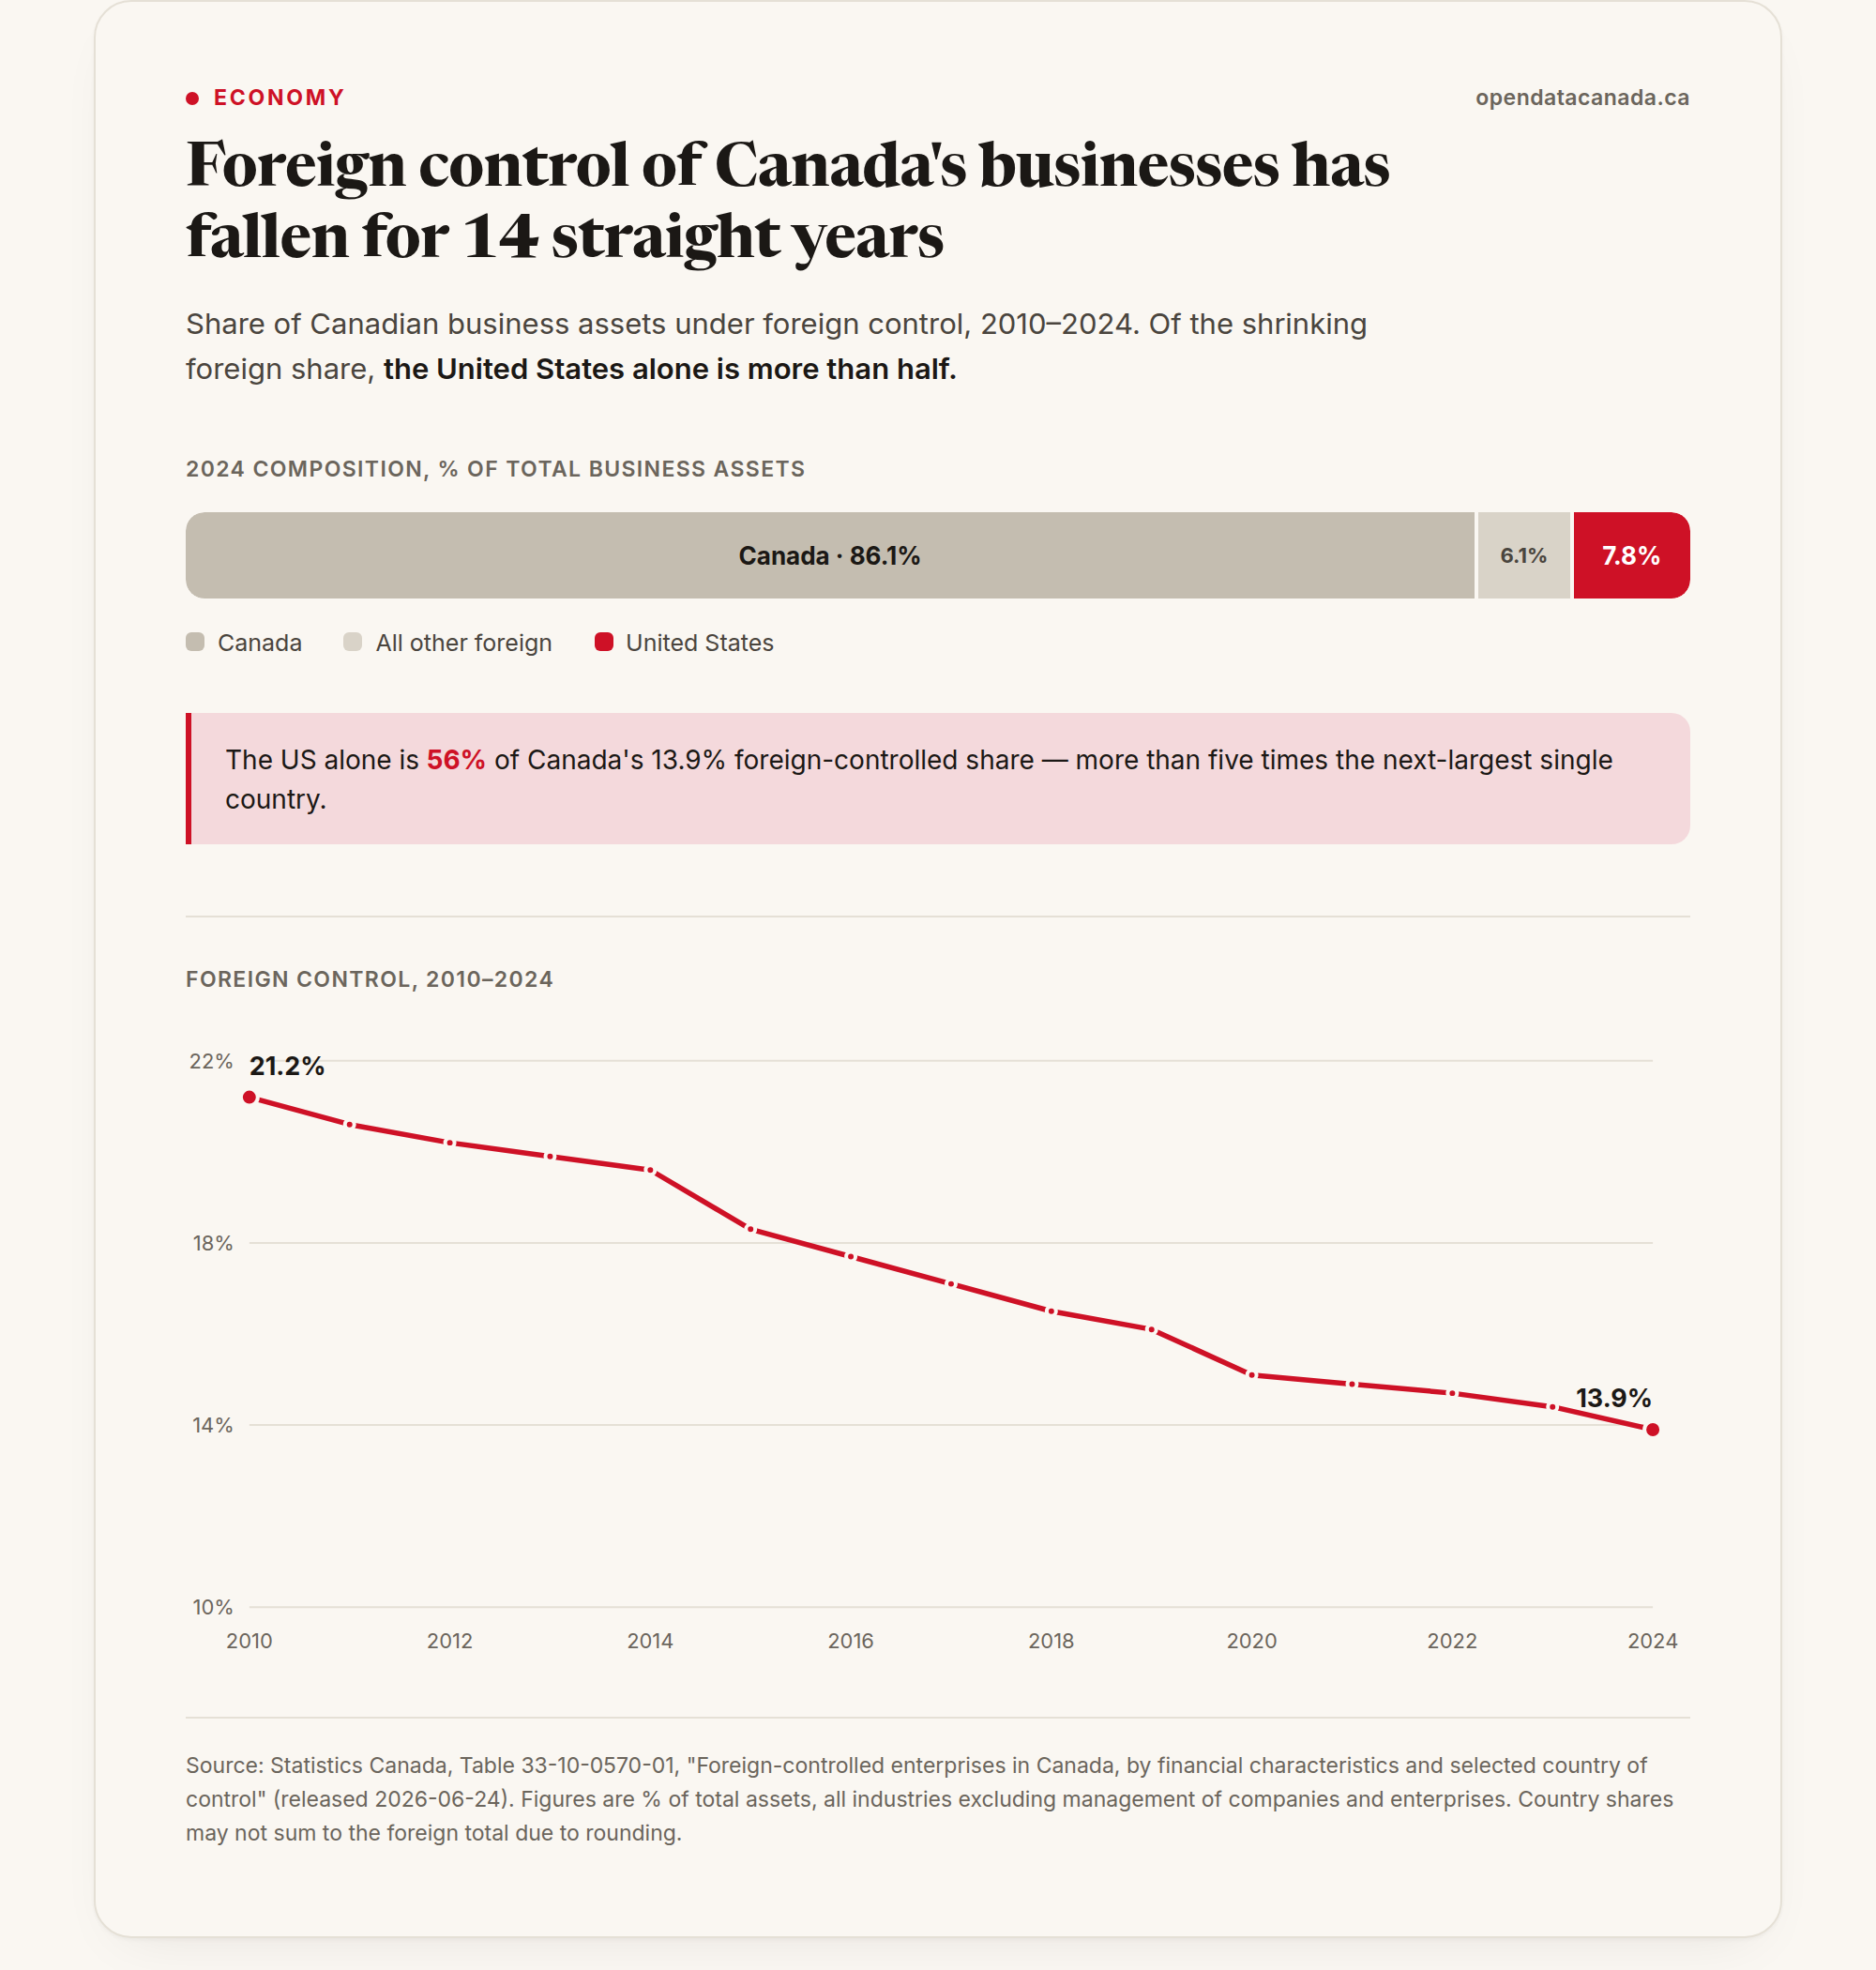
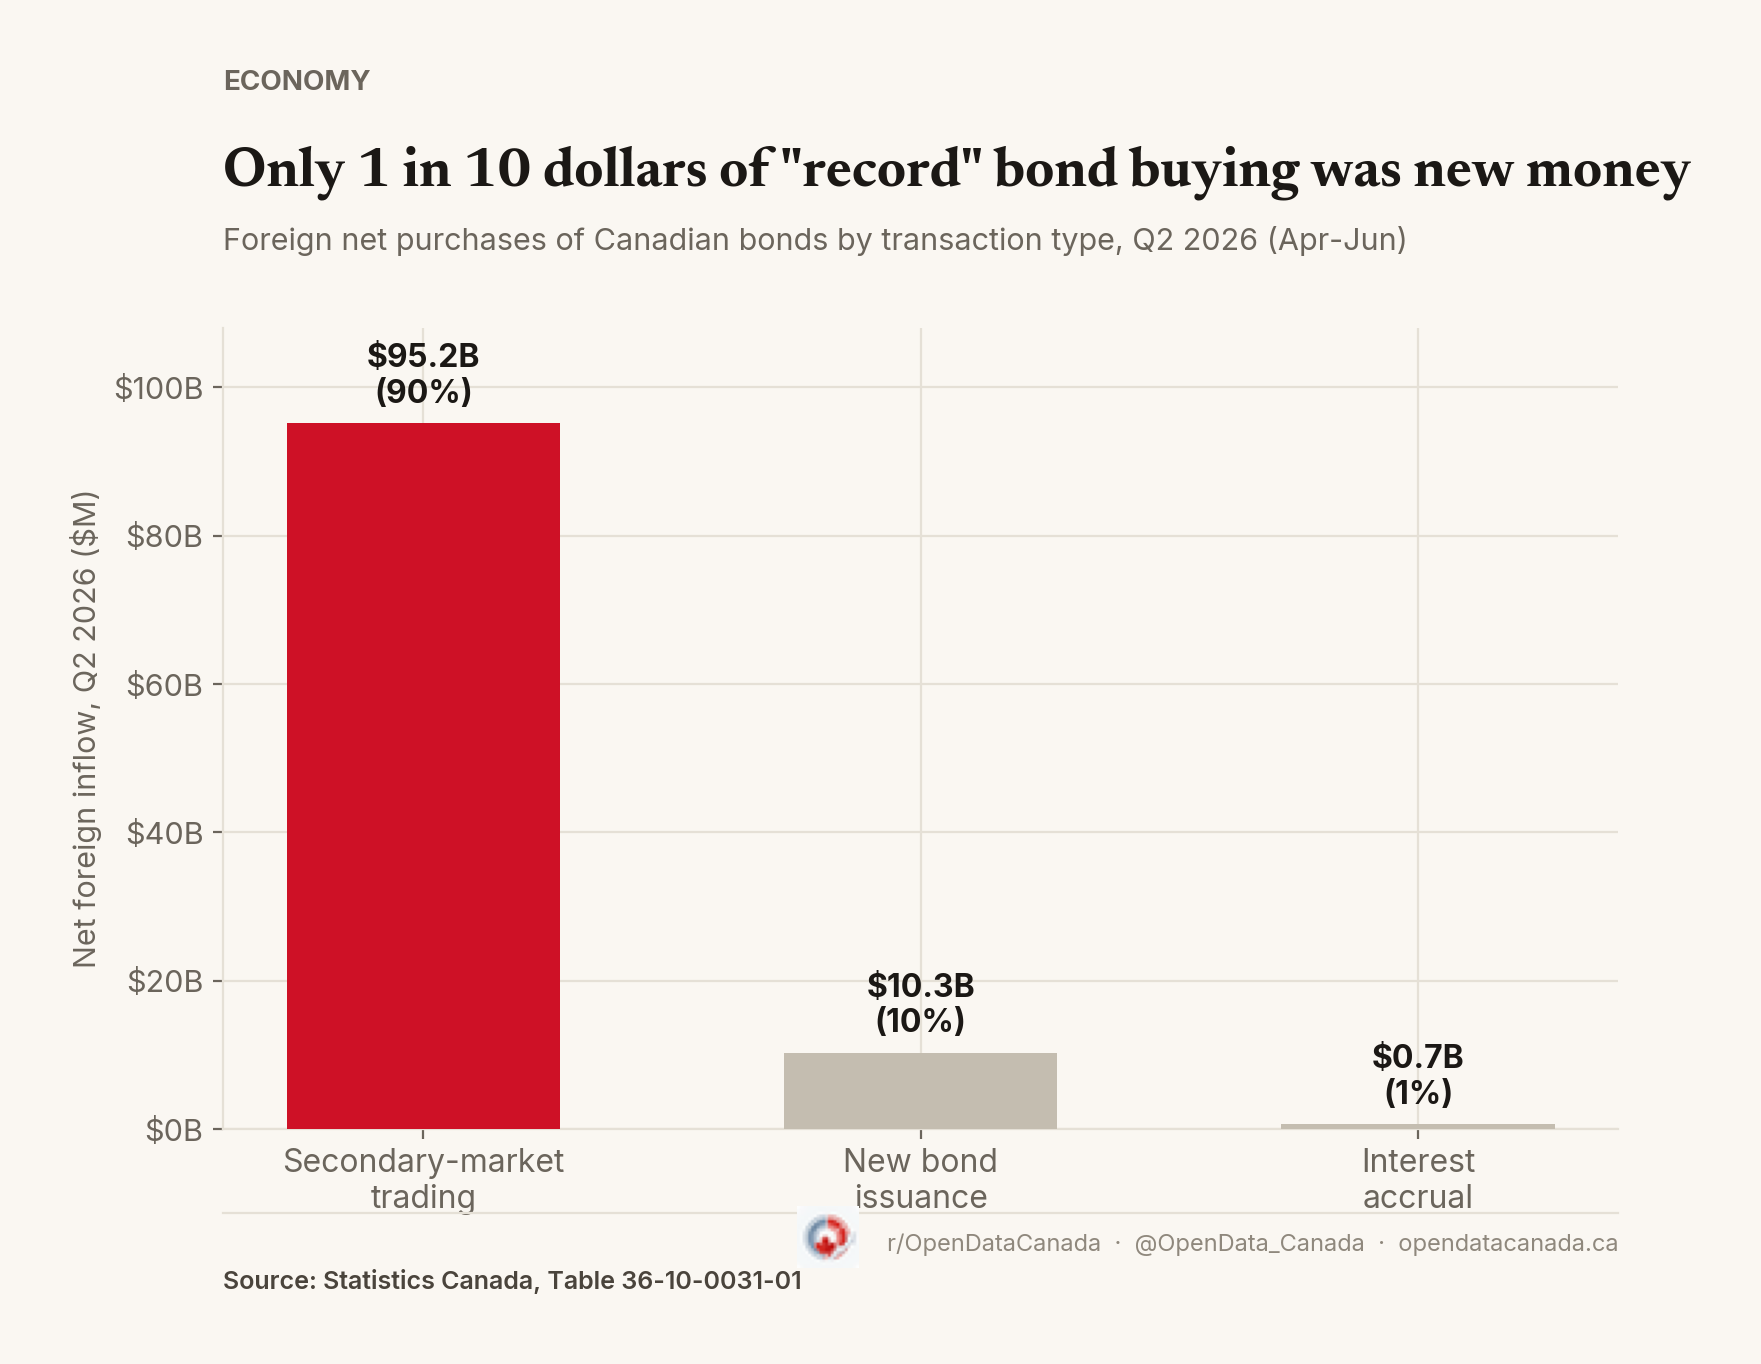
In 2024, foreign investors legally controlled 13.9% of the assets held by businesses operating in Canada. That's the lowest figure Statistics Canada has recorded since it started tracking this specific series in 2010, when foreign control stood at 21.2%. It has fallen every single year in between — no plateau, no bounce, just a straight fourteen-year decline. Foreign demand for Canadian bonds moved the opposite way in 2026, hitting a quarterly record.
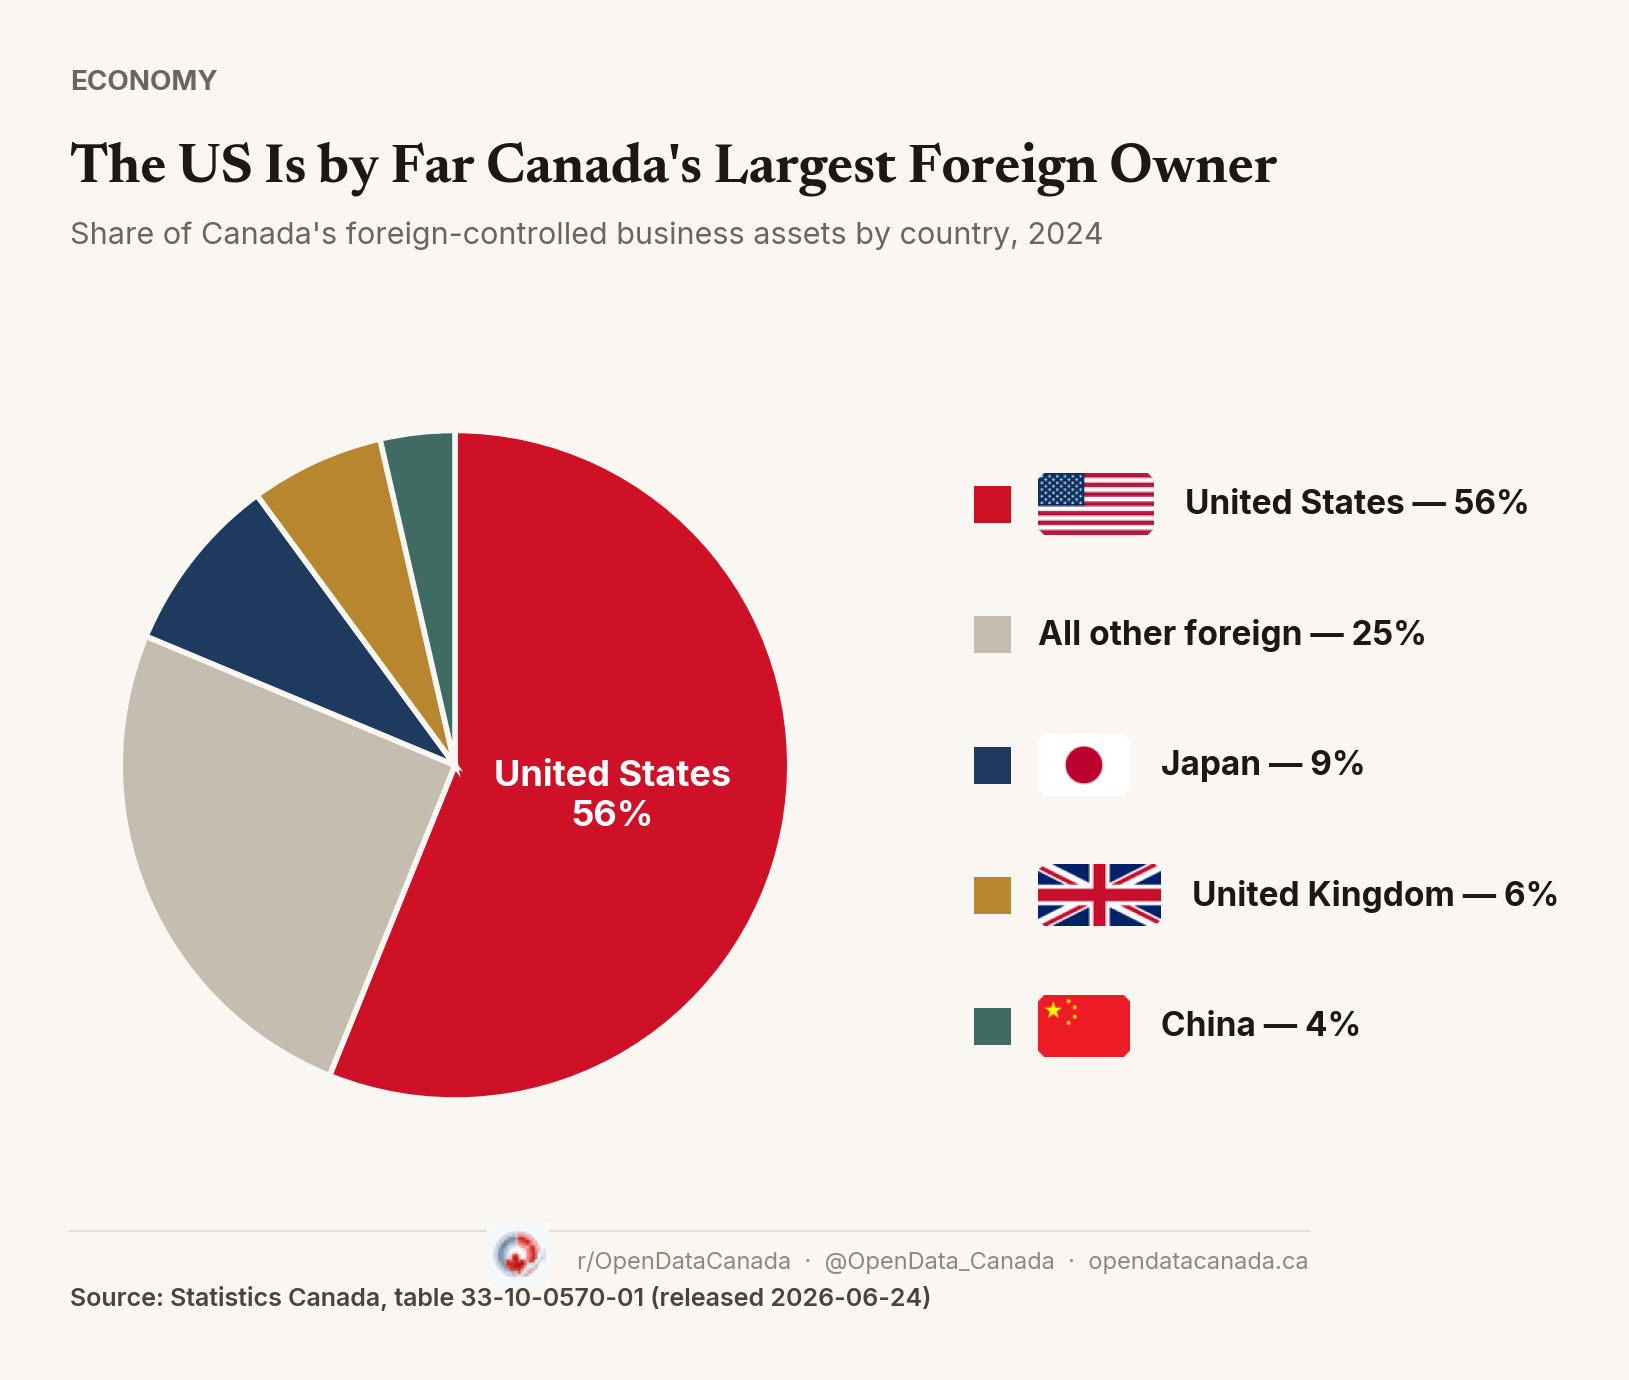
The real story isn't that foreign ownership is shrinking in general. It's who's left. Of that shrinking 13.9%, the United States alone accounts for 7.8 percentage points — more than half the entire foreign share, and more than five times the next-largest single country. As the foreign share of Canada's economy has gotten smaller, it hasn't gotten more diverse. It's gotten more concentrated in American hands, relatively speaking, even as the raw US number has drifted down too.
The US share fell further than the total, then stalled. American-controlled assets (measured as "Americas excluding Canada," a bucket the US dominates) fell from 11.5% in 2010 to a low of 7.8% in 2020 — but then it stopped falling. By 2024 it had ticked back up to 8.0%, a small move over three years that's worth watching rather than calling a reversal outright. Europe, meanwhile, kept shrinking: its share has been cut by nearly two-thirds over the same period, from 7.6% in 2010 to 3.3% in 2024.
China's share is a rounding error, and it isn't growing. Chinese-controlled business assets in Canada peaked at 0.6% of the total between 2016 and 2020 — itself a small number — and have since edged down to 0.5%, flat for four straight years. Relative to the US, China's position has shrunk rather than grown: at its 2016 peak, China's share was equivalent to about 6.5% of the US share; by 2024 that ratio was down to roughly 6.3%.
Japan and the UK are both smaller than they used to be, and both smaller than China at points in the 2010s. Japan's control share sat at 1.2% of assets in 2024; the UK's at 0.9%. Neither has moved dramatically over the period — they've mostly just stayed small while the bigger blocs (US, Europe) did the shrinking.
This is "control," not "ownership" in the everyday sense. StatCan's figures come from the Corporations Returns Act and measure legal control: broadly, whoever holds a clear majority of voting shares. A company can have 40% of its shares held by foreign institutional investors, collectively, and still count as 100% Canadian-controlled here if no single foreign entity holds a majority. So this data answers "who runs the company," not "who owns the stock" — the two can diverge sharply for widely-held public companies.
The national total also hides large industry variation. StatCan's finer-grained 2024 figures (not charted here) show foreign control at 48.9% of assets in wholesale trade, 48.3% in non-depository credit intermediation, 43.5% in manufacturing, and 32.3% in oil and gas extraction — versus just 1.8% in educational, health care and social assistance services. That's a separate, more granular story than the one told by the national total.
Sources & data
Statistics Canada, Table 33-10-0570-01, "Foreign-controlled enterprises in Canada, by financial characteristics and selected country of control," released 2026-06-24. Figures are percentage of total assets, all industries excluding management of companies and enterprises, 2010–2024. "United States" figure (7.8% in 2024) is the US-specific series; "Americas excluding Canada" (8.0% in 2024) is a broader bucket that includes a small residual of other Western Hemisphere countries — the two are cited separately above and should not be summed. Country shares may not sum exactly to the foreign-control total due to rounding and unassigned/other categories. Industry figures are the same table's 2024 NAICS breakdown, percentage of total assets by industry. Legal control is defined per the Corporations Returns Act (generally majority voting control), not aggregate or dispersed shareholding — see the fifth paragraph above for why that distinction matters for how this data should and shouldn't be read.