Subscribe
RATE 2.25% on hold INFLATION 3.2% from 2.8% UNEMPLOYMENT 6.5% ▼0.1pt AVG WAGE $37.20 ▲3.3% YoY GDP ▲0.5% MoM NEW-HOME PRICES ▼2.4% YoY

Justice · 5 min

Fraud used to be solved like a violent crime. Now it almost never is.

In 1998, Canadian police cleared 60% of reported frauds — on par with how often they cleared a sexual assault that year. By 2025, that number is 10.3%, the largest decline of any offence among the 17 major categories we examined. It's happening against a backdrop of its own: the national violent-crime clearance rate bottomed at a 28-year low in 2023 and has only partly recovered since.

Read the article →
Fast facts

Six numbers that name something real about Canada right now.

1,967
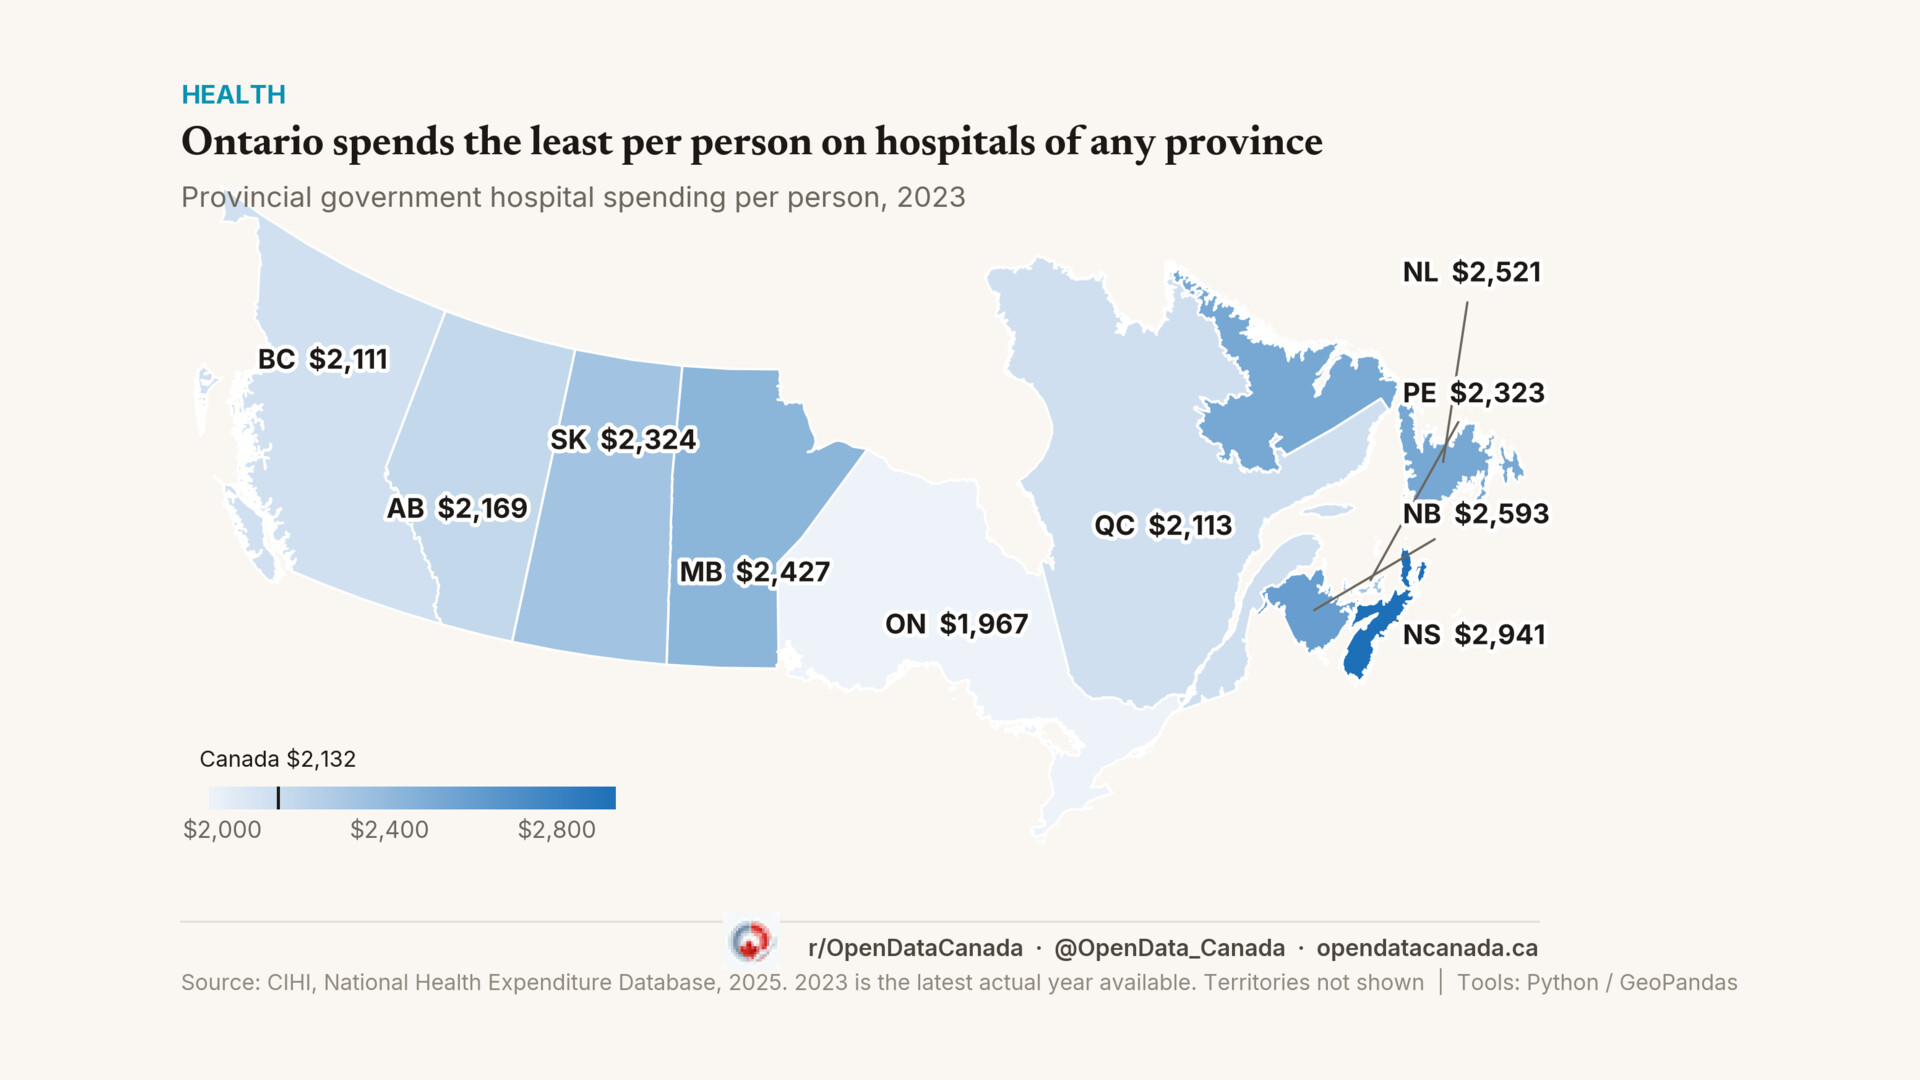
dollars per resident Ontario spent on hospitals in 2023 — the lowest of any province
Nova Scotia spent 2,941, about 974 more per person. Adjusting for Ontario's younger population barely moves the number.
See the article →
95 %
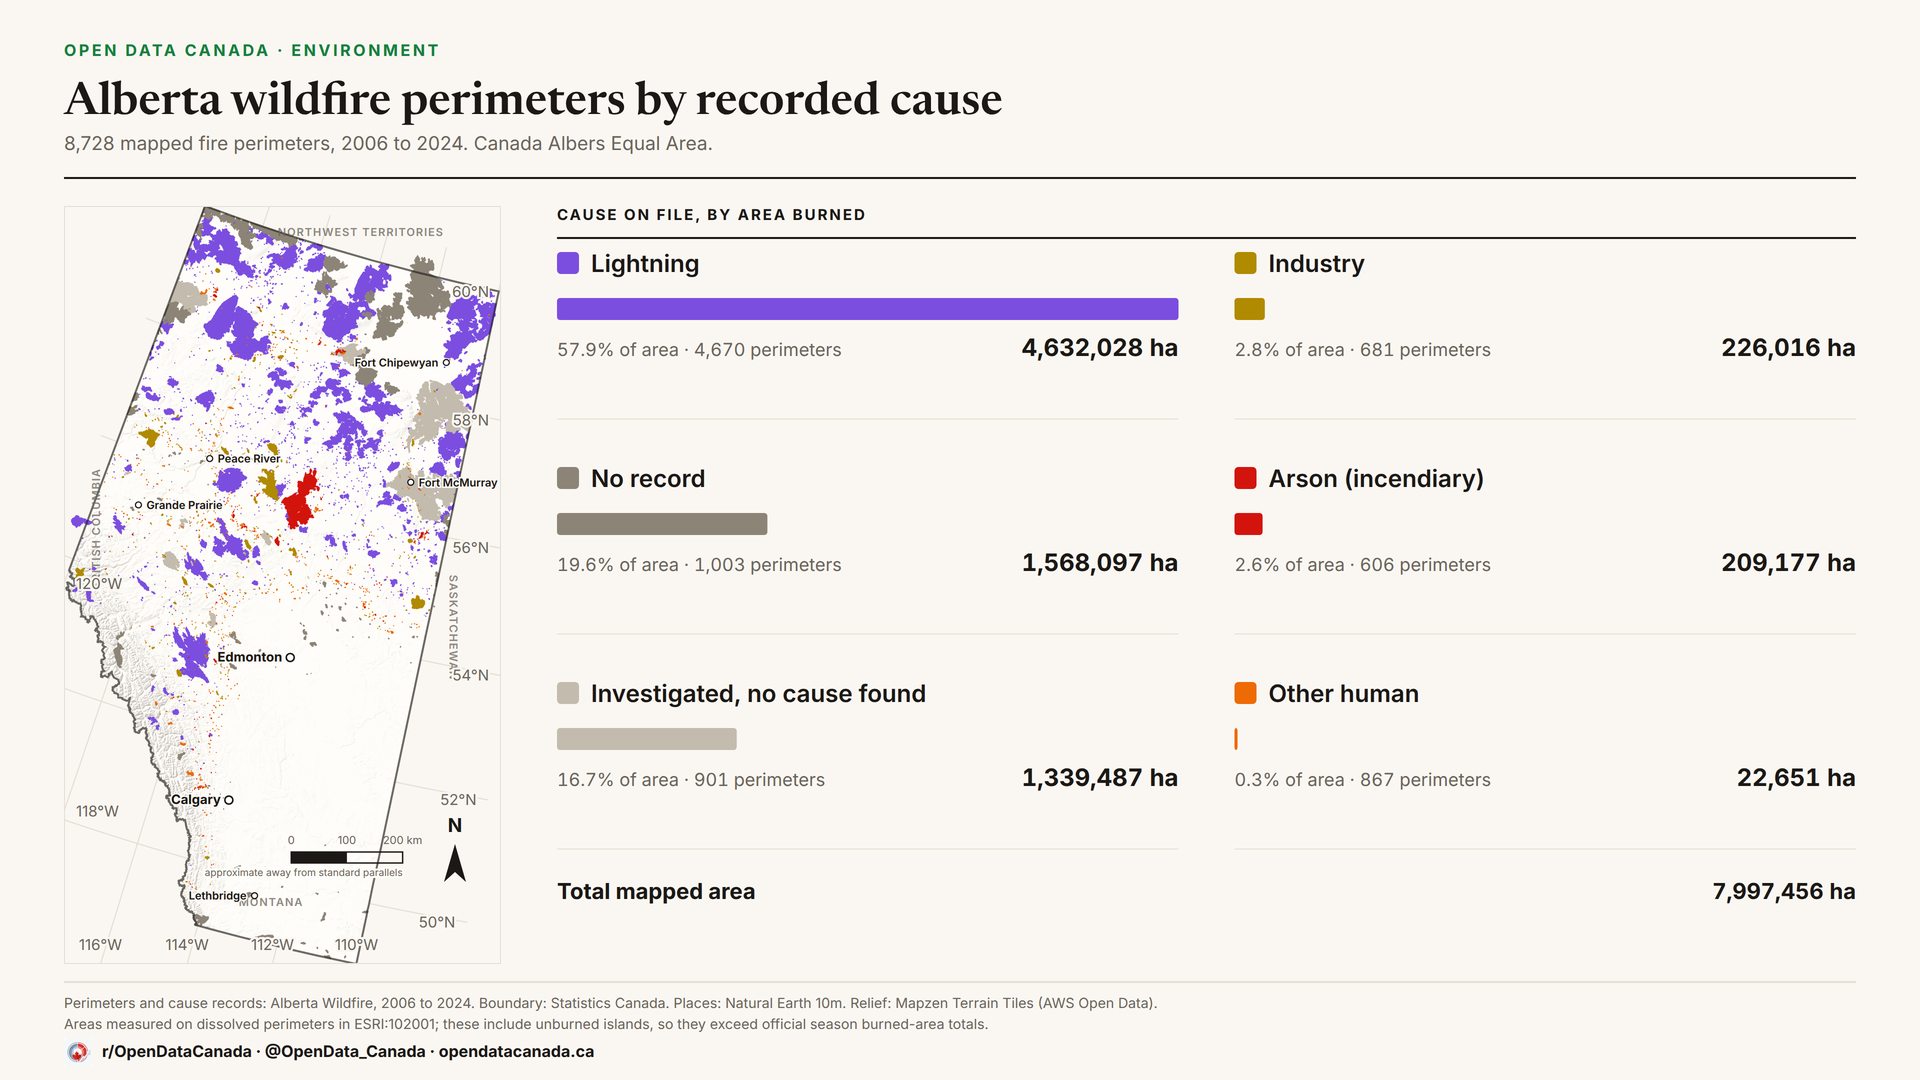
of everything Alberta records as arson since 2006 is one single fire
Arson is a rounding error by area. A fifth of what Alberta maps carries no cause in the province's own file — though other governments hold one for almost all of it.
See the article →
rise in extortion across Canada since 2000 — tenfold in Peel
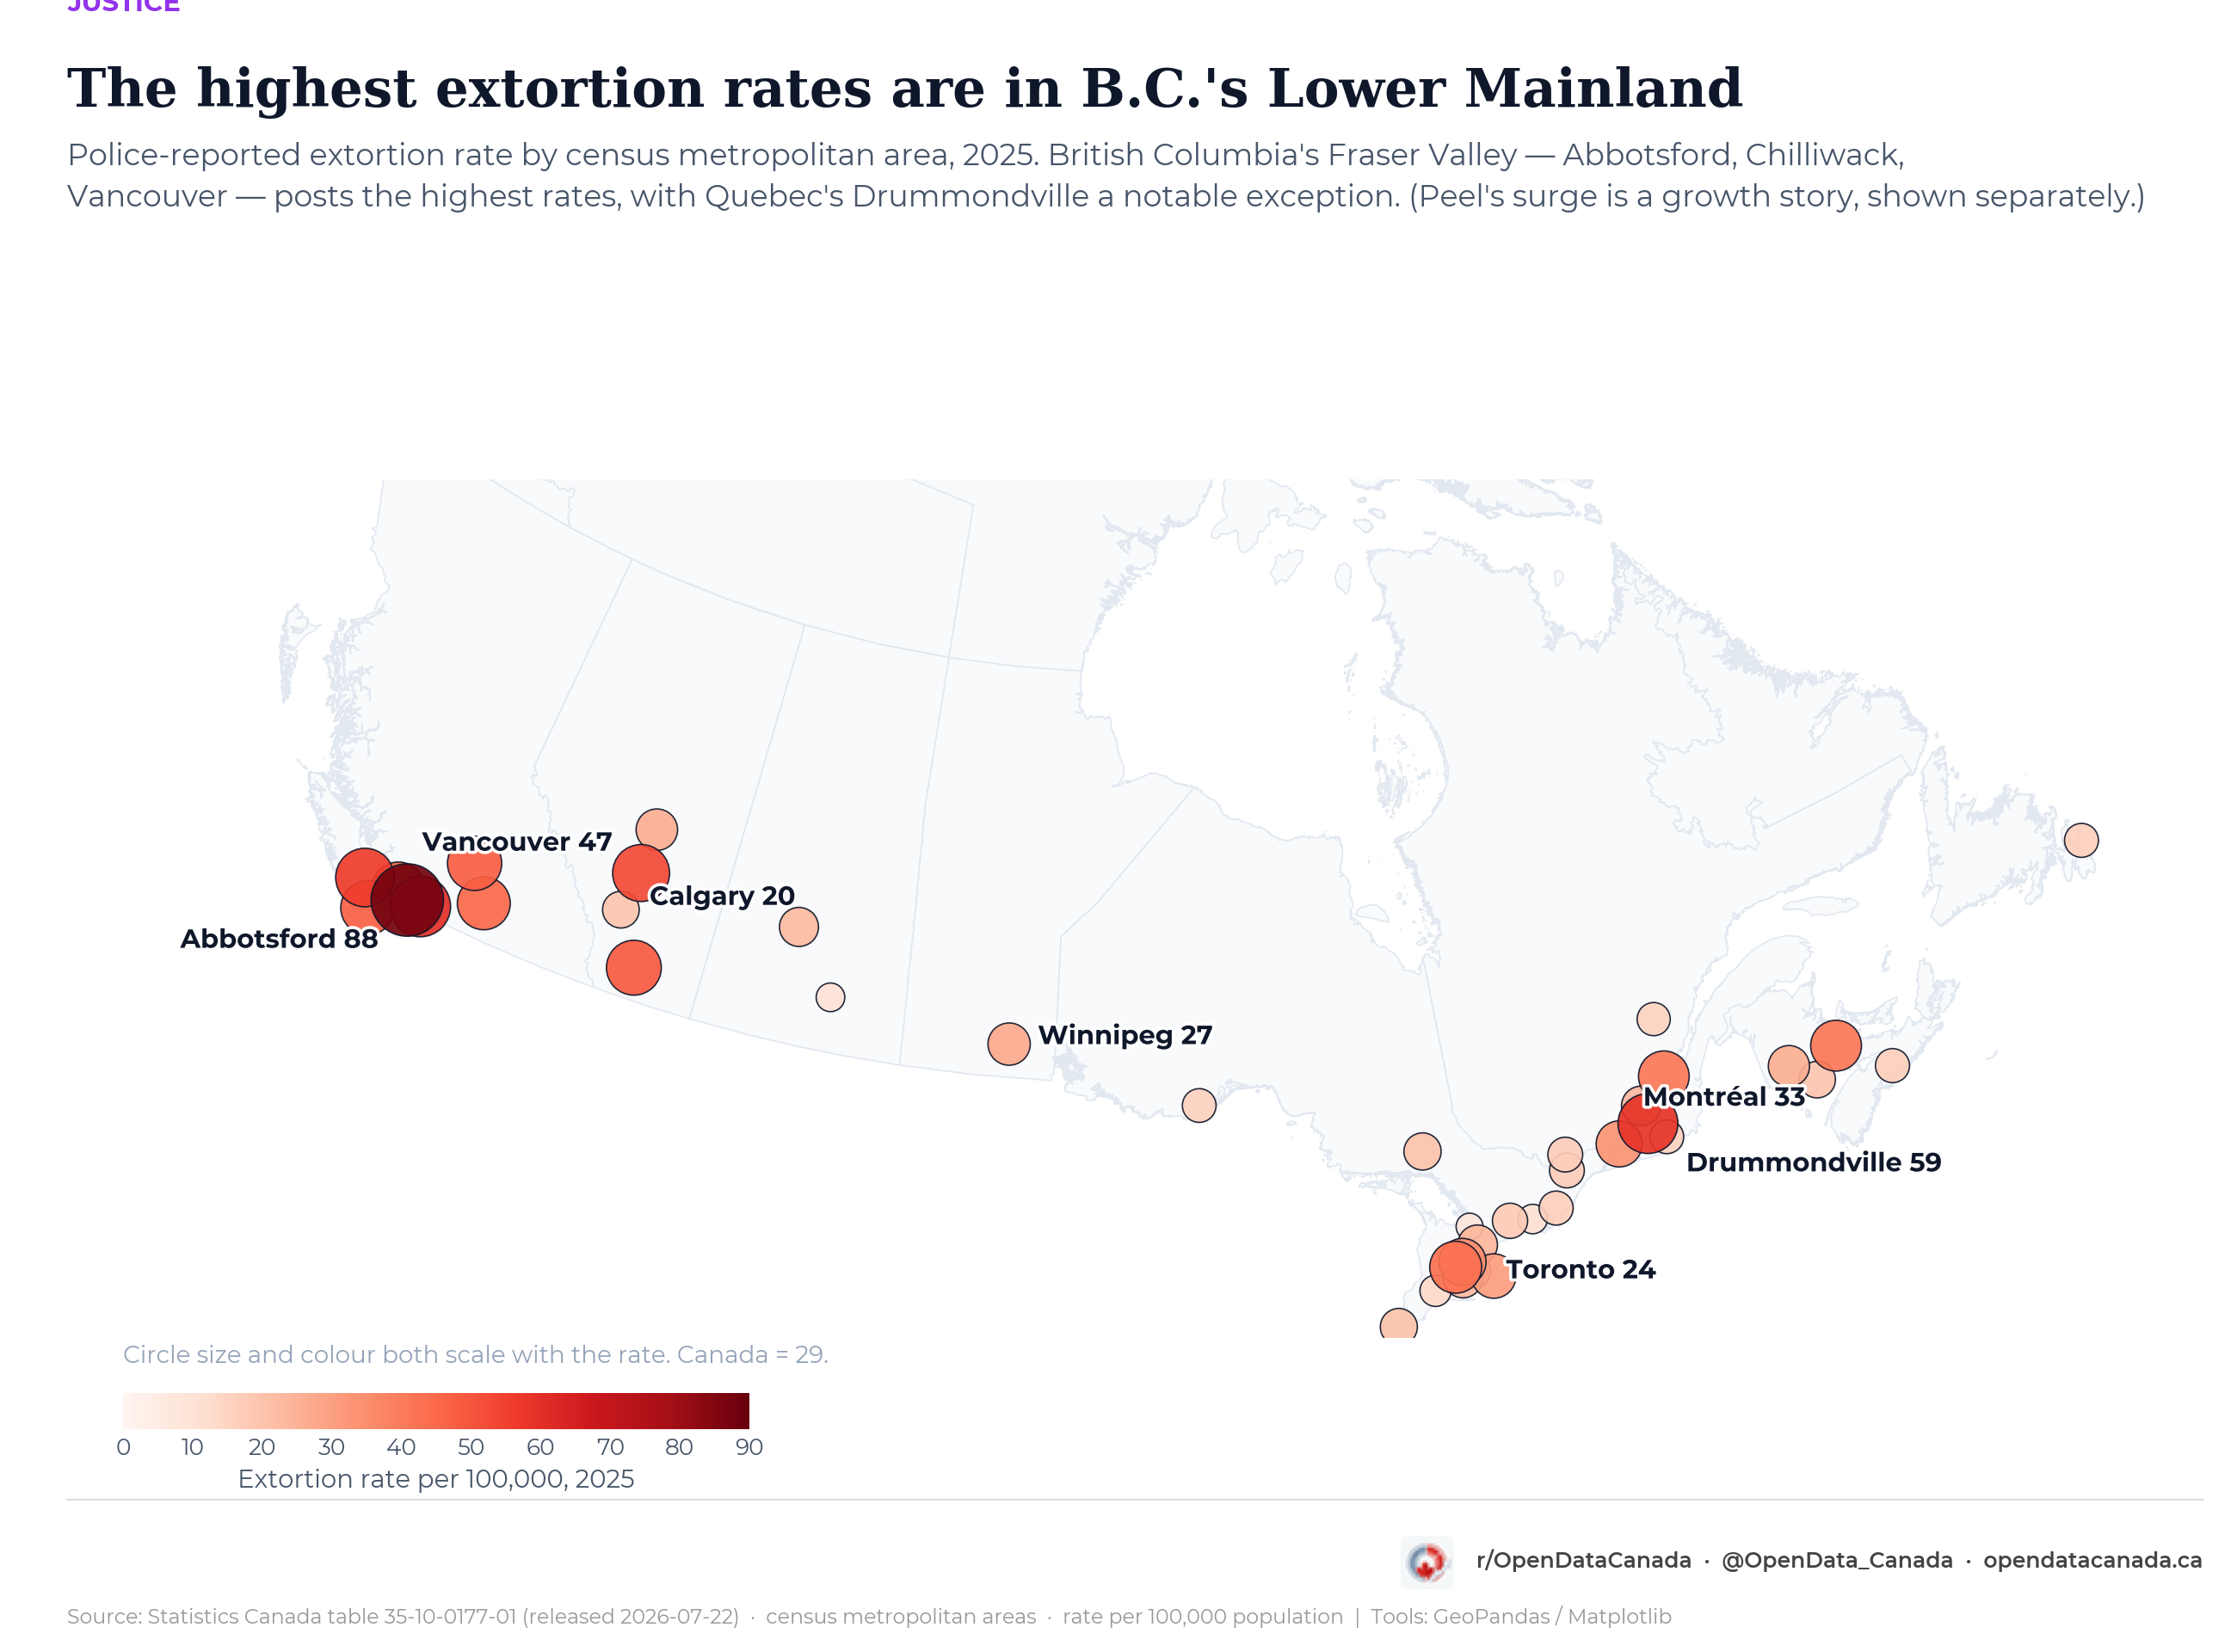
Robbery has been cut nearly in half and attempted murder sits at a 28-year low. Extortion stays piled up in B.C.'s Fraser Valley and the Mississauga–Brampton corridor.
See the article →
3 of 3
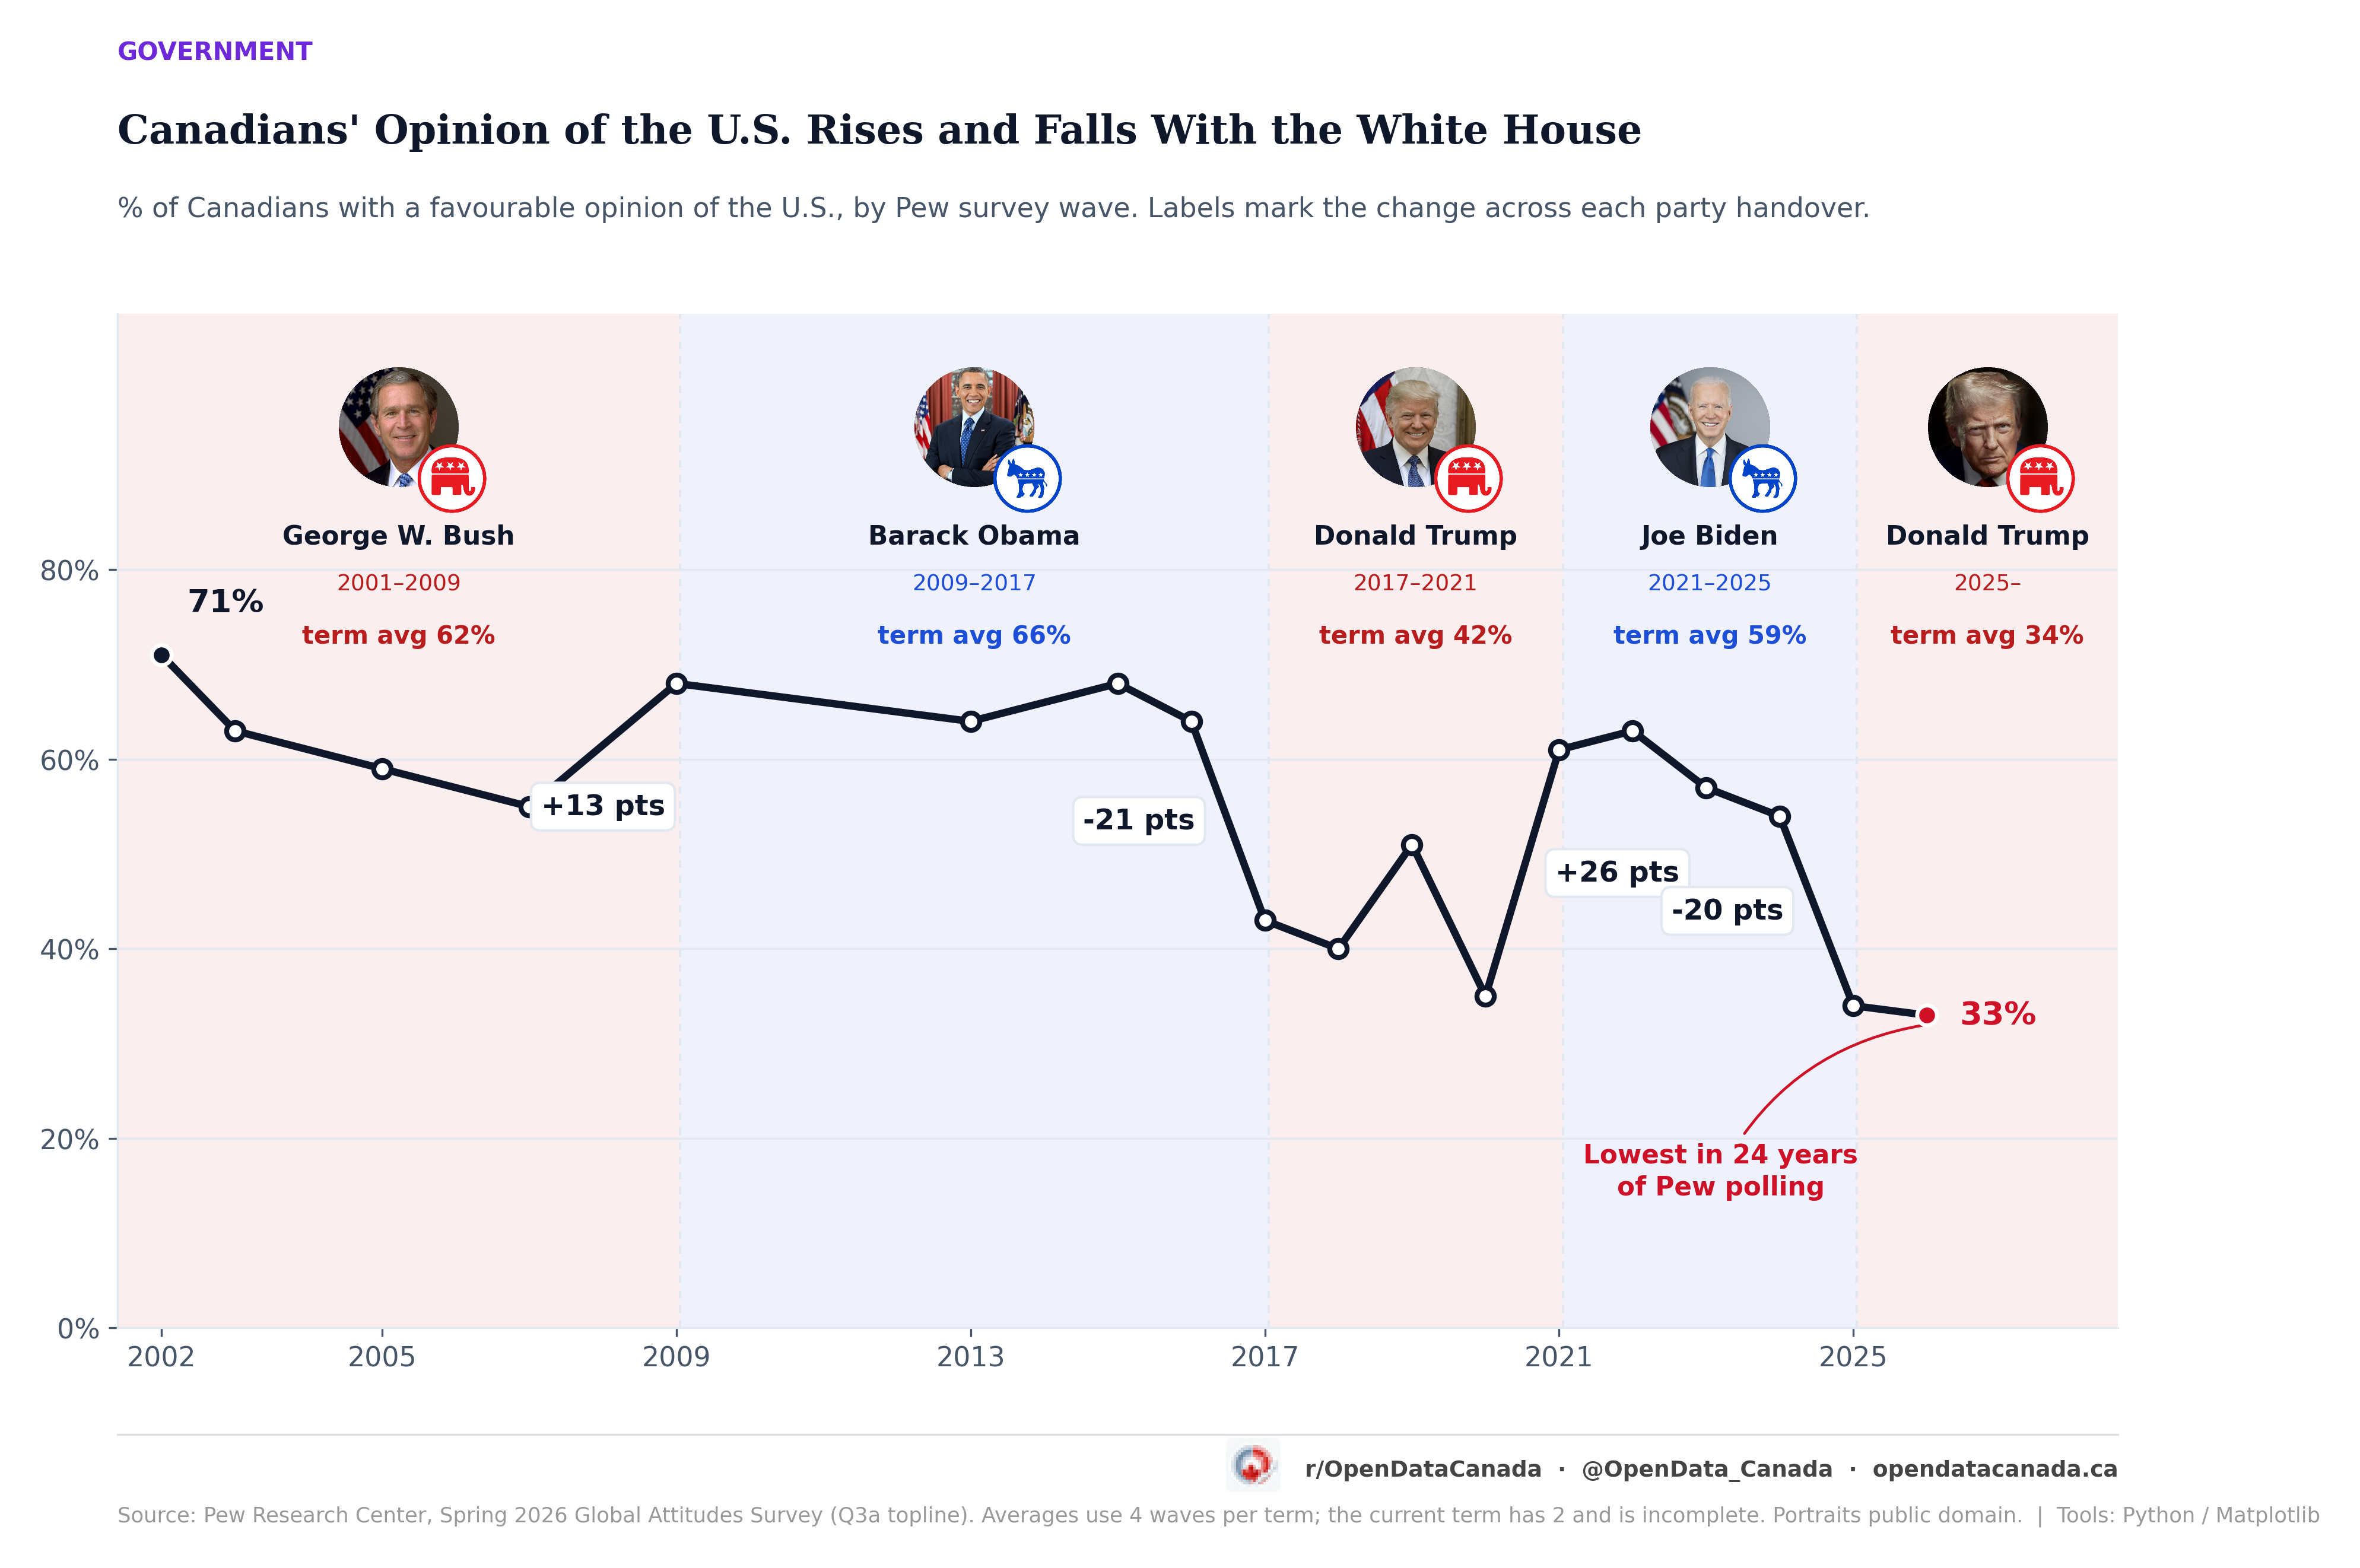
biggest shifts in Canadian opinion of the U.S. in 24 years are presidential handovers
Not wars, tariffs or trade fights. Pew's series moves 26 points at Trump to Biden and 20 the other way at Biden to Trump — more than anything else it has captured.
See the article →
112
Edmonton's 2025 transit ridership, with 2019 set to 100
The only major Canadian system above its pre-pandemic level. Vancouver sits at 87, Toronto at 79 — and in the 2026 data so far, every one of them is down year-over-year.
See the article →
13th
where soccer ranks in federal program funding, despite being Canada's most-registered sport
About 3 dollars a player, below diving and curling — while 220 million dollars went to hosting the World Cup.
See the article →
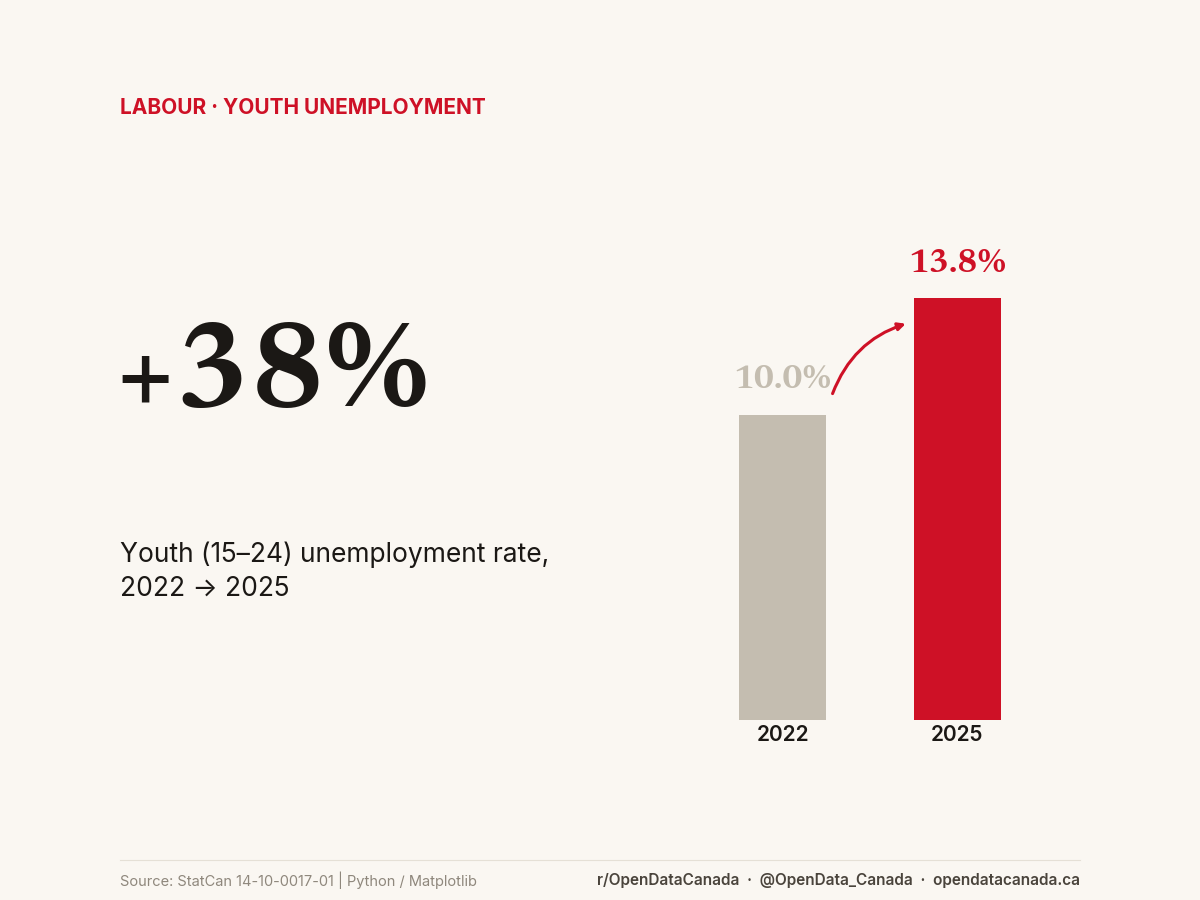
Chart: +38%, youth unemployment rate rose from 10.0% in 2022 to 13.8% in 2025, shown as two bars with an arrow marking the increase.
Labour · 3 min

Youth unemployment's biggest climb in 50 years — without a recession

Canada's youth unemployment rate rose from 10.0% in 2022 to 13.8% in 2025. We checked it against the full StatCan record back to 1976: every bigger 3-year rise in that history rode a recession. This one hasn't.

August 2026 · Statistics Canada 14-10-0017-01
Map of Canada showing provincial government hospital spending per person in 2023, with Ontario lowest at 1,967 dollars and Nova Scotia highest at 2,941 dollars.
Health · 2 min

Ontario spends the least per person on hospitals. Age doesn't explain it.

Ontario's government spent 1,967 dollars per resident on hospitals in 2023, the lowest of any province and about 974 dollars less than Nova Scotia. The obvious defence is that Ontario has a younger population. Adjusting for age barely moves the number.

July 2026 · CIHI National Health Expenditure Database
Map of every Alberta wildfire perimeter 2006 to 2024, coloured by the cause the province recorded
Environment · 6 min · Follow-up

What Alberta's wildfire cause records actually show

You asked us for an arson versus lightning breakdown of the wildfires we mapped. Only Alberta publishes one. It shows arson is a rounding error by area, 95 per cent of it a single fire, and a fifth of what Alberta maps has no cause in the province's own file — though other governments hold one for almost all of it.

July 2026 · Alberta Wildfire, NRCan, BC Wildfire Service
Proportional-symbol map of Canada showing the police-reported extortion rate by census metropolitan area in 2025, with the largest, darkest circles in British Columbia's Fraser Valley.
Justice · 5 min

Extortion has more than quadrupled in Canada since 2000 — and in Peel it has risen tenfold

Robbery has been halved and attempted murder sits at a 28-year low, but extortion has quadrupled in a generation. It has come off its 2023 national peak, yet stays concentrated in B.C.'s Fraser Valley and in Peel, where it is still climbing.

July 2026 · Statistics Canada 35-10-0177-01 & 35-10-0180-01
Line chart of Canadian favourability of the United States from 2002 to 2026, shaded by presidential term, with the change across each party handover labelled.
Government · 3 min

Canadians reprice America every time the White House changes hands

The three largest shifts Pew has recorded in Canadian opinion of the United States in 24 years are not wars or trade fights. They are the three most recent changes of president.

July 2026 · Pew Research Center
Three-panel image of a TTC Toronto Rocket subway at Union station, an Edmonton Valley Line LRT downtown, and a Montreal Metro Azur train at a station platform
Transit · 6 min

Every big Canadian city is losing transit riders again — and only Edmonton ever beat its pre-pandemic level

Six years of ridership data from the agencies' own records show one Canadian city carrying more riders than before the pandemic. Then, in 2026, every city we can measure turned down at once.

July 2026 · City open data · TransLink · TTC · Statistics Canada

Browse by category

Editorial principles

01

Public sources, primary citation

Every figure traces back to a named primary source — Statistics Canada, Health Canada, Bank of Canada, CMHC, provincial open-data portals. Table identifiers are linked on the chart page.

02

Methodology stated up front

Where a comparison depends on a definition, the definition is stated. Where the data has known limitations, those limitations appear on the chart, not in a footnote nobody reads.

03

Longform where the picture isn't the whole story

When a chart, map, or visualization needs context the picture alone can't carry, we publish a longform explainer that walks through what the numbers do and don't support.