Article · Government · 3 min read
Canadians reprice America every time the White House changes hands
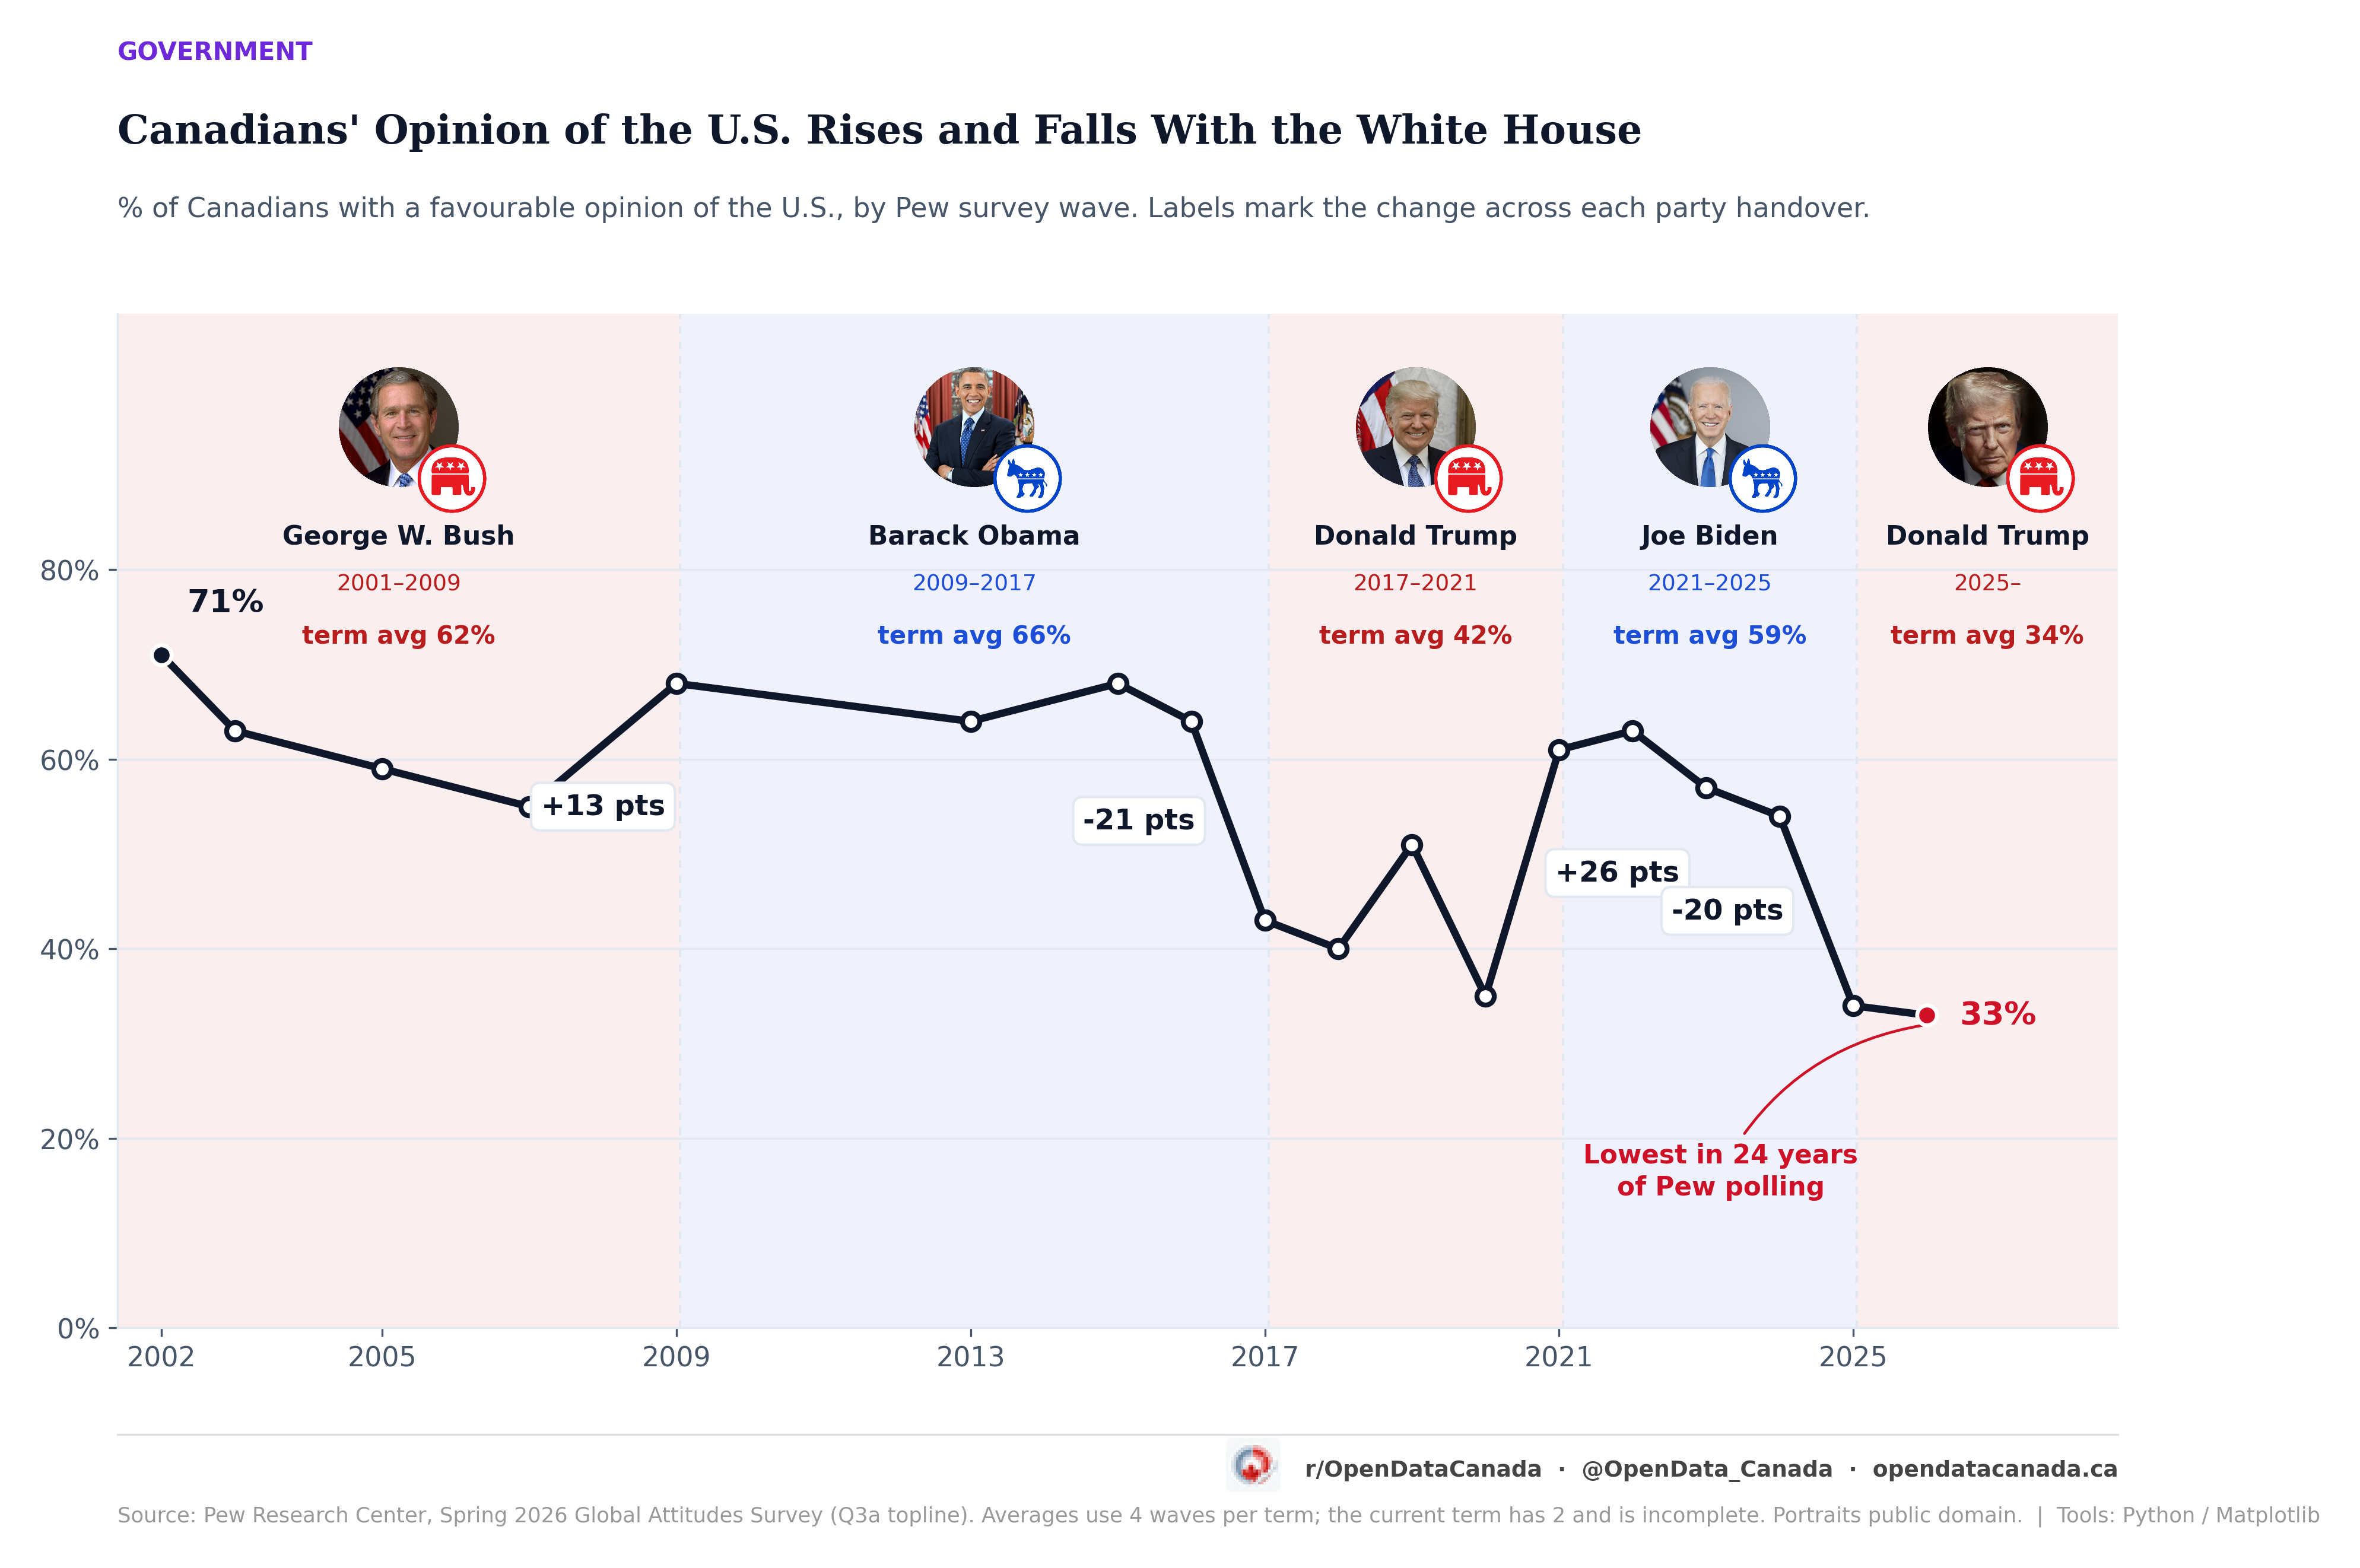
The three largest shifts Pew has recorded in Canadian opinion of the United States in 24 years are not wars, tariffs or trade fights. They are the three most recent changes of president. Canadian regard for the U.S. moves more across a handover than it does across anything else the series has captured.
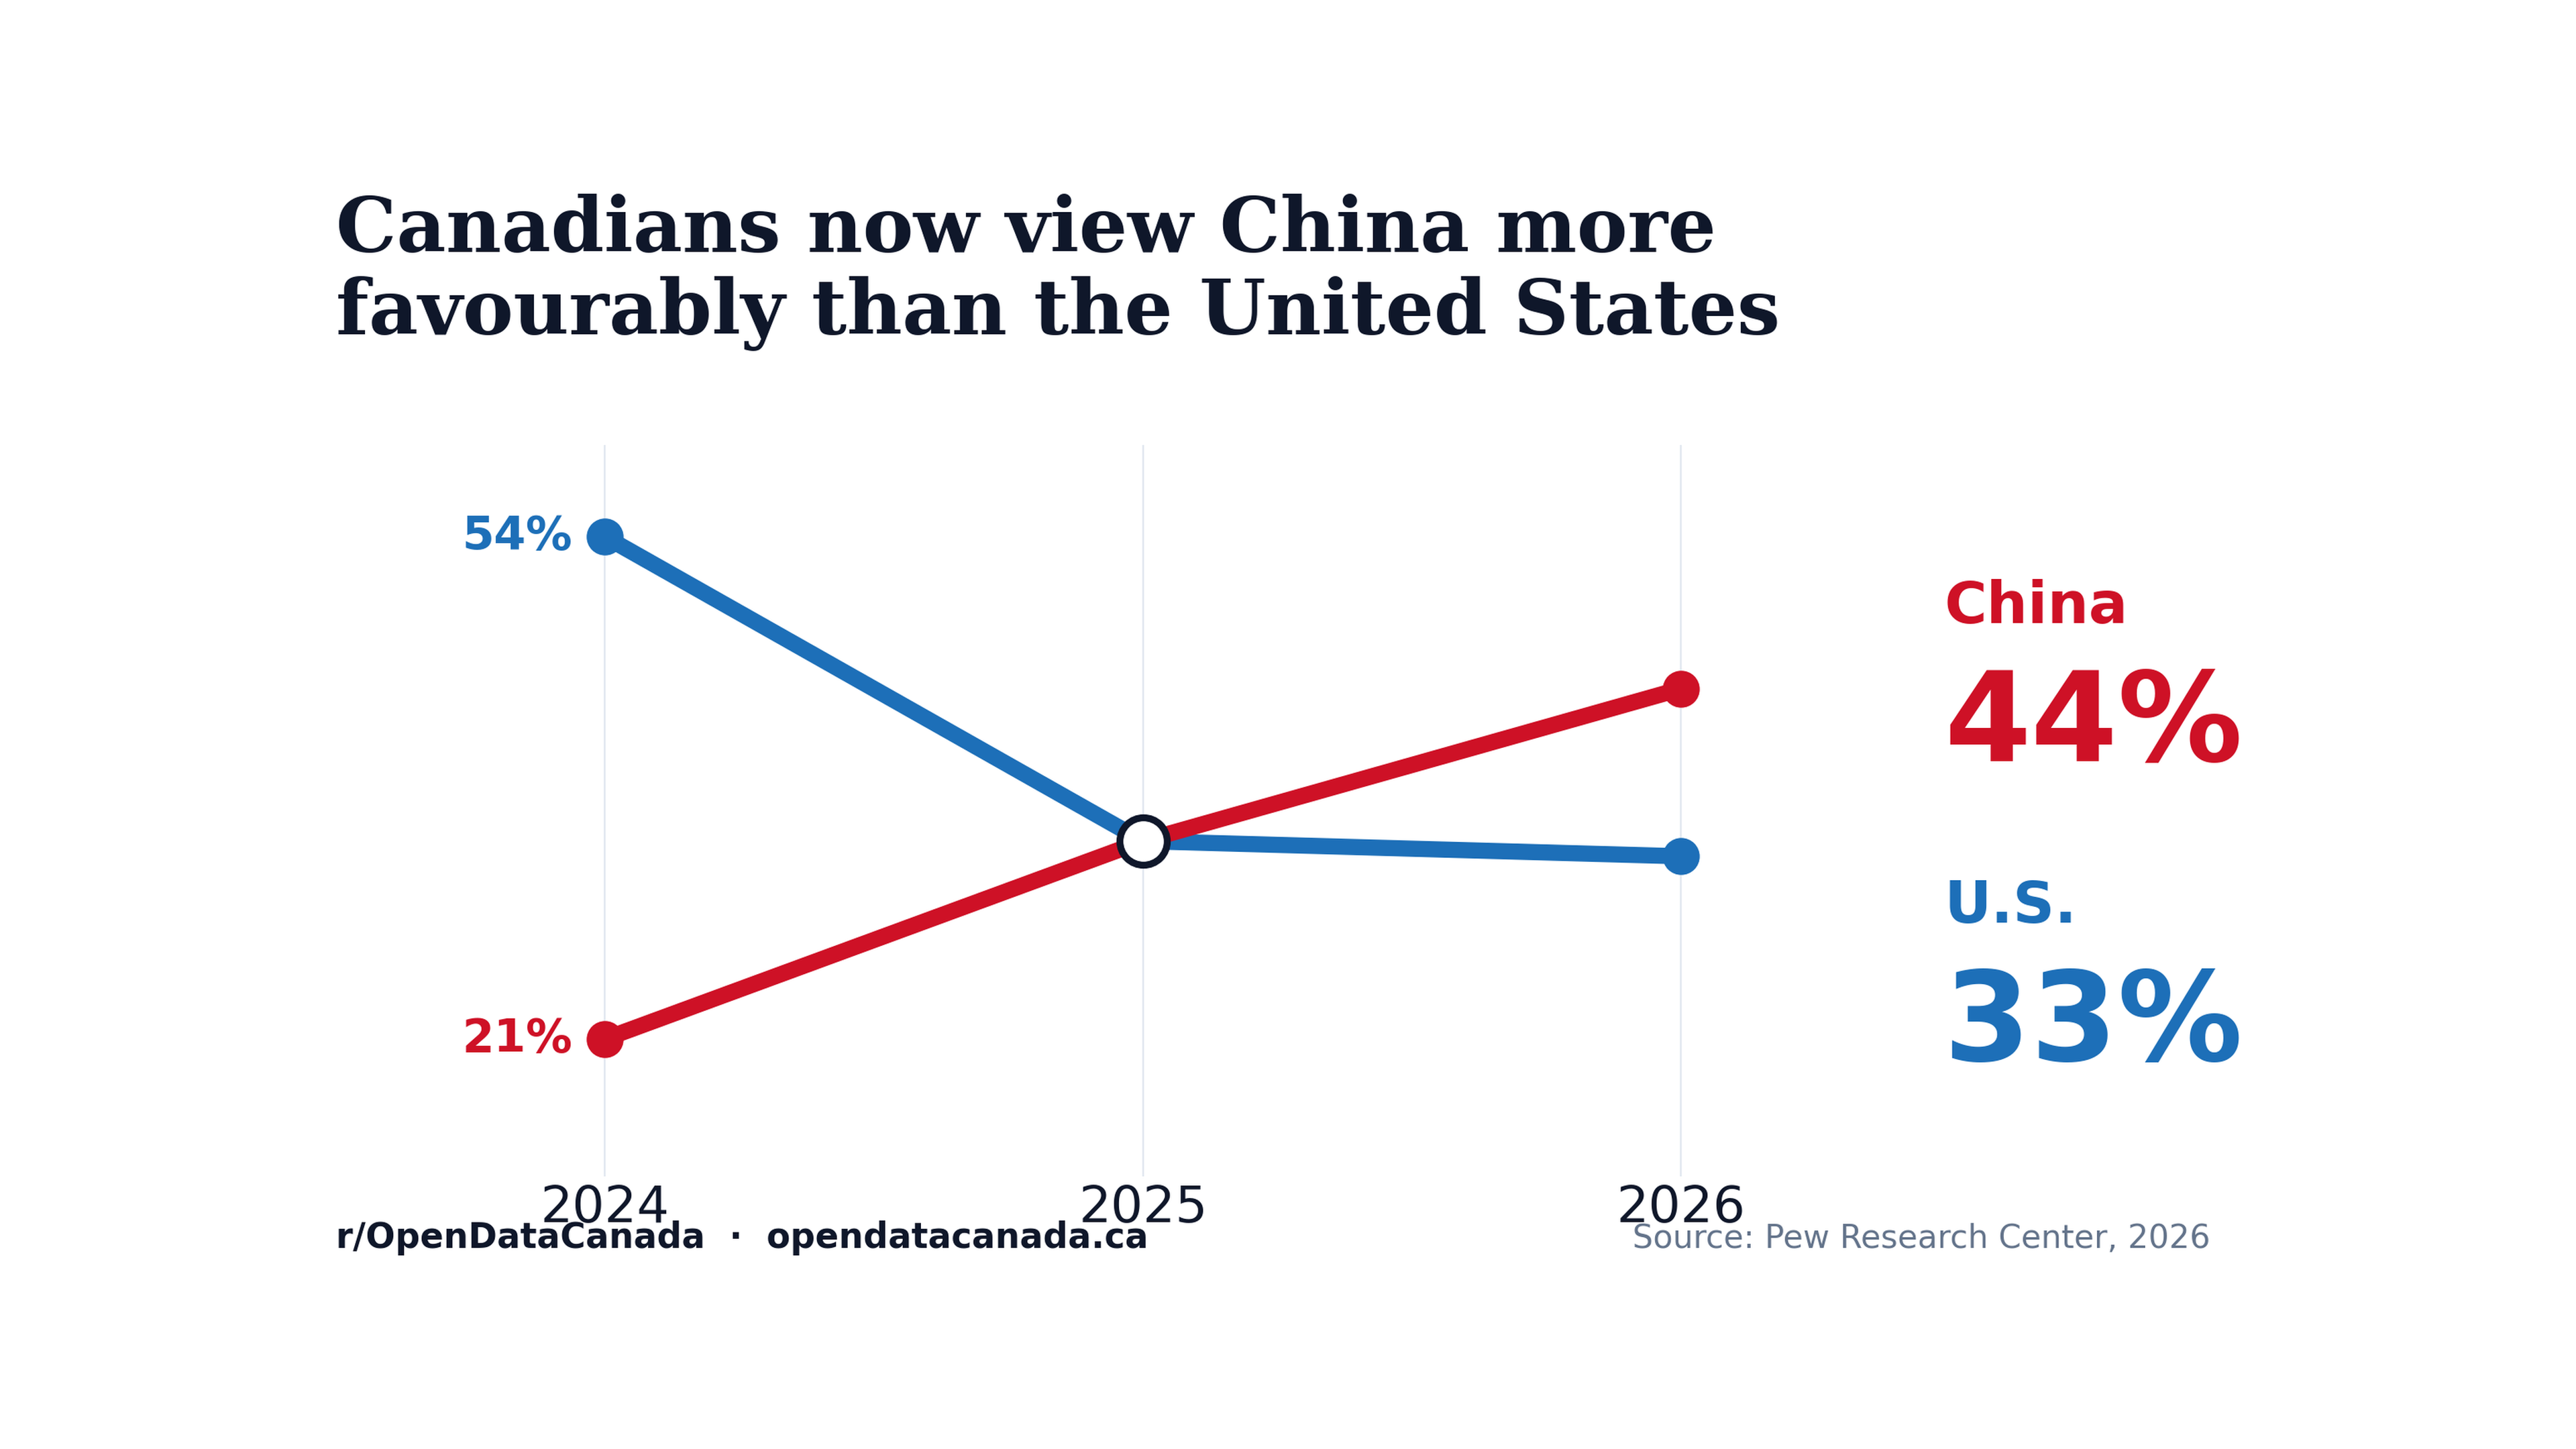
Last week we reported that Canadians now rate China above the United States for only the second time on record. That piece looked across two countries. This one looks back across five presidencies, using the full Pew series for Canada, which runs to 2002.
Sorted by size, the largest wave-to-wave movements in that series are these:
| Handover | Last wave before | First wave after | Change |
|---|---|---|---|
| Trump I → Biden | 35% (2020) | 61% (2021) | +26 |
| Obama → Trump I | 64% (2016) | 43% (2017) | −21 |
| Biden → Trump II | 54% (2024) | 34% (2025) | −20 |
| Bush → Obama | 55% (2007) | 68% (2009) | +13 |
Every party handover Pew has straddled in Canada sits in the top five movements of the series. Nothing else comes close except the summer of 2020, when favourability fell 16 points inside Trump's first term. Set the handovers and that 2020 wave aside and the typical move between consecutive waves is four points; the largest is eleven.
What this does not show
It is tempting to read the chart as opinion turning on inauguration day. The data cannot support that, and the reason is a gap in the calendar rather than anything about Canadians.
Pew fields its global survey in the spring. A U.S. president is inaugurated on 20 January. That means no Pew wave has ever landed between a November election and the January inauguration that follows it. Each of those 20-point drops therefore spans the election, the transition and the first months of the new administration in a single interval. The survey was not in the field in between.
So the defensible claim is that Canadian opinion of the United States resets across a change of president. Whether the result itself did the work, or the first months of governing, is something this series cannot separate.
The levels, not just the moves
Averaged across the waves fielded during each presidency, the ordering is clean: Obama 66 percent, Bush 62, Biden 59, Trump's first term 42, and his second term 34 so far. The gap between the highest and lowest presidential average is 32 points, wider than any single-term swing.
Two cautions on those averages. Each rests on four Pew waves except the current term, which has two and is not finished. And they are unweighted means of the waves that exist, not time-weighted averages of the terms.
This is not only about mood. The same topline carries a second question, on whether the U.S. government respects the personal freedoms of its people, and it tracks the same shape. Three-quarters of Canadians said yes in 2013. That was 57 percent by 2016, 45 percent in 2017, and 38 percent in 2018. It recovered to 60 percent in 2021. It is 34 percent now, the lowest reading Pew has recorded in Canada on that question.
Read that one carefully, though. Pew fields it only occasionally. Three of its wave-to-wave intervals do straddle a change of president, but only the 2016-to-2017 pair sits in adjacent years. The other two span three years and five years, so the movement across them cannot be pinned to any single moment.
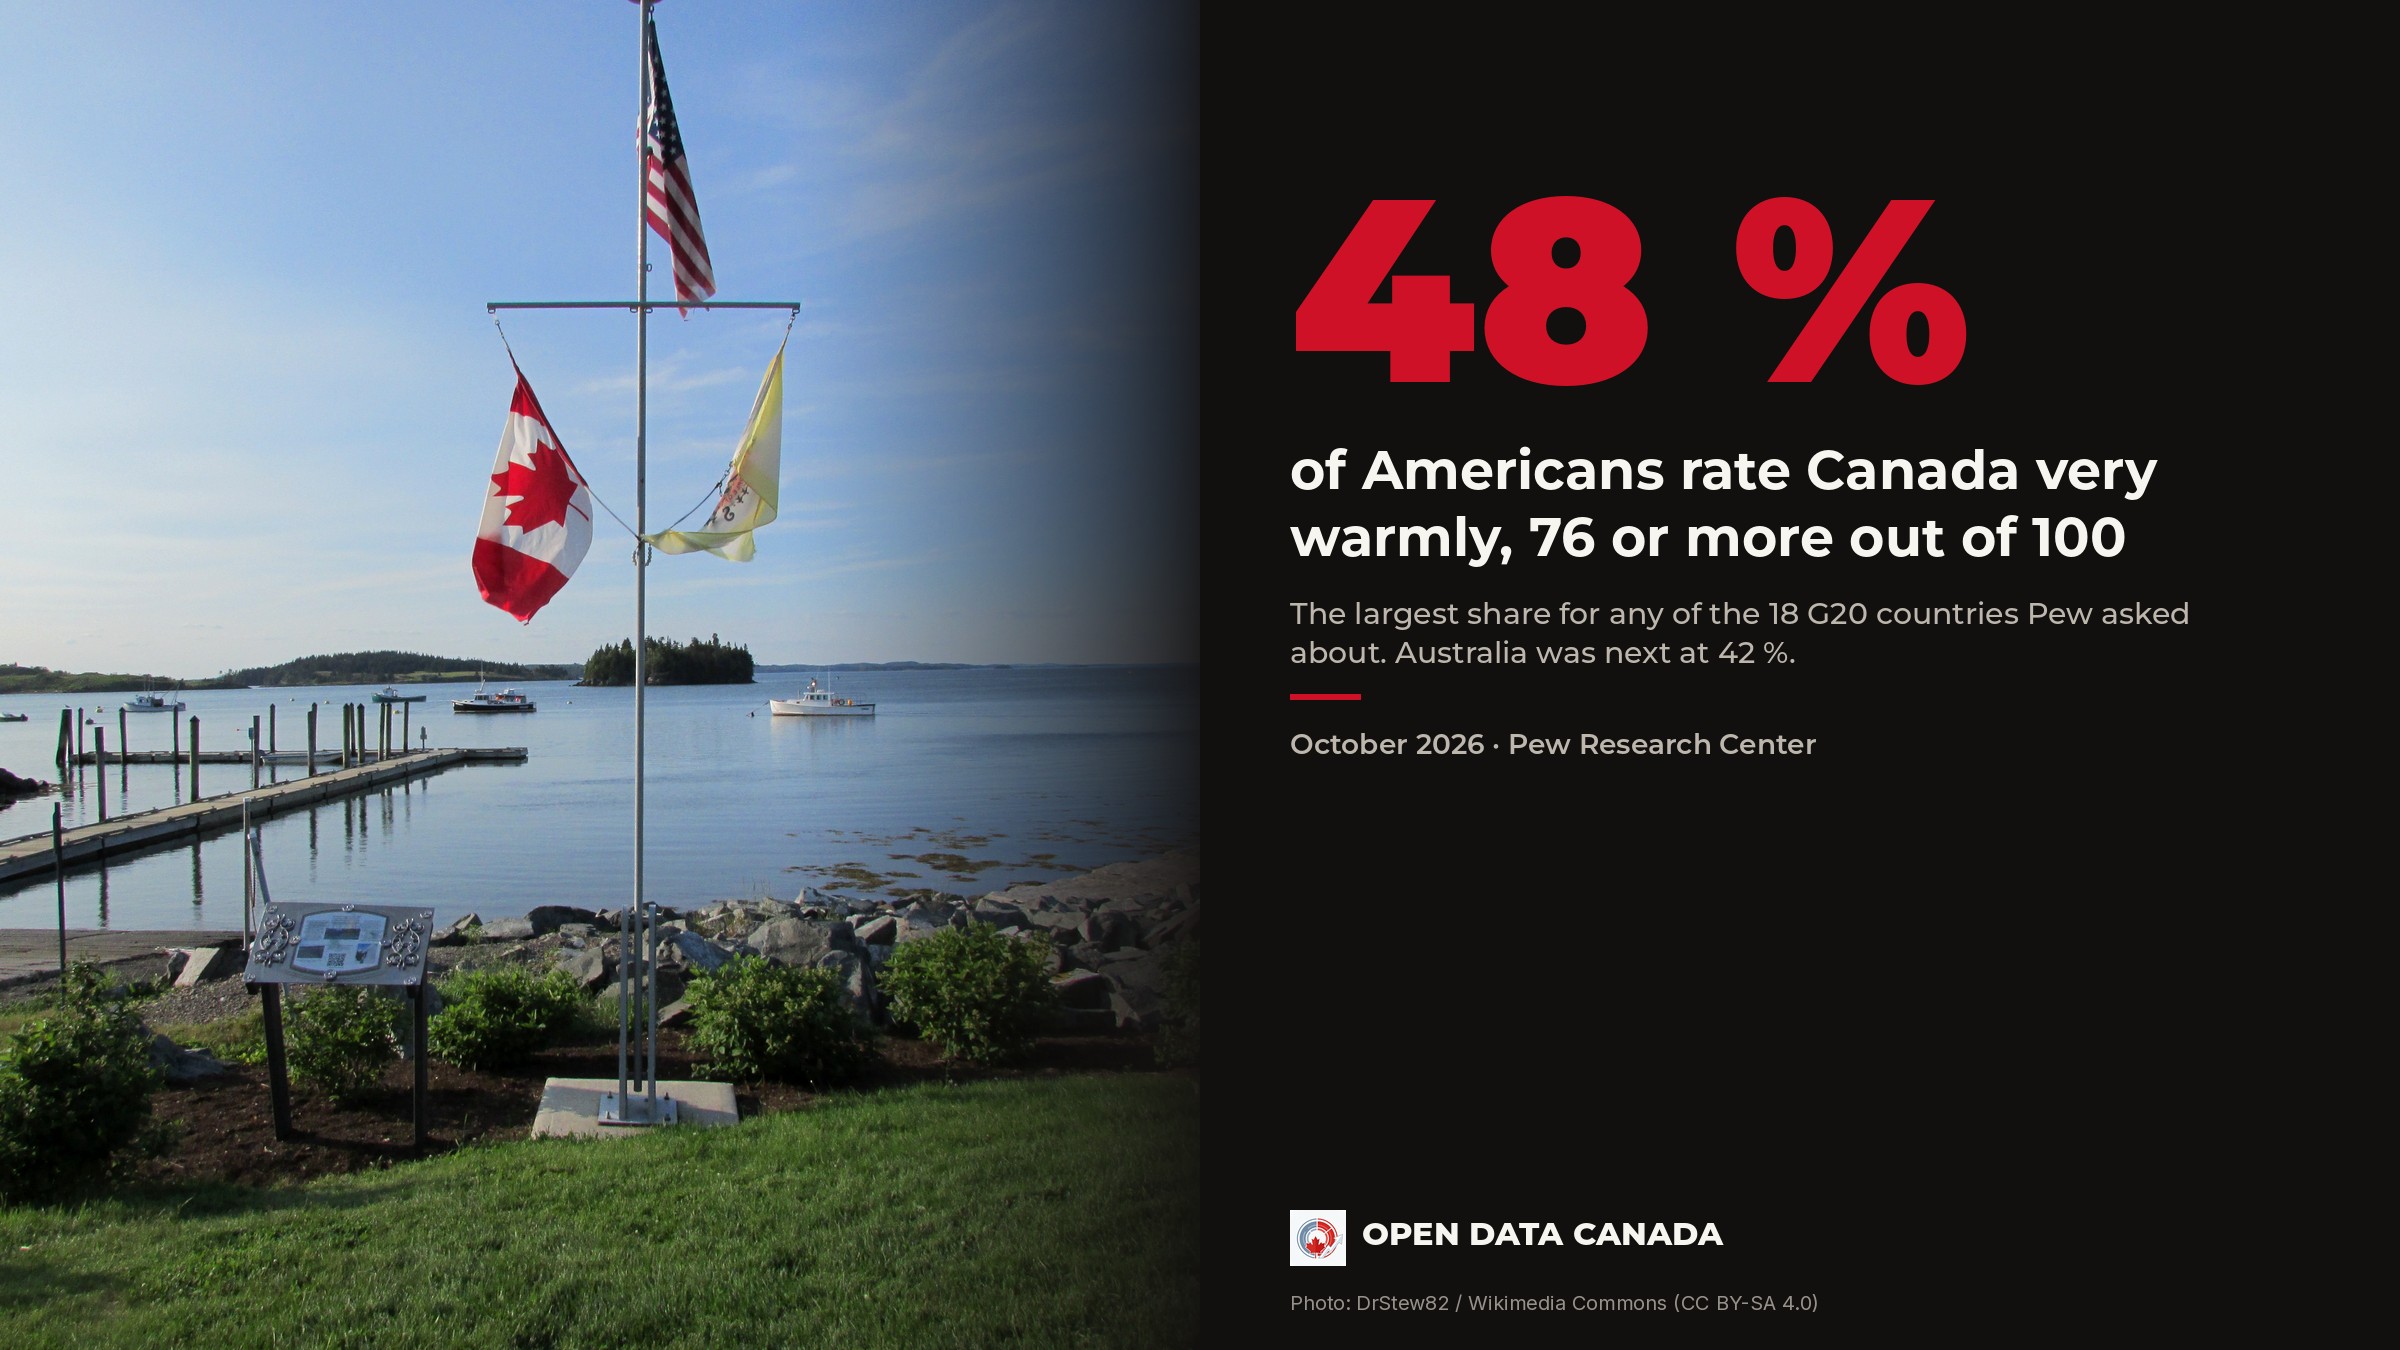
The feeling has not run the other way. In a September 2026 Pew survey, Americans still rated Canada joint-warmest of 18 G20 countries, though fewer Republicans rate it warmly than in 2018.
Methodology. All figures are Pew Research Center's published total-favourable percentages for Canada, read from the Spring 2026 Global Attitudes Survey topline (Q3a, "opinion of the United States"), released 23 June 2026. The full Canadian series covers 18 waves: 2002, 2003, 2005, 2007, 2009, 2013, and every year from 2015 to 2026. Pew did not field the survey in Canada in 2004, 2006, 2008, 2010 through 2012, or 2014, so the chart connects the waves that exist and the Bush-to-Obama comparison spans 2007 to 2009. The 2020 wave was fielded in summer rather than spring; the 2003 wave in May. Waves are assigned to the president in office on the field date. Term averages are unweighted means of the waves within each presidency. Survey estimates of this kind carry sampling margins of a few points, so differences of one or two points should not be read as movement. The association between handovers and opinion shifts is a correlation the survey establishes; the chart does not establish a cause. The personal-freedoms figures are Q29b from the same topline ("Do you think the government of the United States respects the personal freedoms of its people"), Canada rows, fielded in 2013, 2015, 2016, 2017, 2018, 2021 and 2026 only.
Presidential portraits. Official presidential portraits, public domain, via Wikimedia Commons.