Economy · U.S.-Canada trade
US exports to Canada by state: which states sell Canada the most
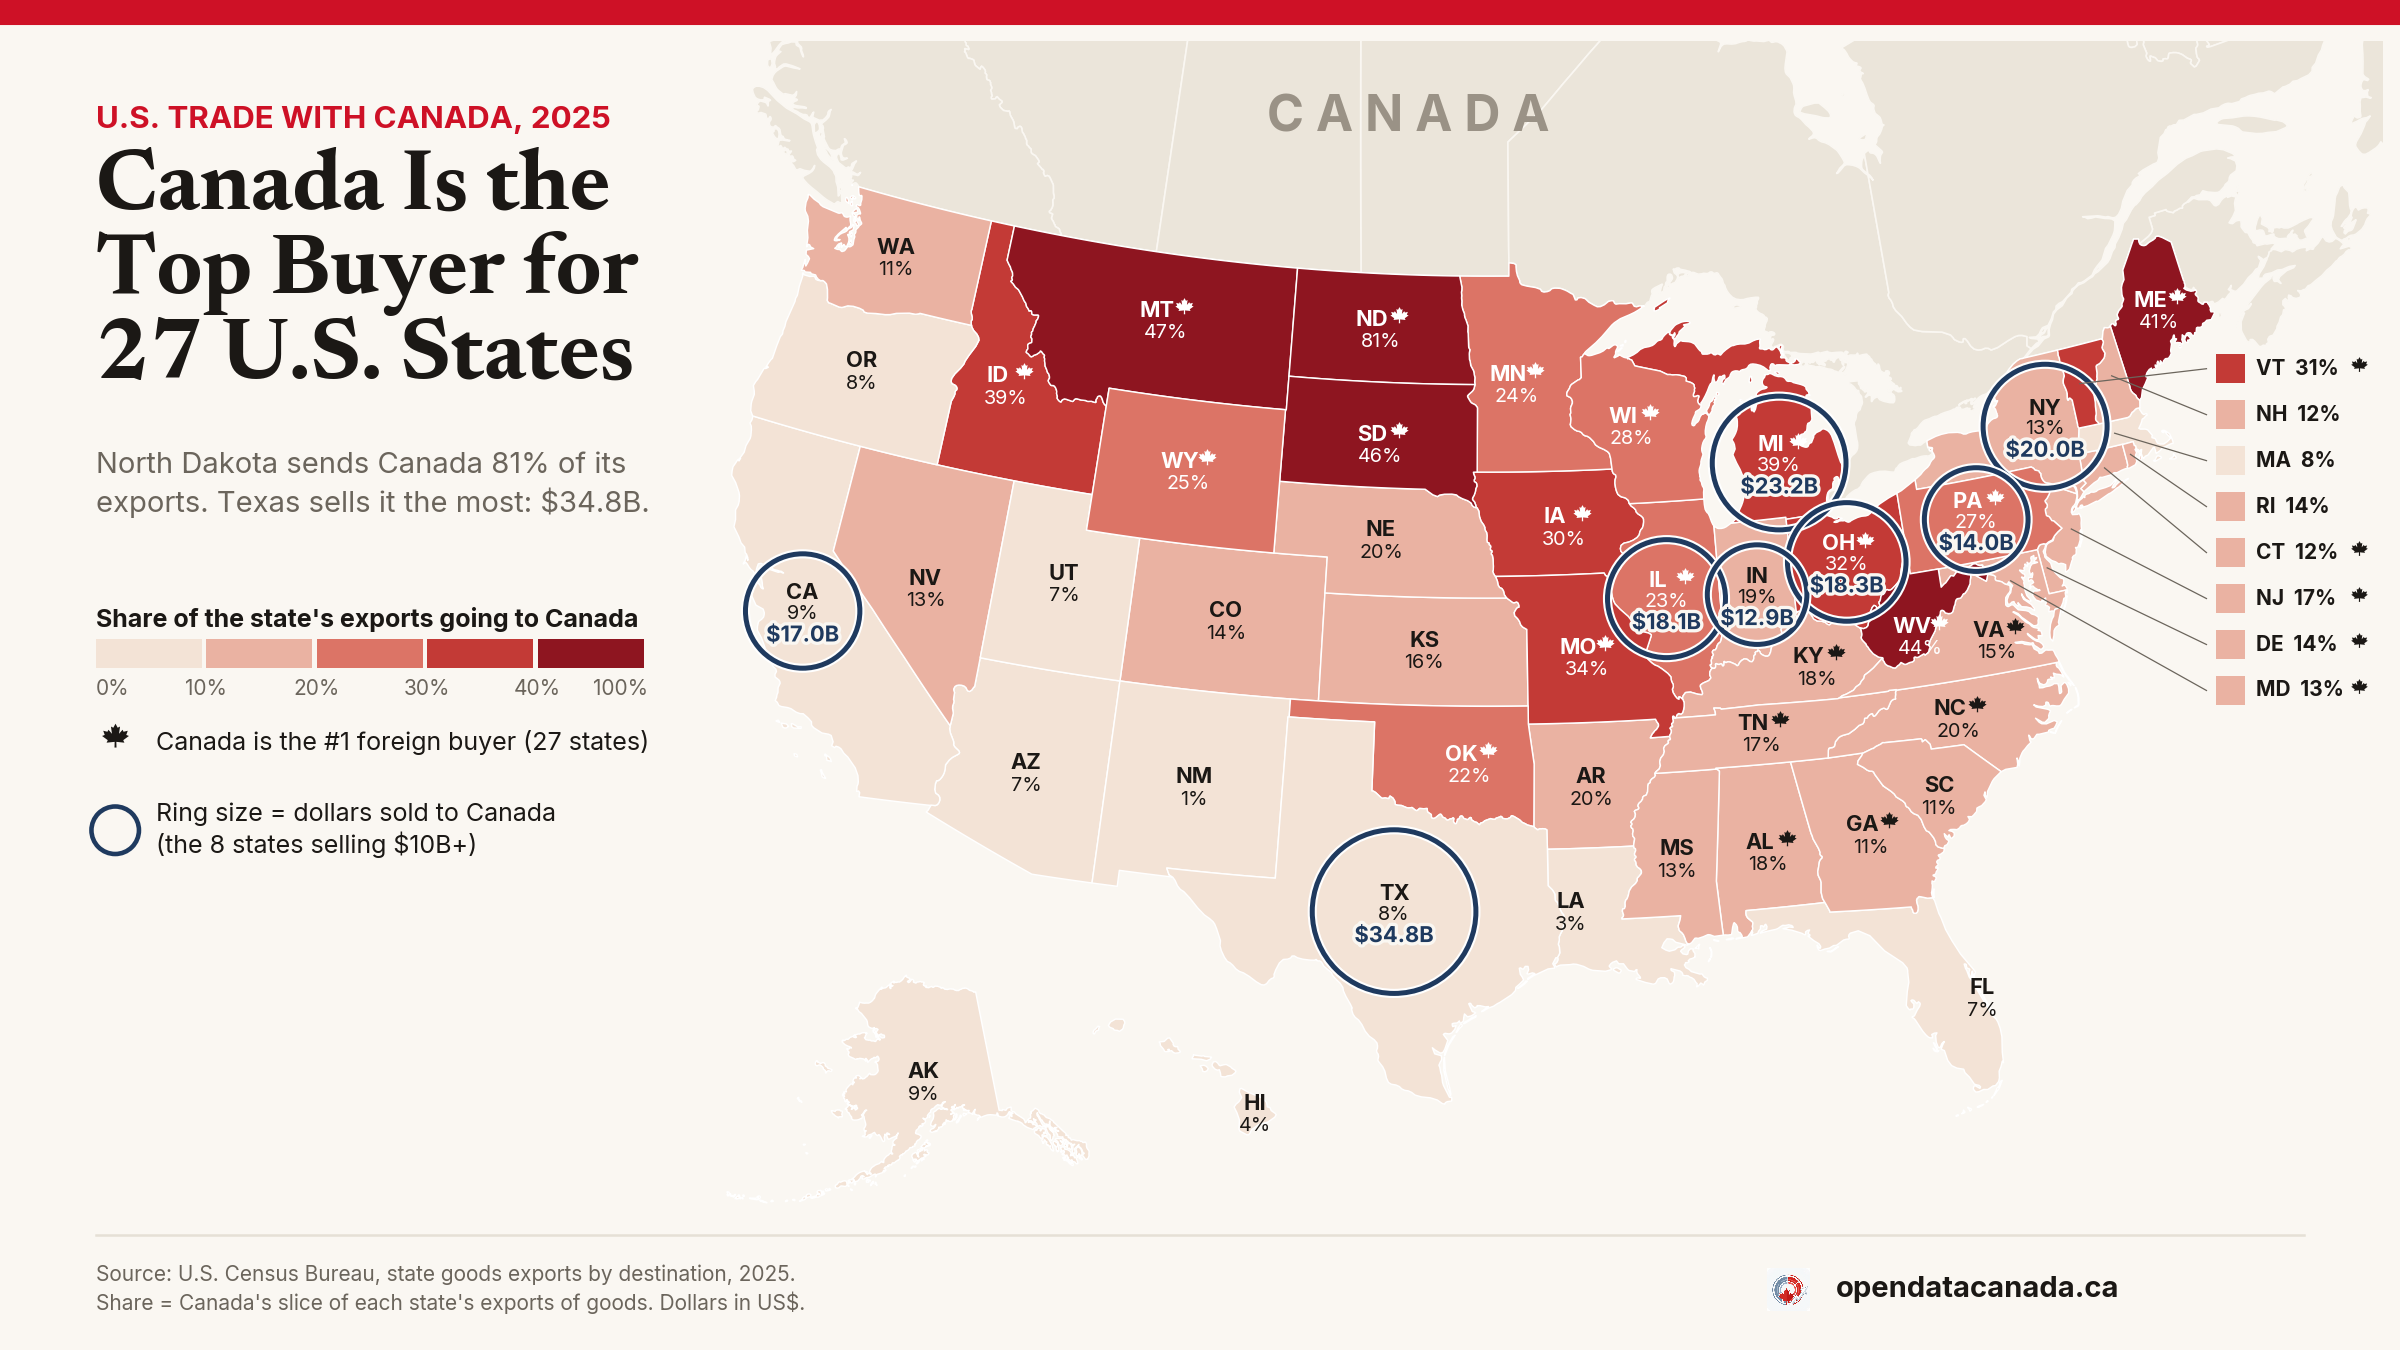
Texas sells Canada the most: 34.8 billion U.S. dollars in 2025. North Dakota depends on Canada most: Canada buys 81% of what the state exports. For 27 of the 50 states, Canada is the biggest foreign customer.
The U.S. sold Canada 334 billion U.S. dollars of goods in 2025, down 4.8% from 2024. Which states trade the most with Canada depends on how you count: total dollars, or the share of each state's exports that goes to Canada.
Which U.S. states export the most to Canada
Texas leads with 34.8 billion U.S. dollars in 2025, led by crude oil (7.3 billion), but that is only 8% of what Texas exports, and Mexico is a bigger buyer. Michigan is next at 23.2 billion, then New York (20.0), Ohio (18.3), Illinois (18.1), California (17.0), Pennsylvania (14.0) and Indiana (12.9). New York's figure includes a Census estimate of 6.9 billion U.S. dollars for small and late-reported shipments; gold is its top named product.
Which states depend most on Canada
North Dakota sends 81% of its exports to Canada, led by refined fuels. Montana is at 47%, South Dakota 46%, West Virginia 44% and Maine 41%. Most are small exporters, and three of the five border Canada.
Canada is the top foreign buyer for 27 states, including large ones such as Michigan, Ohio, Illinois and Pennsylvania. It ranks second in 15 more states and third or lower in the other eight, such as Hawaii (8th) and Louisiana (12th).
Trade fell in 2025
U.S. goods exports to Canada fell 4.8% from 2024 to 2025, from 351 billion to 334 billion U.S. dollars. Oregon (-31%), Minnesota (-29%) and New Hampshire (-27%) saw the biggest drops. North Dakota (+36%) and Wyoming (+20%) rose; refined fuels are the top export to Canada for both.
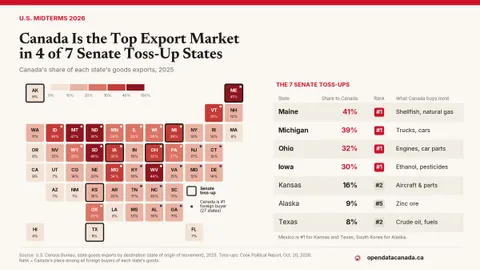
Four of the seven states the Cook Political Report rates as Senate toss-ups are among those where Canada is the top buyer. We cover that in Canada is the top export market in 4 of 7 Senate toss-up states.
US exports to Canada by state: all 50 ranked
Ranked by goods exported to Canada in 2025. Rank is Canada's place among all foreign buyers of the state's goods.
| State | Exports to Canada (US$ billions) | Share of exports | Canada's rank among buyers | Top product | Change, 2024 to 2025 |
|---|---|---|---|---|---|
| Texas | 34.8 | 8% | #2 | Crude oil | -7% |
| Michigan | 23.2 | 39% | #1 | Trucks | -6% |
| New York | 20.0 | 13% | #2 | Gold | -2% |
| Ohio | 18.3 | 32% | #1 | Engines | -12% |
| Illinois | 18.1 | 23% | #1 | Refined fuels | -14% |
| California | 17.0 | 9% | #2 | Computers | -13% |
| Pennsylvania | 14.0 | 27% | #1 | Phones and network gear | -6% |
| Indiana | 12.9 | 19% | #2 | Car parts | -10% |
| Kentucky | 9.4 | 18% | #1 | Trucks | -2% |
| North Carolina | 8.7 | 20% | #1 | Medicines | -3% |
| Wisconsin | 7.6 | 28% | #1 | Plastic sheet and film | -8% |
| New Jersey | 7.4 | 17% | #1 | Platinum | -14% |
| Washington | 7.1 | 11% | #2 | Aircraft and parts | -14% |
| North Dakota | 7.0 | 81% | #1 | Refined fuels | +36% |
| Georgia | 6.9 | 11% | #1 | Aircraft and parts | -12% |
| Missouri | 6.7 | 34% | #1 | Trucks | +2% |
| Tennessee | 6.5 | 17% | #1 | Cars | -18% |
| Minnesota | 5.6 | 24% | #1 | Refined fuels | -29% |
| Florida | 5.6 | 7% | #2 | Aircraft and parts | +2% |
| Iowa | 5.0 | 30% | #1 | Ethanol | -6% |
| Alabama | 4.3 | 18% | #1 | Cars | -6% |
| South Carolina | 4.1 | 11% | #3 | Cars | -5% |
| Louisiana | 3.2 | 3% | #12 | Refined fuels | -24% |
| Massachusetts | 3.2 | 8% | #2 | Computers | +1% |
| Arizona | 3.0 | 7% | #3 | Aircraft and parts | +1% |
| Virginia | 3.0 | 15% | #1 | Tractors | -15% |
| Kansas | 2.4 | 16% | #2 | Aircraft and parts | -11% |
| Oregon | 2.3 | 8% | #4 | Nuts | -31% |
| Connecticut | 2.2 | 12% | #1 | Aircraft and parts | -9% |
| Maryland | 2.2 | 13% | #1 | Bulldozers and graders | -5% |
| West Virginia | 2.0 | 44% | #1 | Engines | +3% |
| Mississippi | 1.8 | 13% | #2 | Cars | -15% |
| Idaho | 1.8 | 39% | #1 | Lead ore | +7% |
| Oklahoma | 1.7 | 22% | #1 | Buses | -12% |
| Nevada | 1.6 | 13% | #2 | Copper ore | -9% |
| Colorado | 1.6 | 14% | #2 | Beef | -5% |
| Nebraska | 1.5 | 20% | #2 | Harvesters | -7% |
| Utah | 1.5 | 7% | #3 | Gold | +3% |
| Maine | 1.3 | 41% | #1 | Shellfish | -2% |
| Arkansas | 1.3 | 20% | #2 | Rice | -14% |
| Montana | 1.0 | 47% | #1 | Live cattle | +10% |
| New Hampshire | 0.9 | 12% | #2 | Aircraft and parts | -27% |
| South Dakota | 0.9 | 46% | #1 | Ethanol | -13% |
| Delaware | 0.8 | 14% | #1 | Medicines | -7% |
| Vermont | 0.6 | 31% | #1 | Chocolate | -5% |
| Alaska | 0.6 | 9% | #5 | Zinc ore | +3% |
| Rhode Island | 0.6 | 14% | #2 | Precious-metal scrap | +13% |
| Wyoming | 0.5 | 25% | #1 | Refined fuels | +20% |
| New Mexico | 0.2 | 1% | #7 | Potash fertilizer | +5% |
| Hawaii | under 0.1 | 4% | #8 | Citrus fruit | -7% |
Related: Canada is the top export market in 4 of 7 Senate toss-up states · Canada's exports by country and product · How Americans feel about Canada in 2026