
Transit · Chart
Toronto's subway follows a grid; Montréal's is far less grid-like
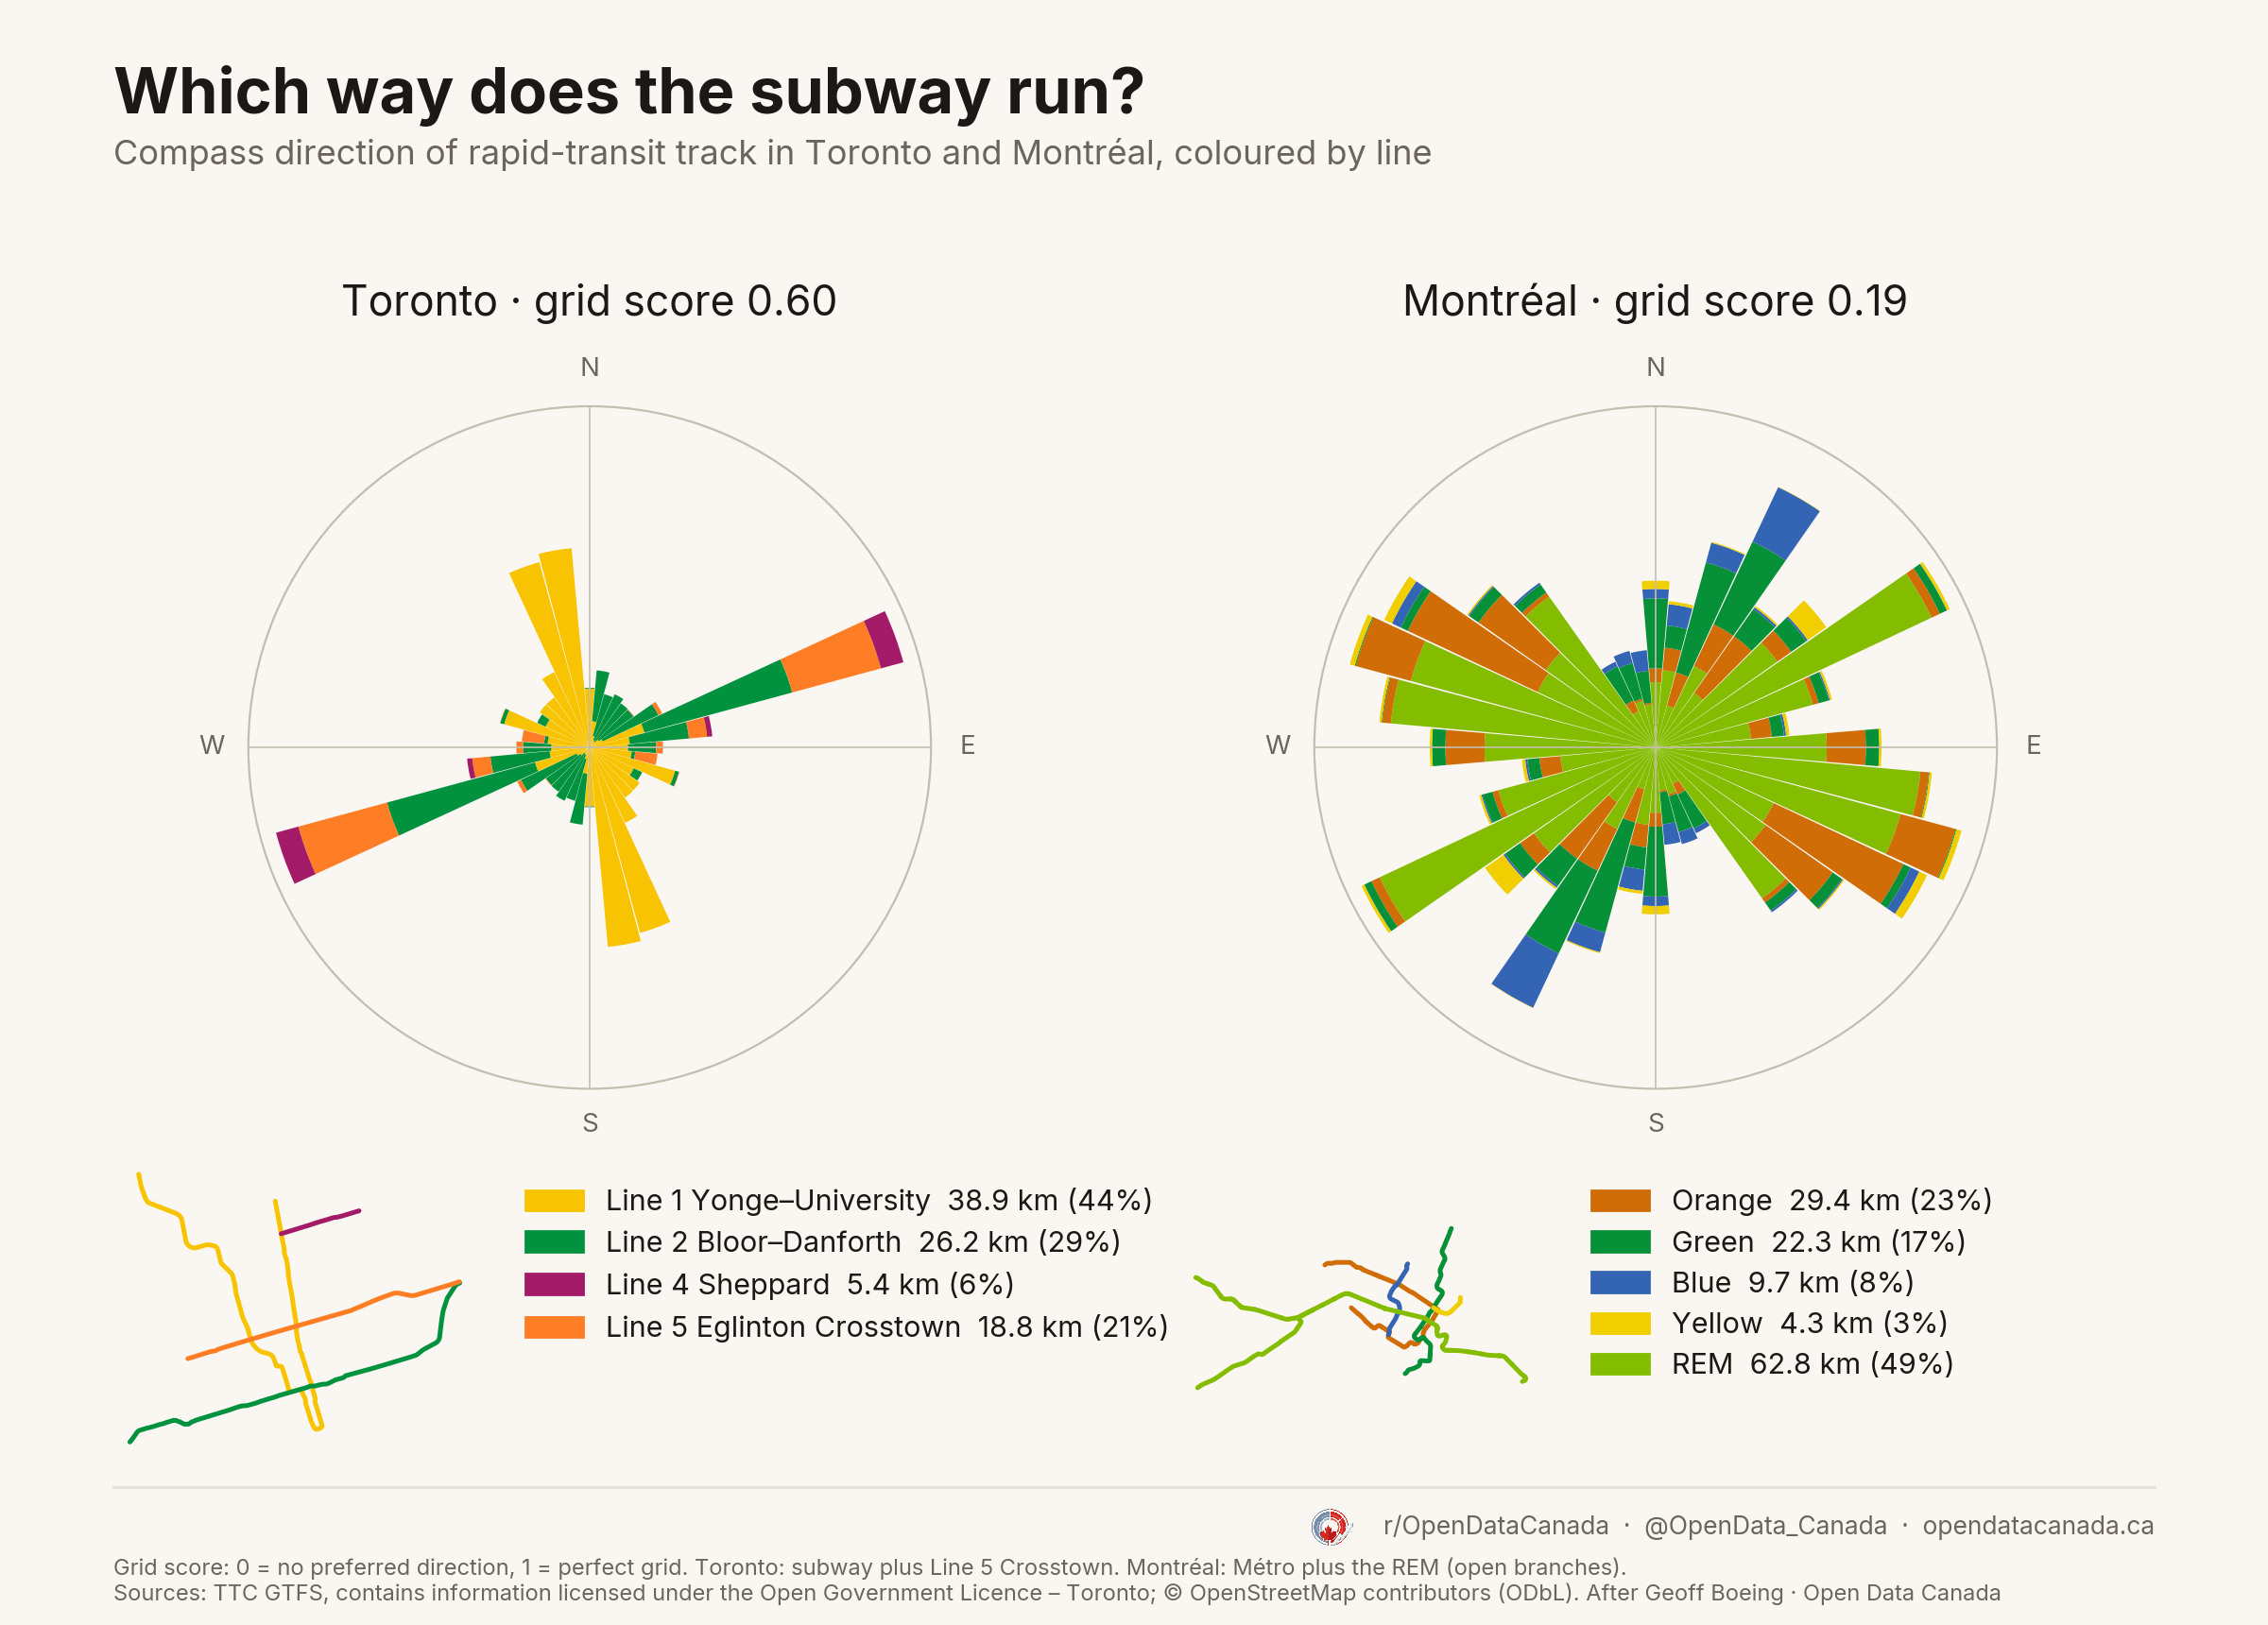
Toronto's subway and Line 5 Crosstown score 0.60 on a 0–1 grid scale. Montréal's Métro and REM score 0.19. Toronto's track points mostly north–south and east–west; Montréal's spreads across many directions. Half of Montréal's track is the REM, which is not a subway. Counting subway lines only, the scores are 0.50 and 0.27, and the gap remains.
What the chart shows
Each bar is a compass direction; its area is the share of track running that way, coloured by line.
Toronto has about 89 km of track: Line 1 Yonge–University (38.9 km), Line 2 Bloor–Danforth (26.2 km), Line 5 Eglinton Crosstown (18.8 km) and Line 4 Sheppard (5.4 km). Montréal has about 128 km: the REM (62.8 km, open branches only) and the four Métro lines, Orange (29.4 km), Green (22.3 km), Blue (9.7 km) and Yellow (4.3 km). Line 5 and the REM are included because each runs on its own track. Line 6 Finch West, a surface light-rail line, is left out.
See each city on its own: Toronto, Montréal and Vancouver.
Common questions
Why is Toronto's subway more grid-like? Its two main lines follow the street grid, Line 1 north–south and Line 2 east–west, and Line 5 runs east–west too. Montréal's Orange line loops around Mount Royal, and its lines bend more, so track points in many directions.
Is the gap just because of the REM? Partly. Without Line 5 and the REM, Toronto scores 0.50 and Montréal 0.27, so the gap narrows from 0.41 to 0.23. Toronto is still more grid-like.
What is the grid score? A 0–1 measure of how much track points in a few directions. 0 means every direction is equally common; 1 means a perfect grid.