
Transit · Chart
Montréal's metro and REM point every which way
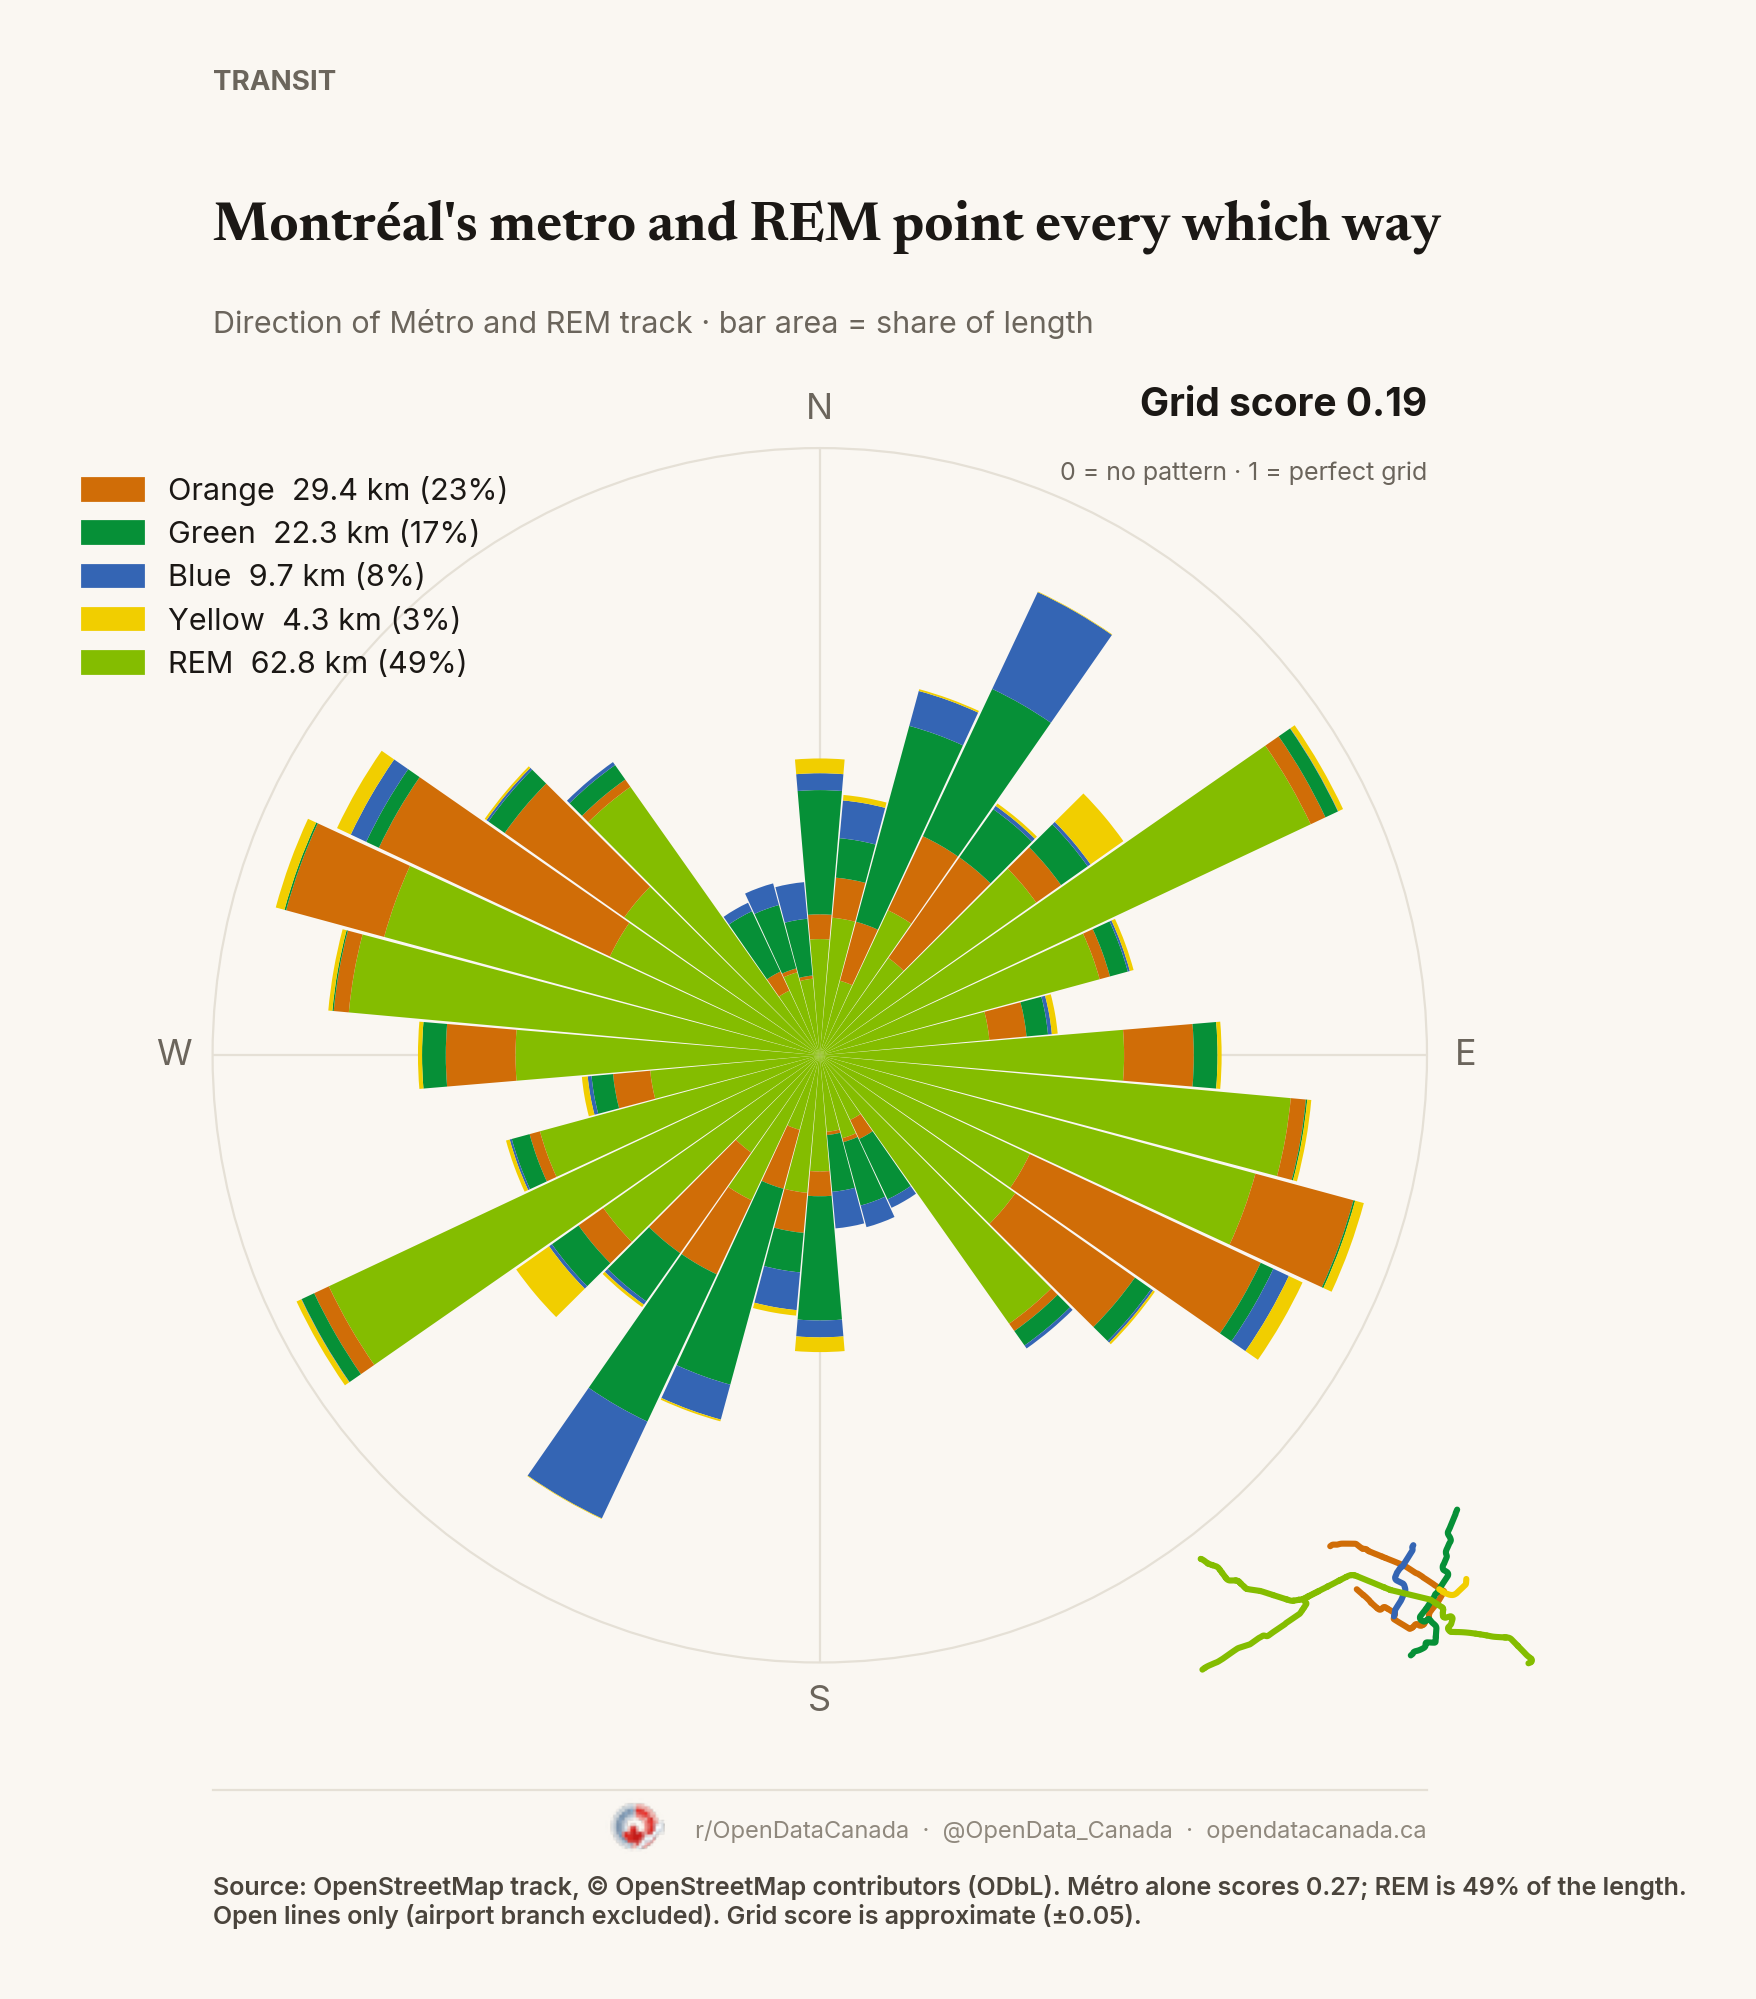
Montréal's four Métro lines and the REM score 0.19 on a 0–1 grid scale, the least grid-like of the three cities. The Métro alone scores 0.27; the REM, laid out across the island and both shores, is 49% of the track and points in many directions.
What the chart shows
Each bar is a compass direction; its area is the share of track running that way, coloured by line. A north–south track counts for both north and south. Grid score (orientation order) is approximate, about ±0.05, depending on where the 10° bins start.
The REM (62.8 km, open branches to Deux-Montagnes, Brossard and Anse-à-l'Orme) is the longest part. The Métro adds Orange (29.4 km), Green (22.3 km), Blue (9.7 km) and Yellow (4.3 km). The REM airport branch is not open and is excluded. Track comes from OpenStreetMap because the STM's public track files are straight lines between stations.
Common questions
Is the REM part of the Métro? No. The REM is a separate automated system, but it runs on its own track like the Métro, so it is included here. The Métro alone scores 0.27.
What is the grid score? A 0–1 measure of how much track points in a few directions. 0 means every direction is equally common; 1 means a perfect grid.