Education · PISA 2025
Canada's science scores hit a record low in PISA 2025
Canadian 15-year-olds scored above the OECD average in science, reading, and math on the 2025 Programme for International Student Assessment, but science, the assessment's focus this cycle, fell to its lowest recorded level since testing began in 2006, and reading and math are down sharply too. Provincial results vary by as much as 51 points depending on subject.
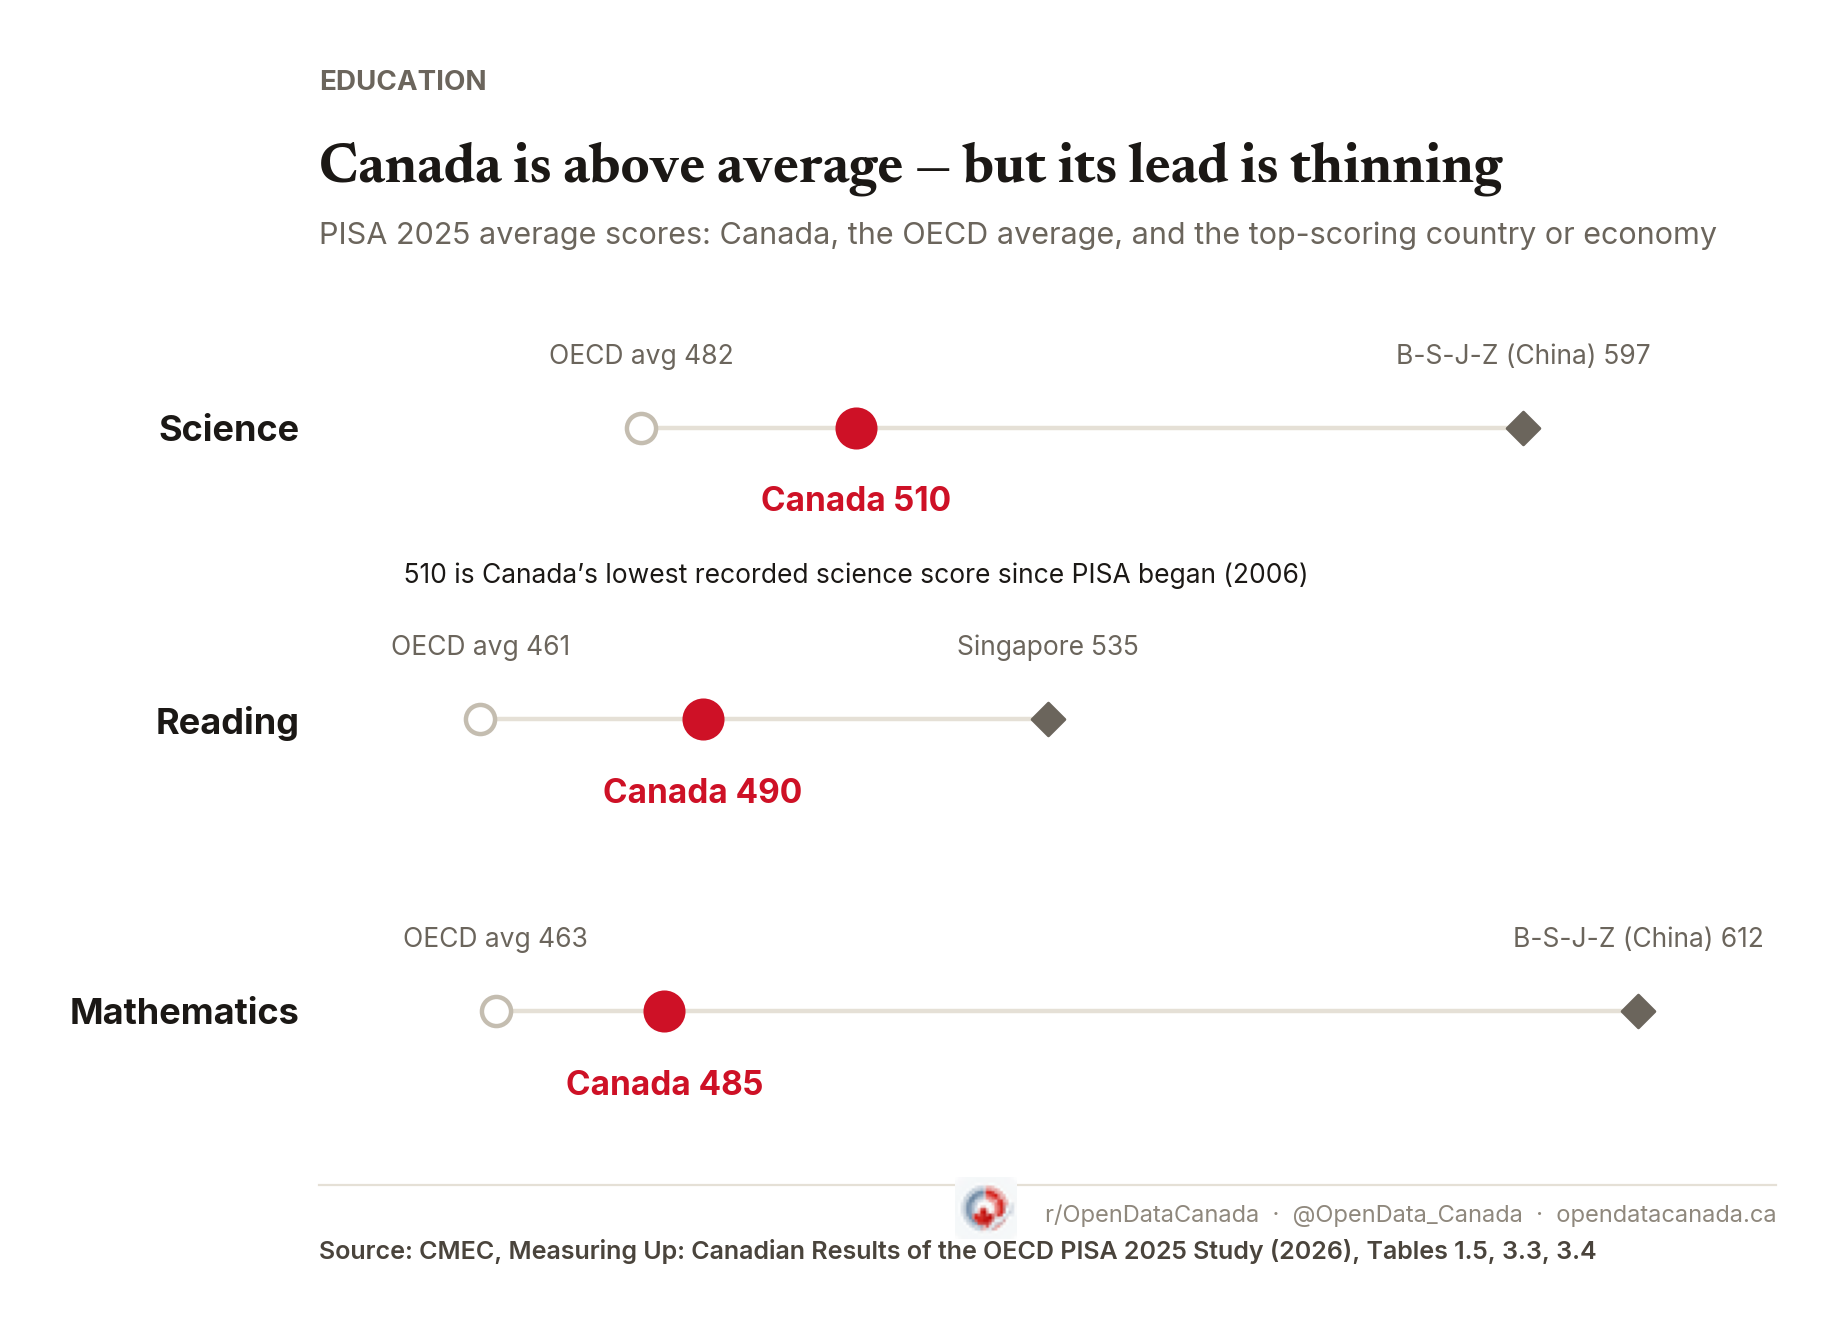
Canadian 15-year-olds continued to outperform the international average on the OECD's 2025 Programme for International Student Assessment, according to results released this month. But the pattern beneath that headline is uneven: science, the assessment's main focus this cycle, fell to its lowest recorded level since PISA began measuring it in 2006, while reading and math are down sharply from their pre-pandemic and 2022 benchmarks. Provincial results, meanwhile, vary considerably by subject.
Where Canada stands internationally
Canadian students recorded average scores of 510 in science, 490 in reading, and 485 in mathematics, all above the OECD averages of 482, 461, and 463. Of the 90 other education systems PISA tracks, Canada was significantly outperformed by 7 in science, 9 in reading, and 9 in mathematics. In each subject, Canada's score also landed in a wider cluster of high performers it isn't statistically distinguishable from: in science, Alberta, Ontario, British Columbia, Quebec, the United Kingdom, New Zealand, Australia, and the United States; in reading, Alberta, British Columbia, Ontario, the United Kingdom, Australia, the United States, Nova Scotia, and Saskatchewan; in mathematics, Alberta, Ontario, British Columbia, the United Kingdom, Poland, the Netherlands, and Belgium. PISA reports standing this way, as overlapping comparison groups, because the confidence intervals involved are too wide to support a clean numerical rank — this article does the same.
The top scores came from B-S-J-Z (China) in science (597) and mathematics (612), and Singapore in reading (535). B-S-J-Z is not a national result — it covers four Chinese provincial-level jurisdictions (Beijing, Shanghai, Jiangsu, and Zhejiang) that PISA reports as a single "economy" rather than a country, the same designation it gives Macao, Hong Kong, and Chinese Taipei. The distinction matters because it means Canada's "outperformed by 7" tally in science, for instance, is four countries (Singapore, Japan, Estonia, Korea) plus three economies, not seven directly comparable national school systems.
A longer-term decline
Science is the only subject with a full historical series for Canada, running back to 2006. On that series, 510 is Canada's lowest score across all seven cycles, and it sits significantly below the 528 recorded in 2015, the last time science was the major domain (the OECD average fell too, from 493 to 482, over the same stretch). The change from 2022 to 2025 — 515 to 510 — was not statistically significant on its own.
Reading and math don't have as long a published series, since both are minor domains in the 2025 cycle, but the more recent trend is clear in both. Canada's reading score fell from 520 in 2018 to 490 in 2025, a 30-point drop against a 26-point decline across the OECD; math fell from 497 in 2022 to 485 in 2025, down 12 points against a 9-point OECD decline, continuing a slide CMEC traces back to 2012. Looking only at the most recent cycle, Canada's reading score fell 17 points between 2022 and 2025, compared with a 15-point average OECD decline.
Provincial results
Alberta recorded the highest average in science (520) and reading (499); Quebec recorded the highest in math (500). New Brunswick recorded the lowest average in all three subjects (474 in science, 456 in reading, 449 in math) — a spread of 46 points in science, 43 in reading, and 51 in math between the top and bottom province.
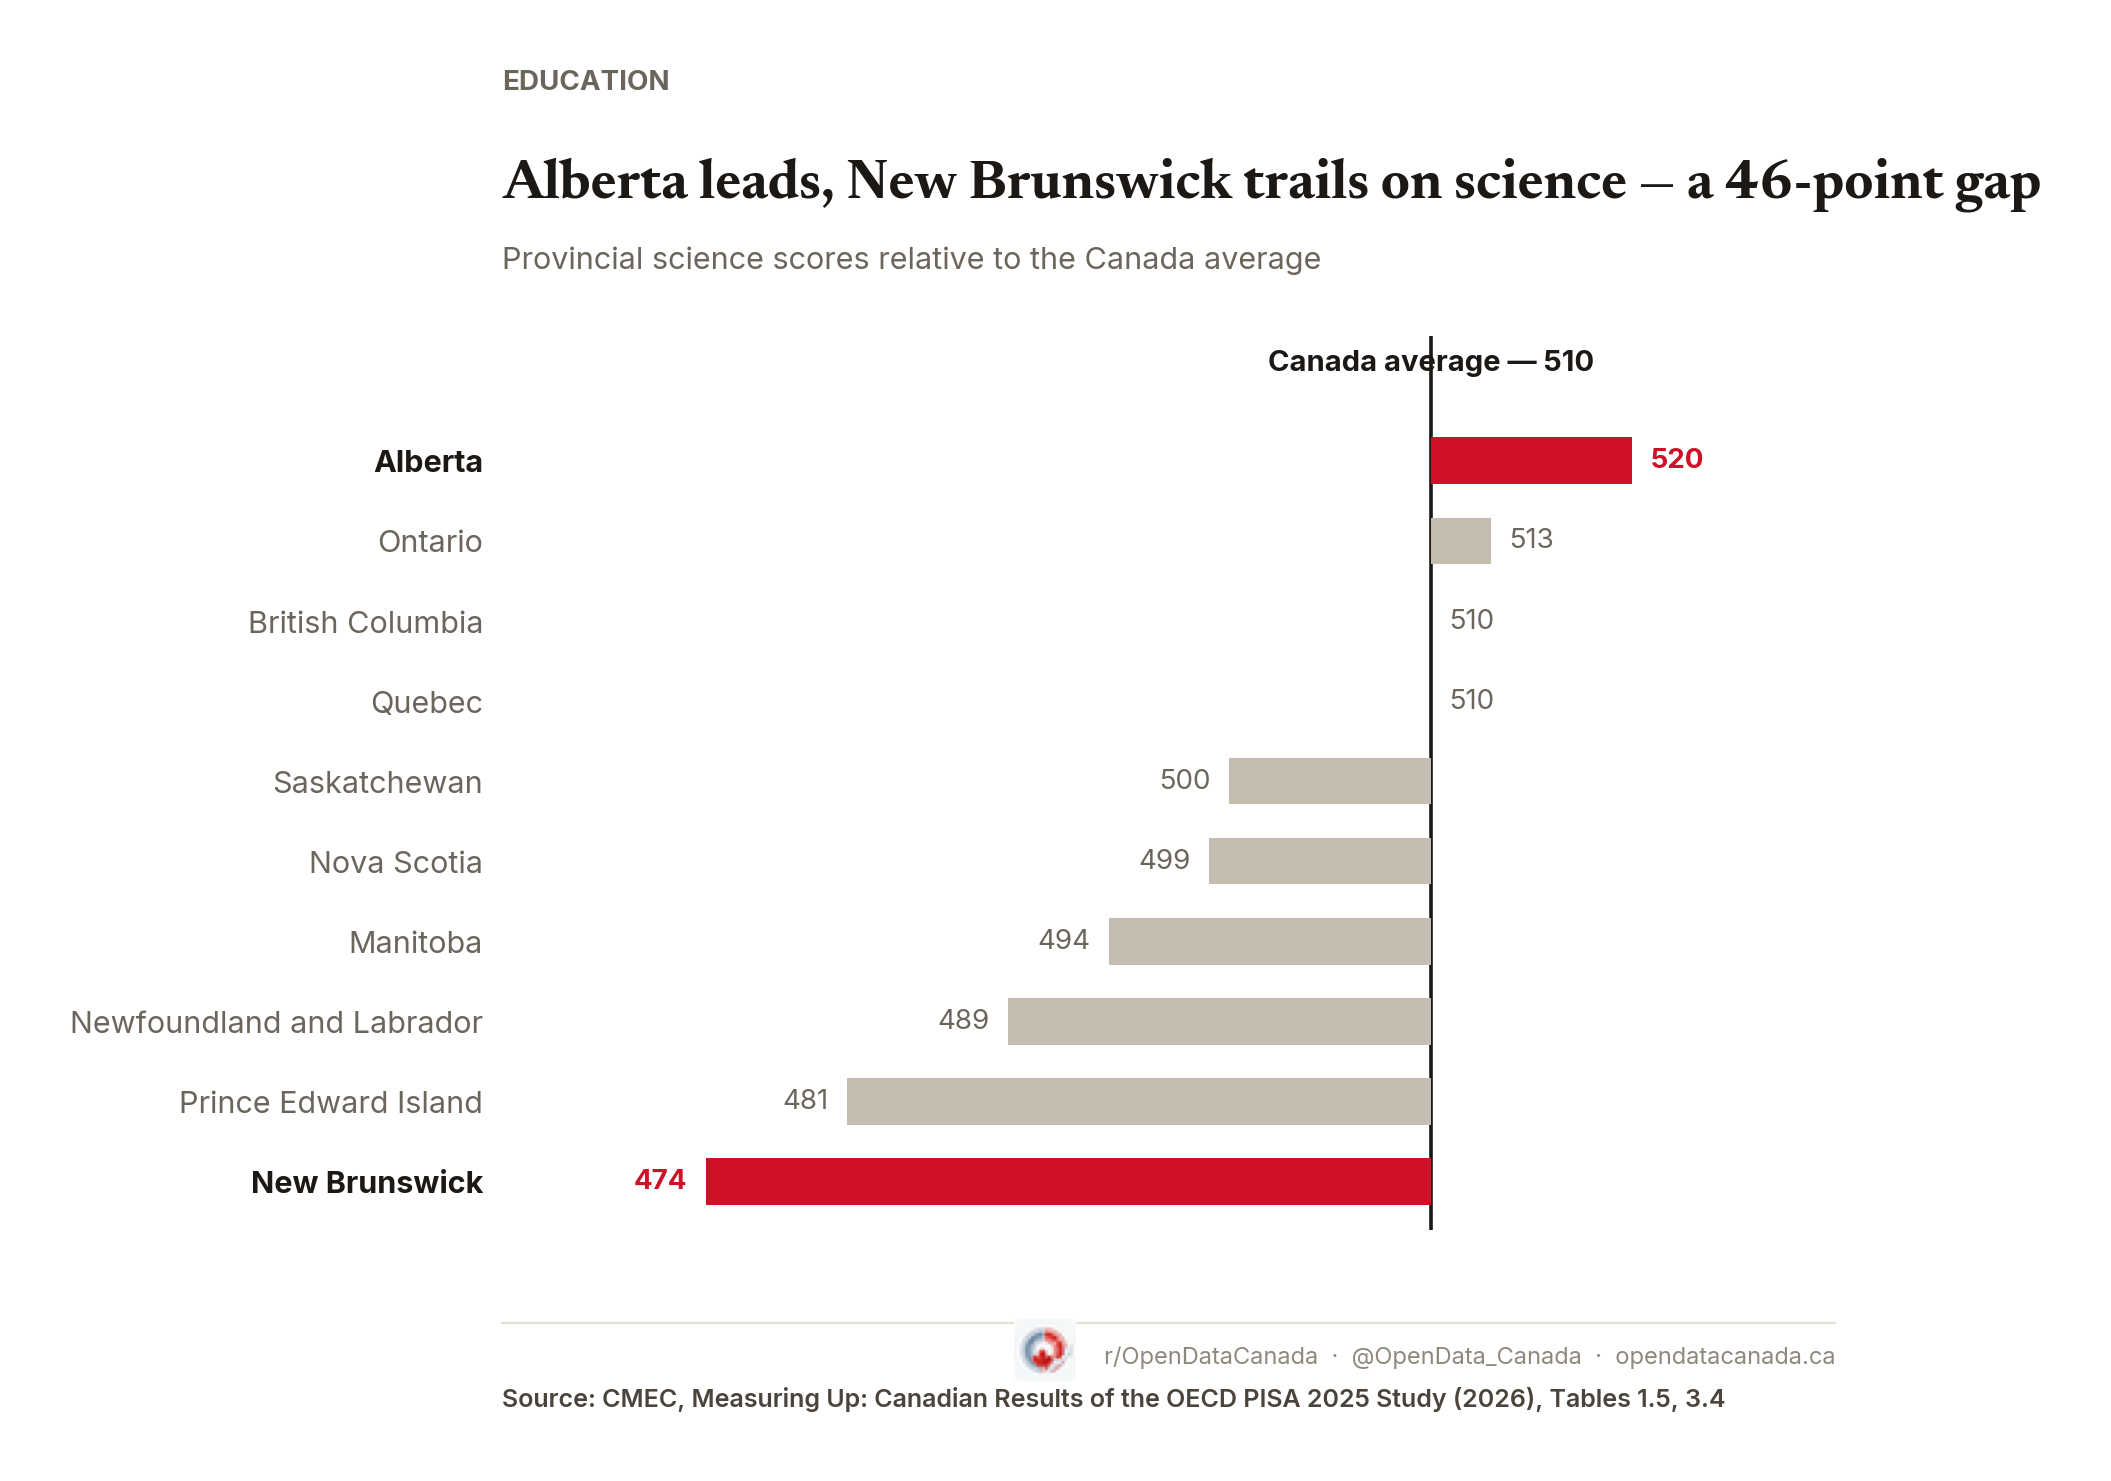
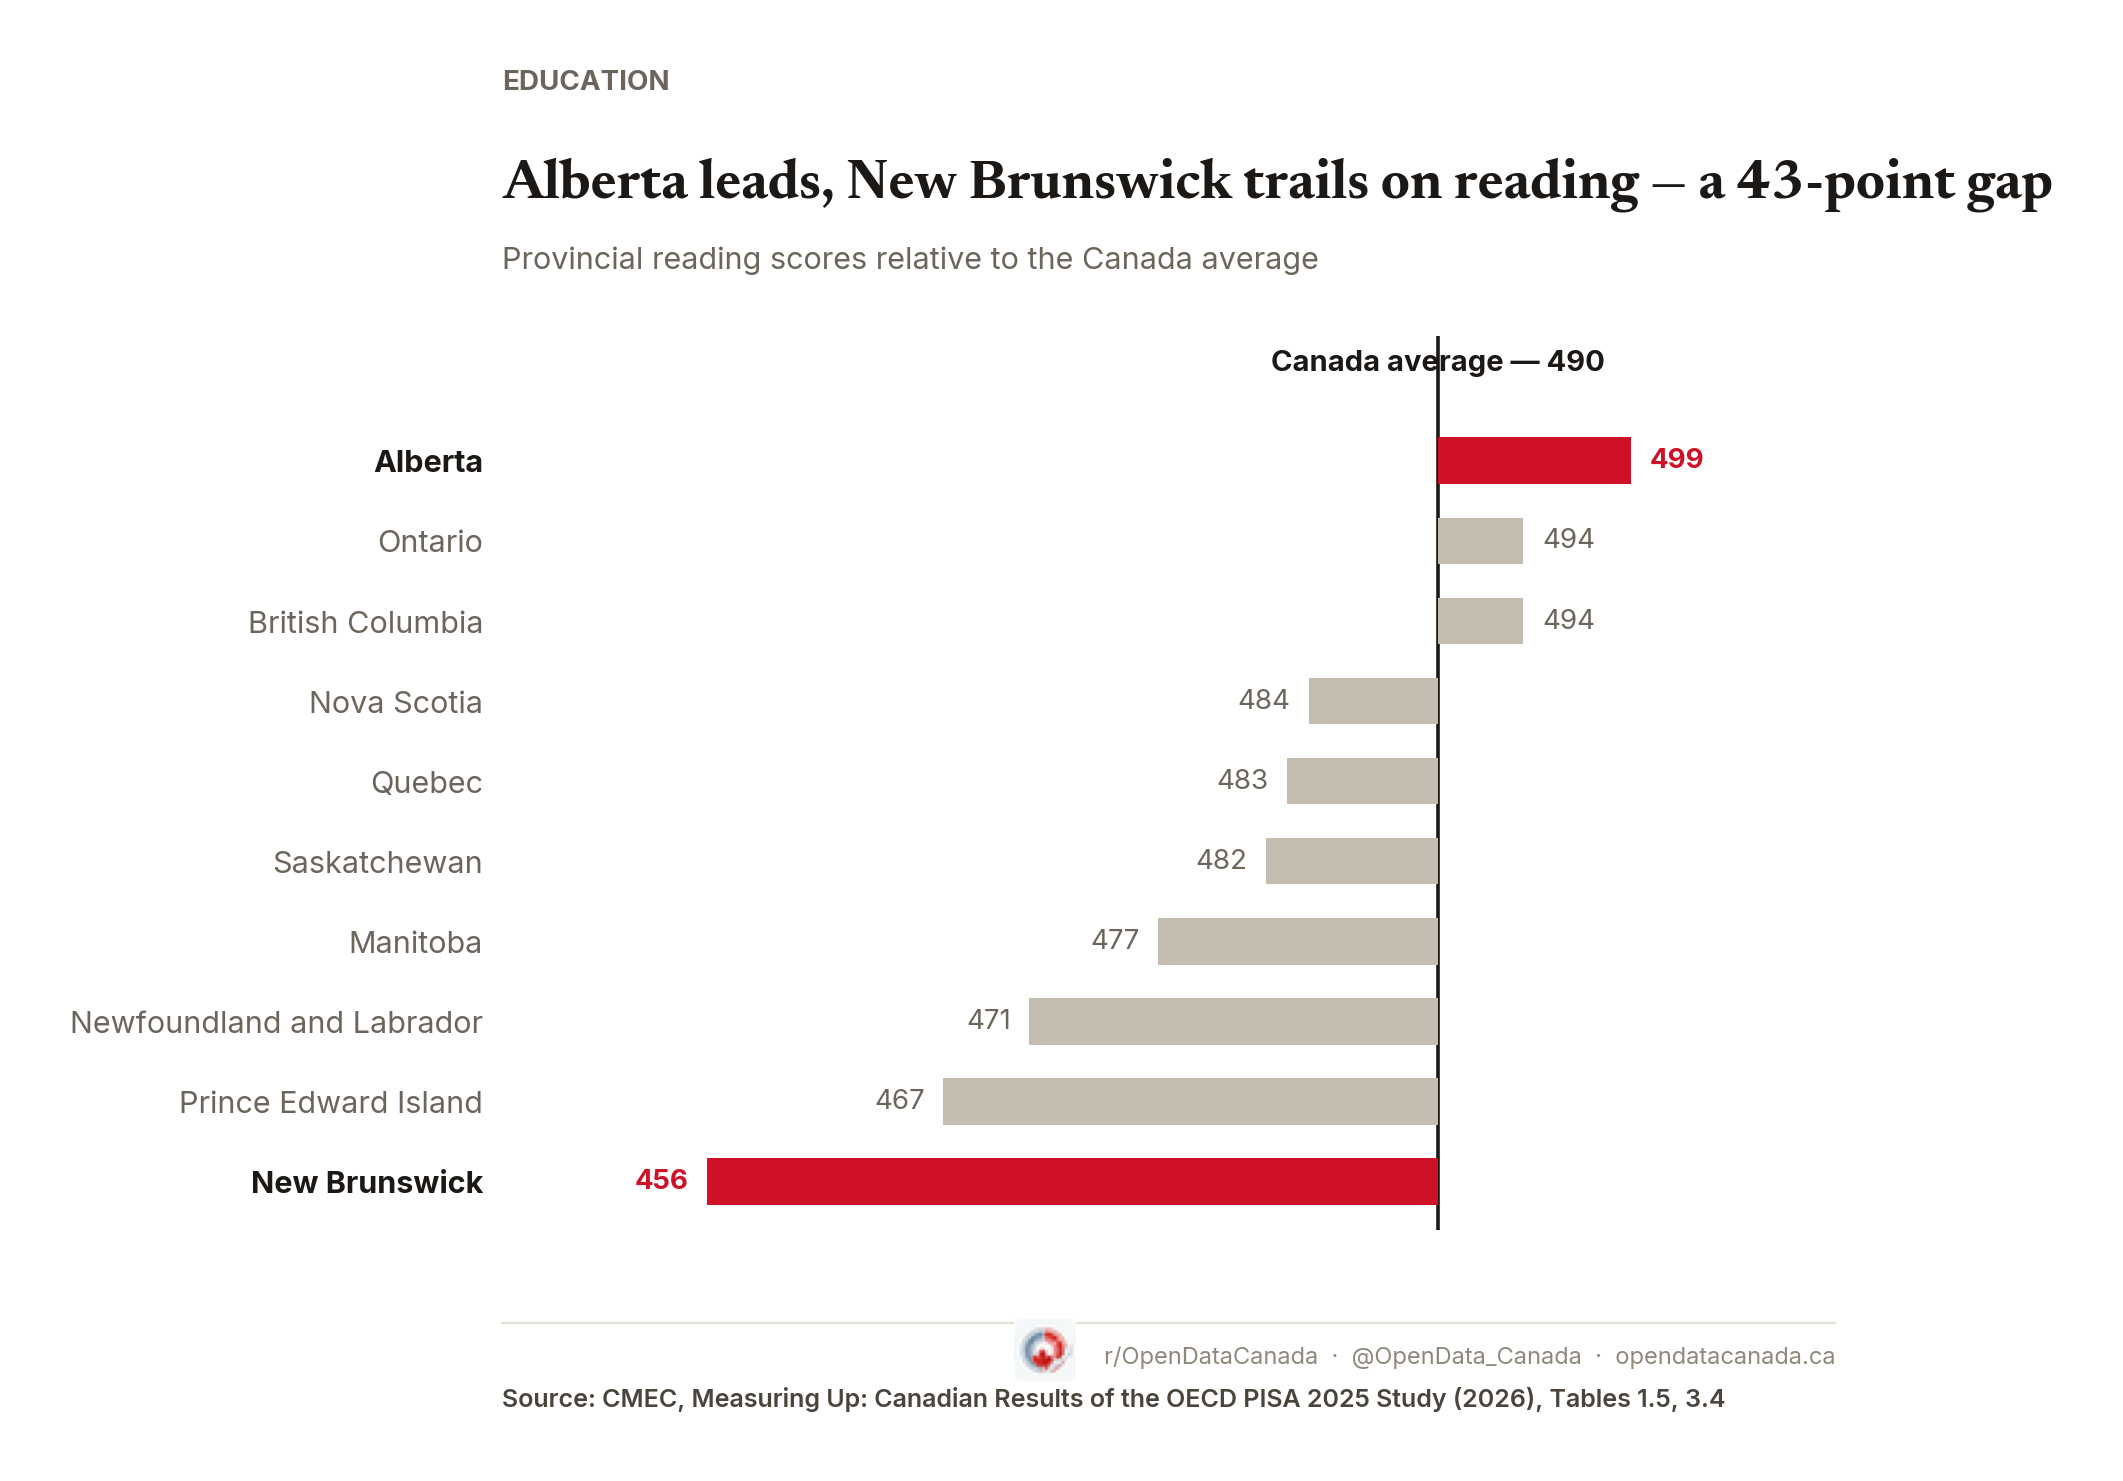
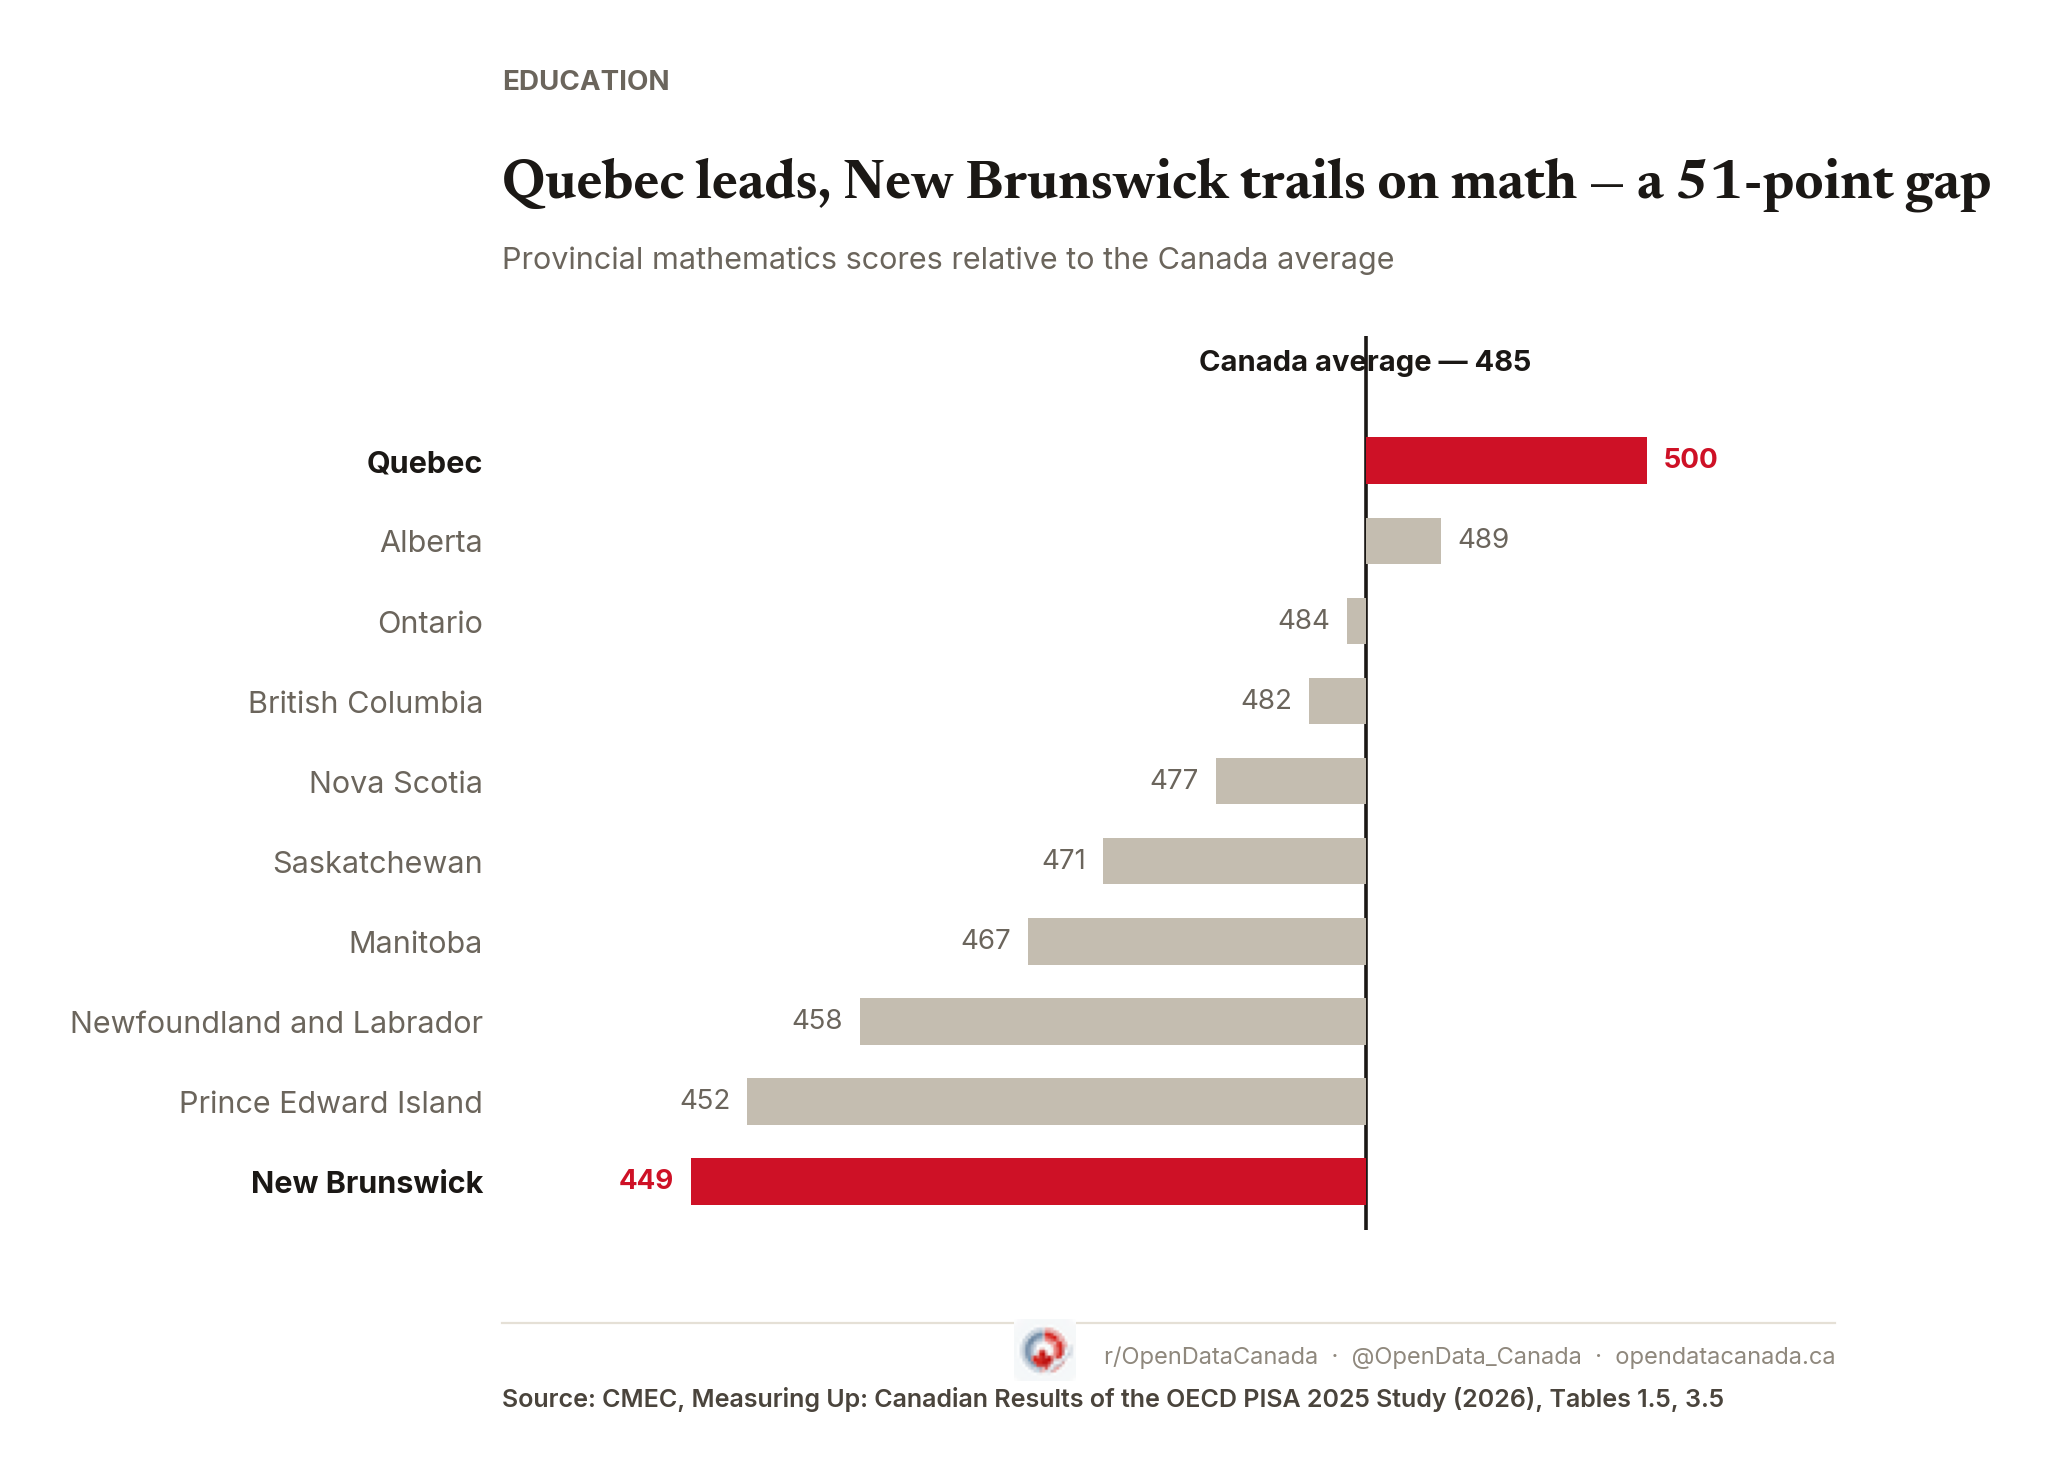
The declines since 2022 weren't uniform. In math, Alberta's and British Columbia's drops were not statistically significant, while Quebec, Ontario, New Brunswick, and Prince Edward Island recorded significant declines; Newfoundland and Labrador, Nova Scotia, Manitoba, and Saskatchewan showed no significant change either way.
A participation caution, not a margin-of-error one
CMEC flags Canada's overall results, and those of seven provinces (Newfoundland and Labrador, Nova Scotia, Quebec, Ontario, Manitoba, Alberta, and British Columbia), to be "treated with caution because one or more PISA technical standards were not met." That is a different problem from the ordinary statistical margin of error attached to every score above — it's about who showed up to take the test. PISA requires an 80 percent weighted student response rate after replacement; Canada's overall rate was 77.4 percent, essentially unchanged from 77.0 percent in 2022, and it fell short of that threshold in most provinces (Prince Edward Island, New Brunswick, and Saskatchewan were the exceptions).
Because of that shortfall, Statistics Canada ran a non-response bias analysis and found evidence of bias at the student level in six anglophone provincial systems and in Quebec's francophone system (Saskatchewan showed limited evidence; New Brunswick and Quebec's anglophone system showed none). The OECD's PISA Adjudication Group reviewed that analysis, judged Canada's data suitable for full inclusion in the international dataset, and concluded the likely effect is a small upward bias — students who responded tended to score higher than those who didn't. Because non-response was similar in both 2022 and 2025, the Group judged the bias's effect on the trend comparisons in this article to be negligible.
Canada's 2025 PISA results describe a system that remains above the OECD average on every measure, alongside a cluster of similarly high-performing countries and provinces, while posting its lowest recorded science score to date and continued declines in reading and math. A 51-point gap between the top and bottom province means the national numbers hide real variation in what "above average" looks like depending on where a student attends school.