Economy
An estimated 1,700 families hold more wealth than the bottom 6.7 million
An estimated 1,700 Canadian families held 873 billion dollars in net worth in 2023. The bottom 40%, about 6.7 million families, held 542 billion combined.
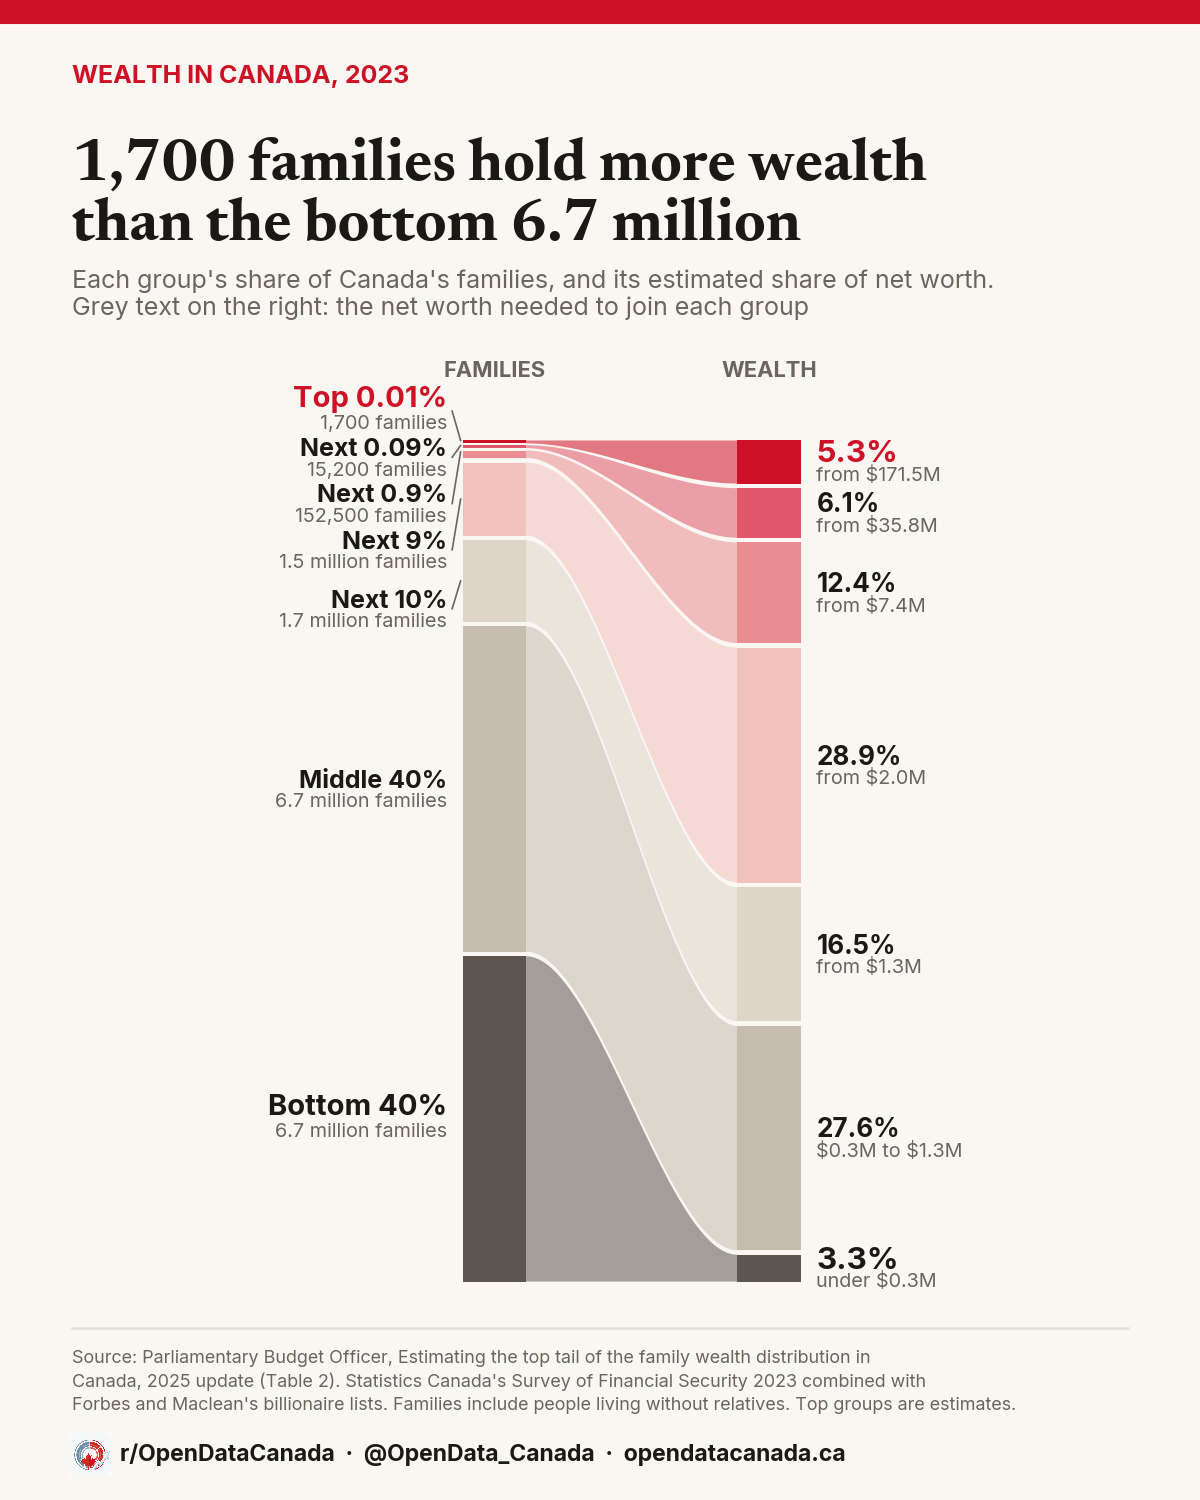
Each band on the chart starts at a group's share of families and ends at its share of wealth. The bottom 40% shrinks to 3.3%. The top 0.01%, a sliver on the left, grows to 5.3%. The count of families also includes people who aren't part of an economic family, such as someone living alone.
Divided evenly, that comes to roughly 500 million dollars a family in the top group and about 80,000 in the bottom 40%.
That gap is now part of the budget debate, after the NDP called for a wealth tax on fortunes above 10 million dollars.
The split runs well below the very top. Families worth at least 7.4 million dollars, the top 1%, held 23.8% of all net worth. Those worth at least 2 million, the top 10%, held 52.7%, more than the other 90% combined. The middle 40%, worth from about 300,000 dollars to 1.3 million, held 27.6%.
Why these numbers are estimates
Statistics Canada's wealth survey misses many of the very richest families, and it puts the top 1% at 11.0% of net worth. The Parliamentary Budget Officer, Parliament's independent fiscal watchdog, adds the Forbes and Maclean's rich lists, uses statistical modelling to estimate the wealth between the survey and those lists, and adjusts the total to match Canada's national household wealth figures. That more than doubles the share to 23.8%.
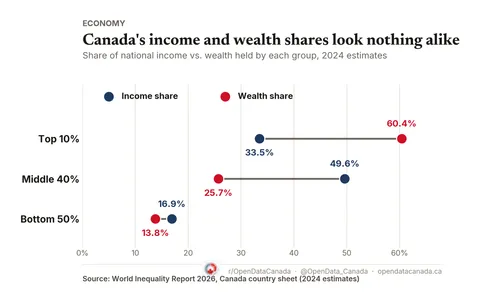
Other methods land elsewhere. The World Inequality Report, using a different method and a 2024 estimate, puts the top 10% at 60.4%. The budget officer warns of significant uncertainty in its own figures, so treat them as a scale, not a precise count.
A home carries the middle. Investments carry the top.
The budget officer's 2023 estimates don't split wealth by type. Statistics Canada's household accounts do, and they run to the end of 2025. They count households, not families, and divide them into five equal groups, so their figures are a second view of the gap and don't line up one for one with the numbers above.
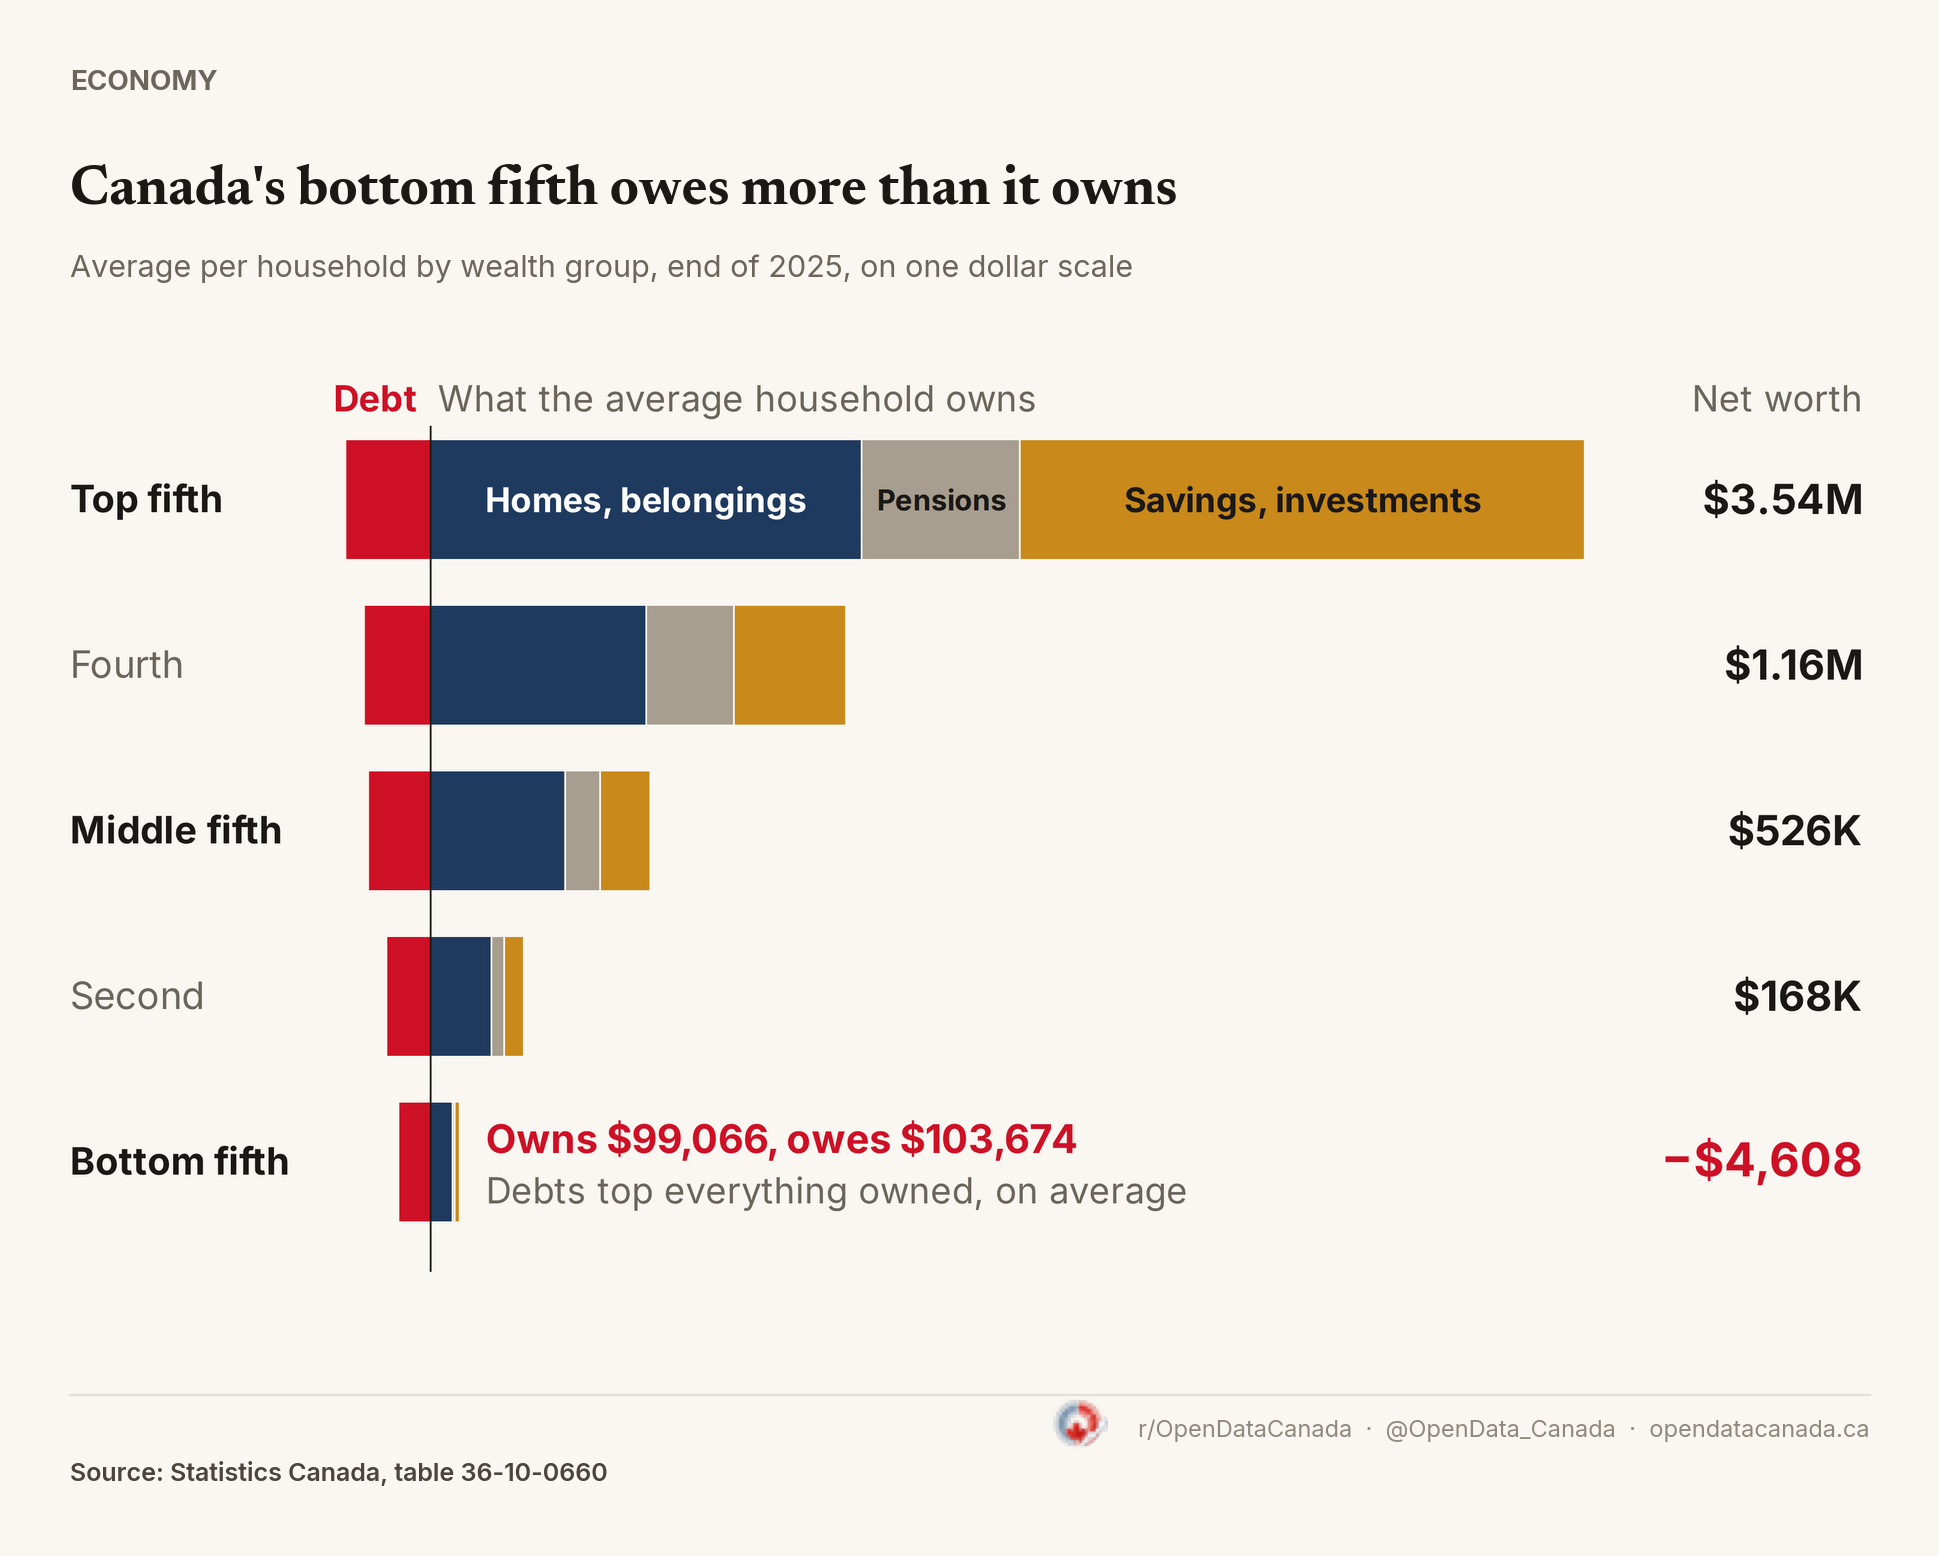
Canada's bottom fifth owes more than it owns
Average per household by wealth group, end of 2025. Tap or hover a group for its breakdown.
- Debt
- Homes and belongings
- Pensions and life insurance
- Savings and investments
Bottom fifth: owns $99,066, owes $103,674. Debt equals 105% of what it owns.
- Homes and belongings $75,479 76%
- Pensions and life insurance $6,975 7%
- Savings and investments $16,613 17%
Belongings include vehicles and other durable goods. Source: Statistics Canada, table 36-10-0660. Download chart · Download data (CSV)
The average household in the bottom fifth owned 99,066 dollars and owed 103,674. That leaves it 4,608 dollars in the red.
In the middle fifth, real estate makes up 54% of everything the average household owns. In the top fifth it falls to 34%, and savings and investments outside pensions take the lead at 49%. That top group holds 51% of the country's household real estate and 75% of those savings and investments.
Owning a home marks a wide line of its own. Renters averaged 355,473 dollars in net worth at the end of 2025, and owners with no mortgage averaged 1,852,000, about five times as much.
Those are averages, and the richest households pull them up. In 2023 the average net worth across all families was 995,900 dollars, and the median, the family in the exact middle, had 519,700. Where people live moves that midpoint too: 773,500 dollars in British Columbia, 665,600 in Ontario, 371,000 in Quebec and 286,200 in New Brunswick.
The top's share fell. Its lead still grew.
| End of 2010 | End of 2025 | |
|---|---|---|
| Top fifth's share of net worth | 68.9% | 65.7% |
| Middle fifth's share of net worth | 8.6% | 9.8% |
| Top fifth, average net worth | 2.46 million | 3.54 million |
| Middle fifth, average net worth | 308,400 | 526,200 |
| Gap between the two | 2.15 million | 3.02 million |
Dollar figures are in 2025 dollars.
By share, the middle gained ground. Its average net worth rose 71% after inflation, against 44% for the top fifth. But 71% of a small number is about 218,000 dollars, and 44% of a large one is about 1.08 million. Both readings are true, and the second is the one a family feels when it compares itself with the people above it.
The budget officer's estimates point the same way on share. It found concentration at the top in 2023 comparable to or slightly below 2019. Statistics Canada's top-fifth share has since edged up from 64.8% at the end of 2023 to 65.7%, too short a stretch to call a turn.
Income is less lopsided, and it's still steep
Wealth is what a family has built up. Income is what comes in each year, and it's spread more evenly. The top 1% of tax filers received 12.4% of income in 2023, about half their wealth share. These groups count individual filers, not families, so the comparison is rough. It's still far from flat.
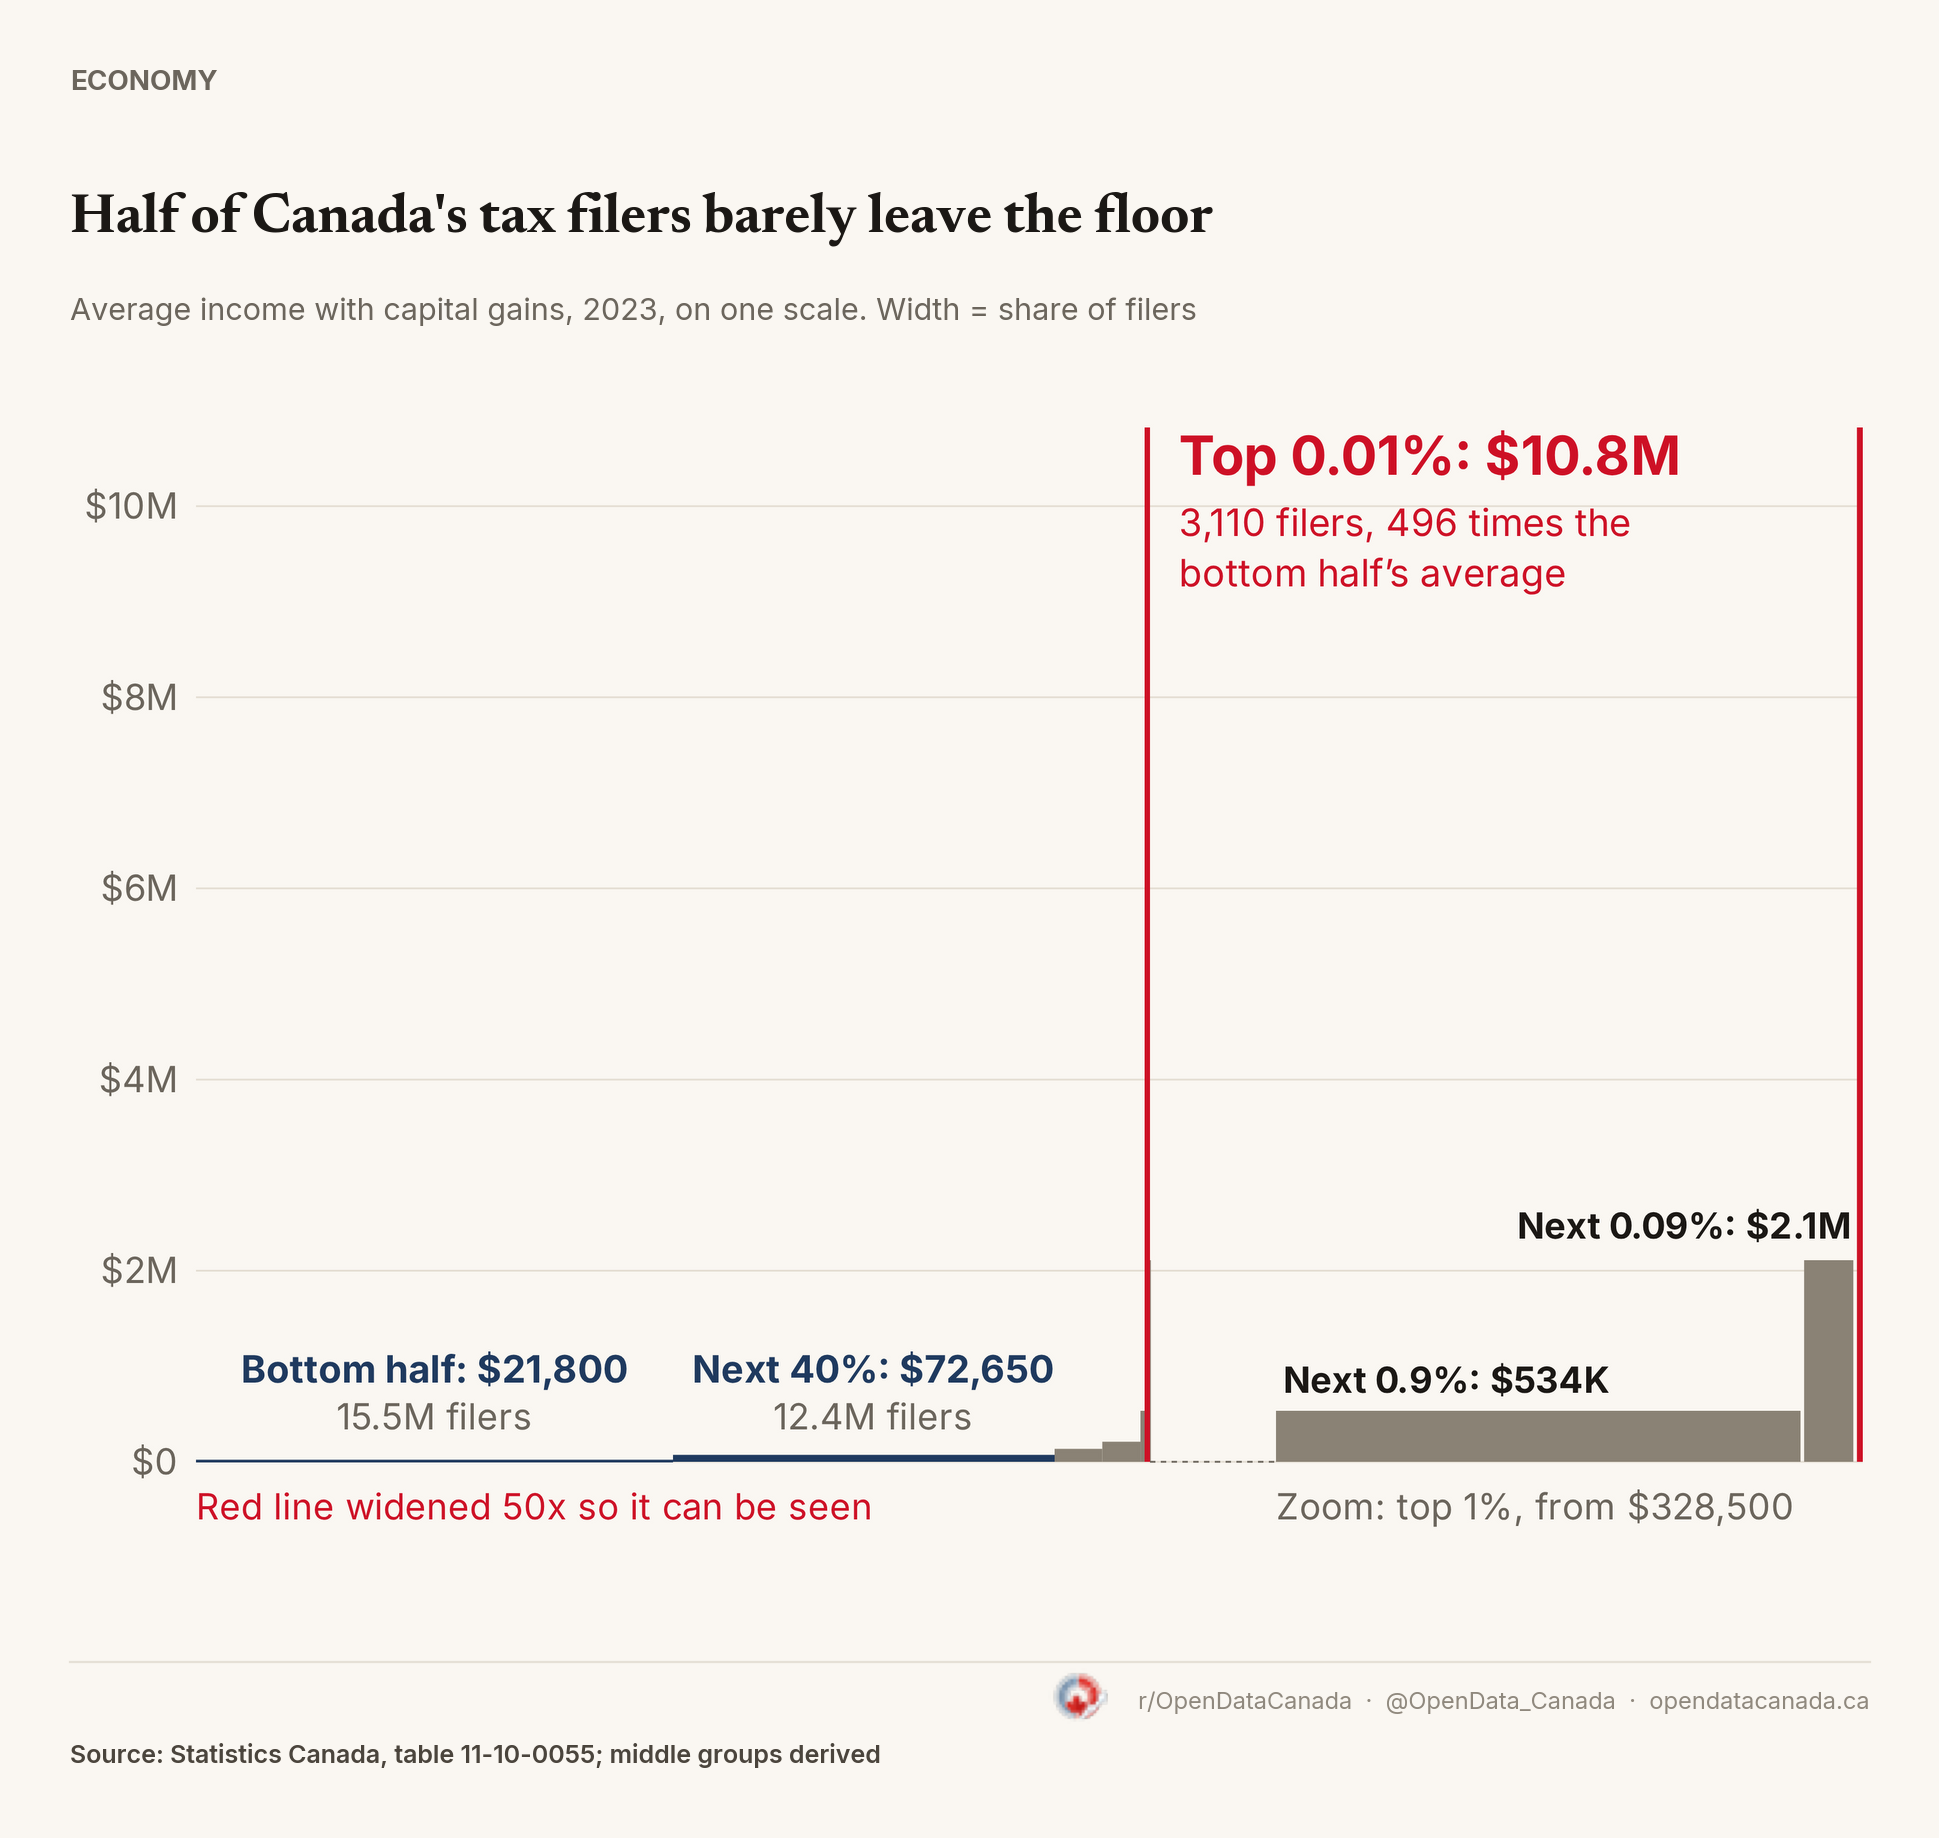
The bottom half of filers averaged 21,800 dollars in 2023. The top 0.01%, 3,110 people, averaged 10.8 million, or 496 times as much.
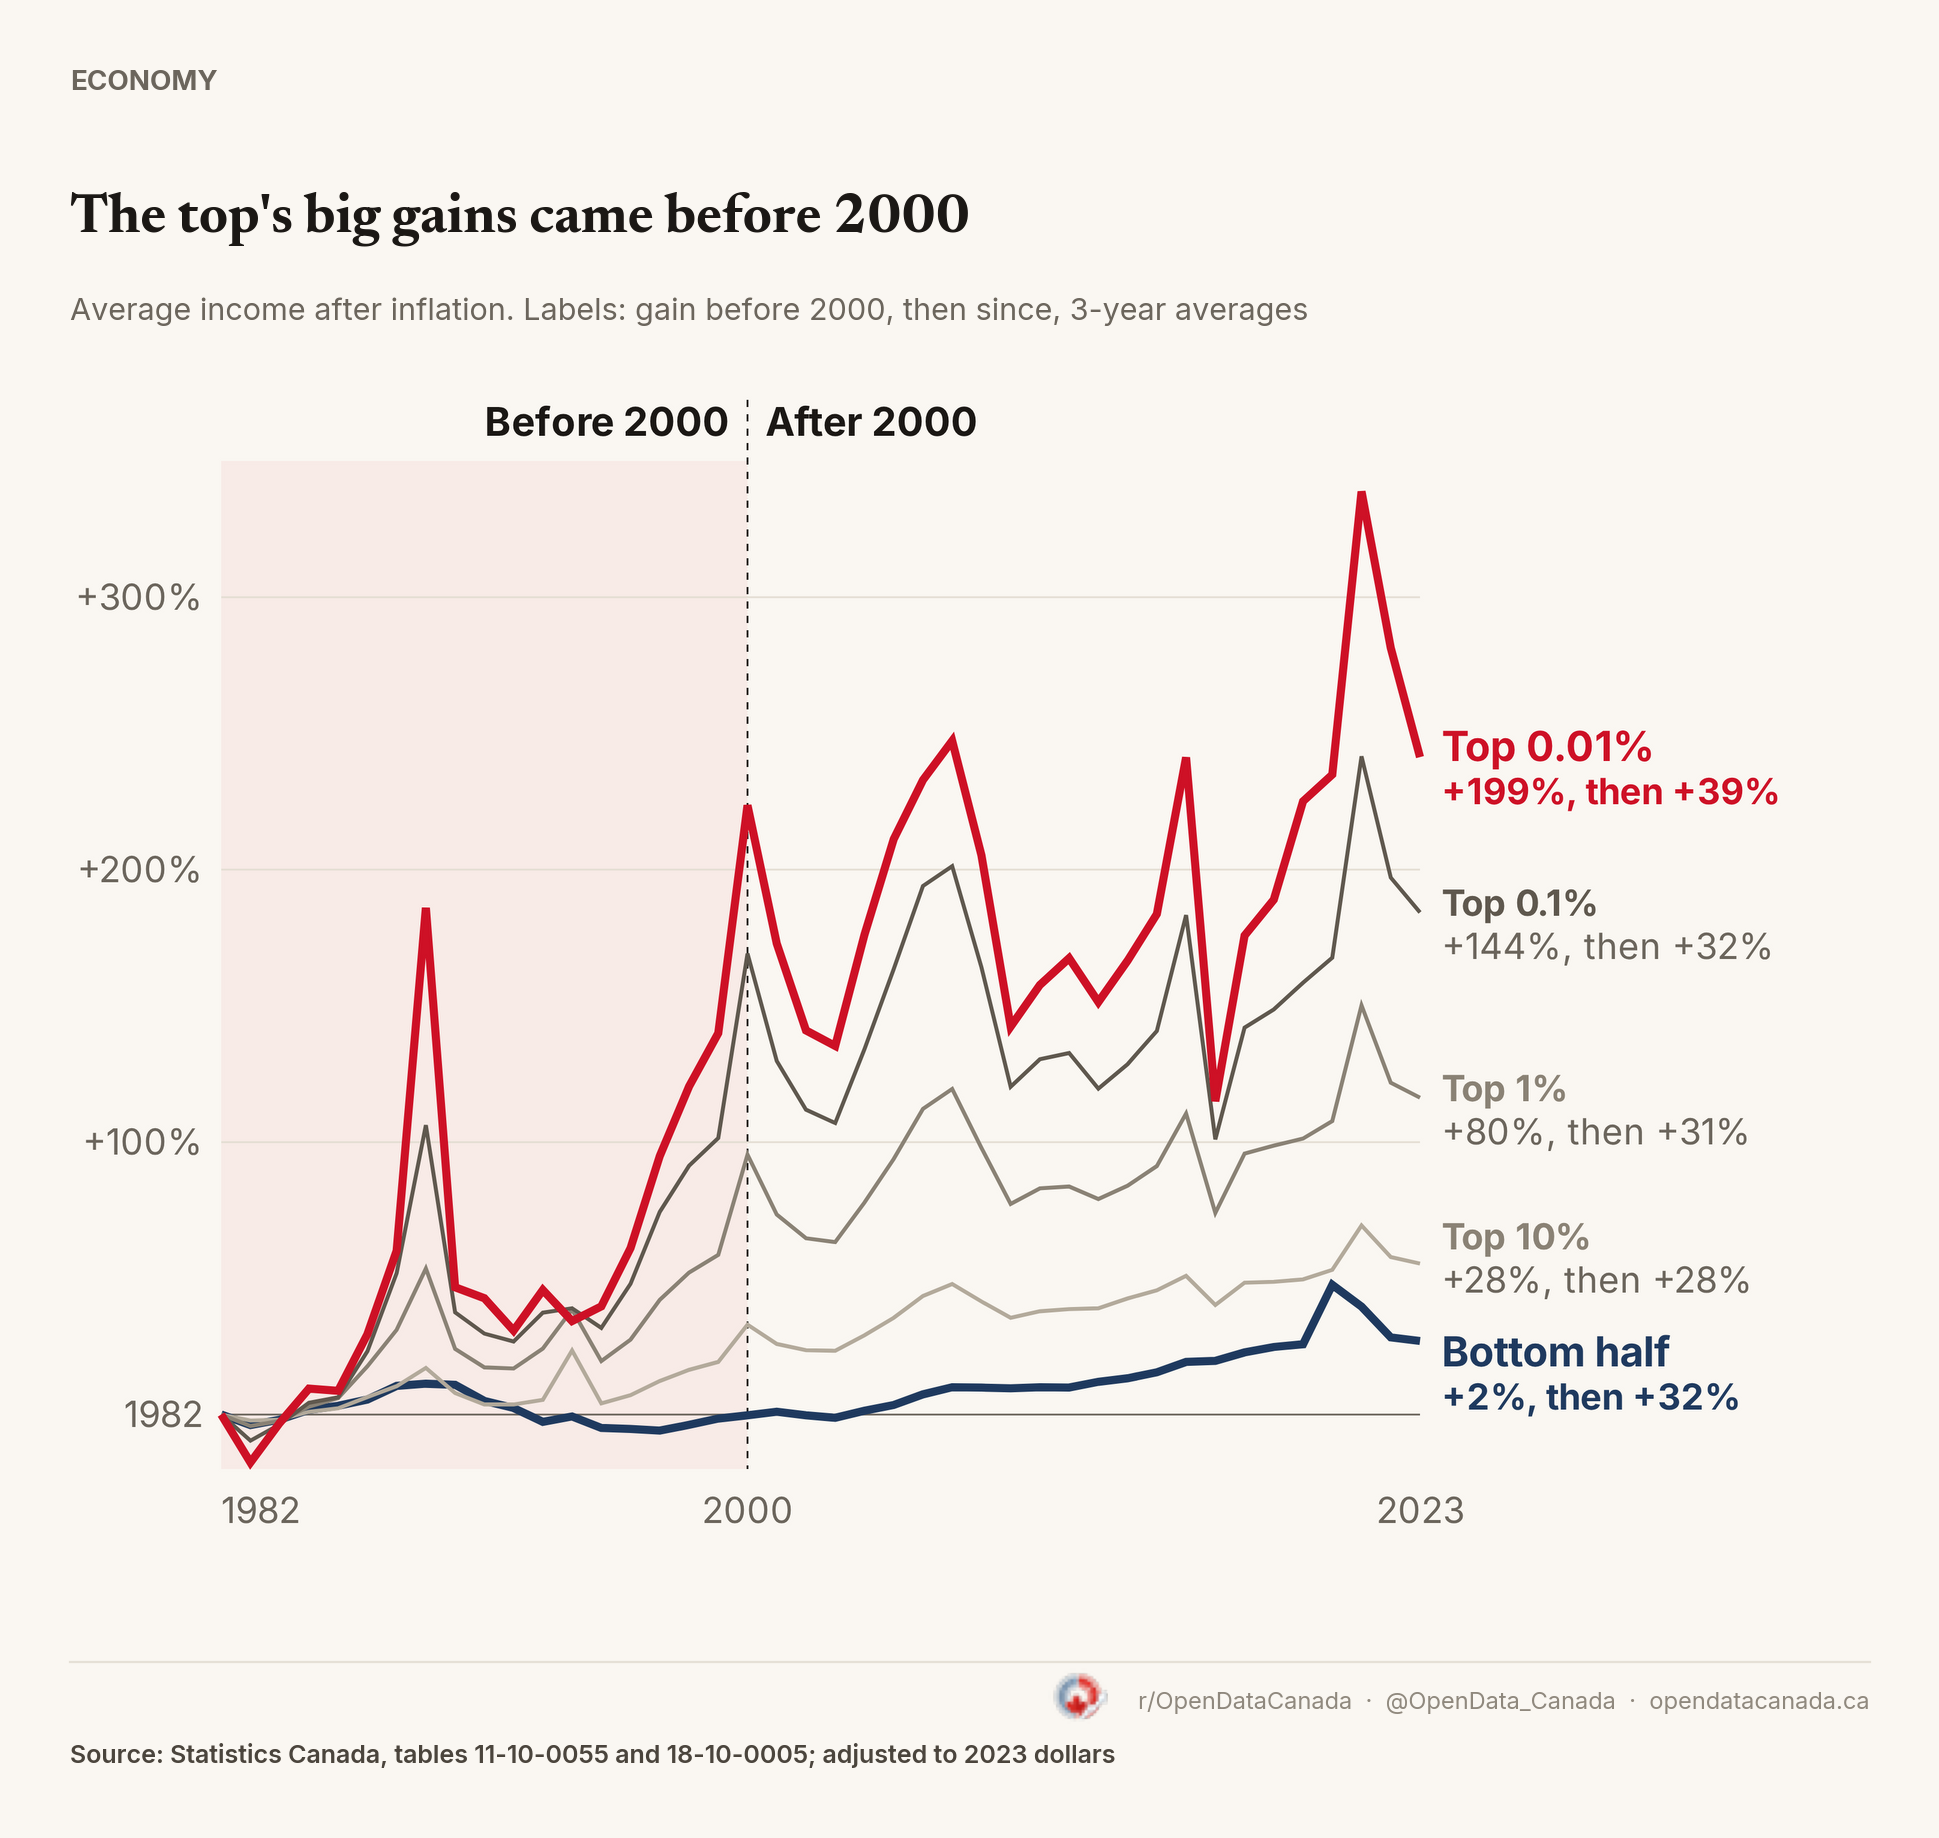
Much of that income gap emerged before 2000. After inflation, the bottom half gained 2% from 1982 to 2000 while the top 0.01% gained 199%. Since 2000 the two have moved at close to the same pace, up 32% and 39%.
Taxes and benefits do much of the levelling on income. On Statistics Canada's inequality score, where higher means more unequal, family incomes before taxes and benefits rose from 0.384 in 1976 to 0.436 in 2024. After taxes and benefits, the score barely moved, from 0.300 to 0.305.
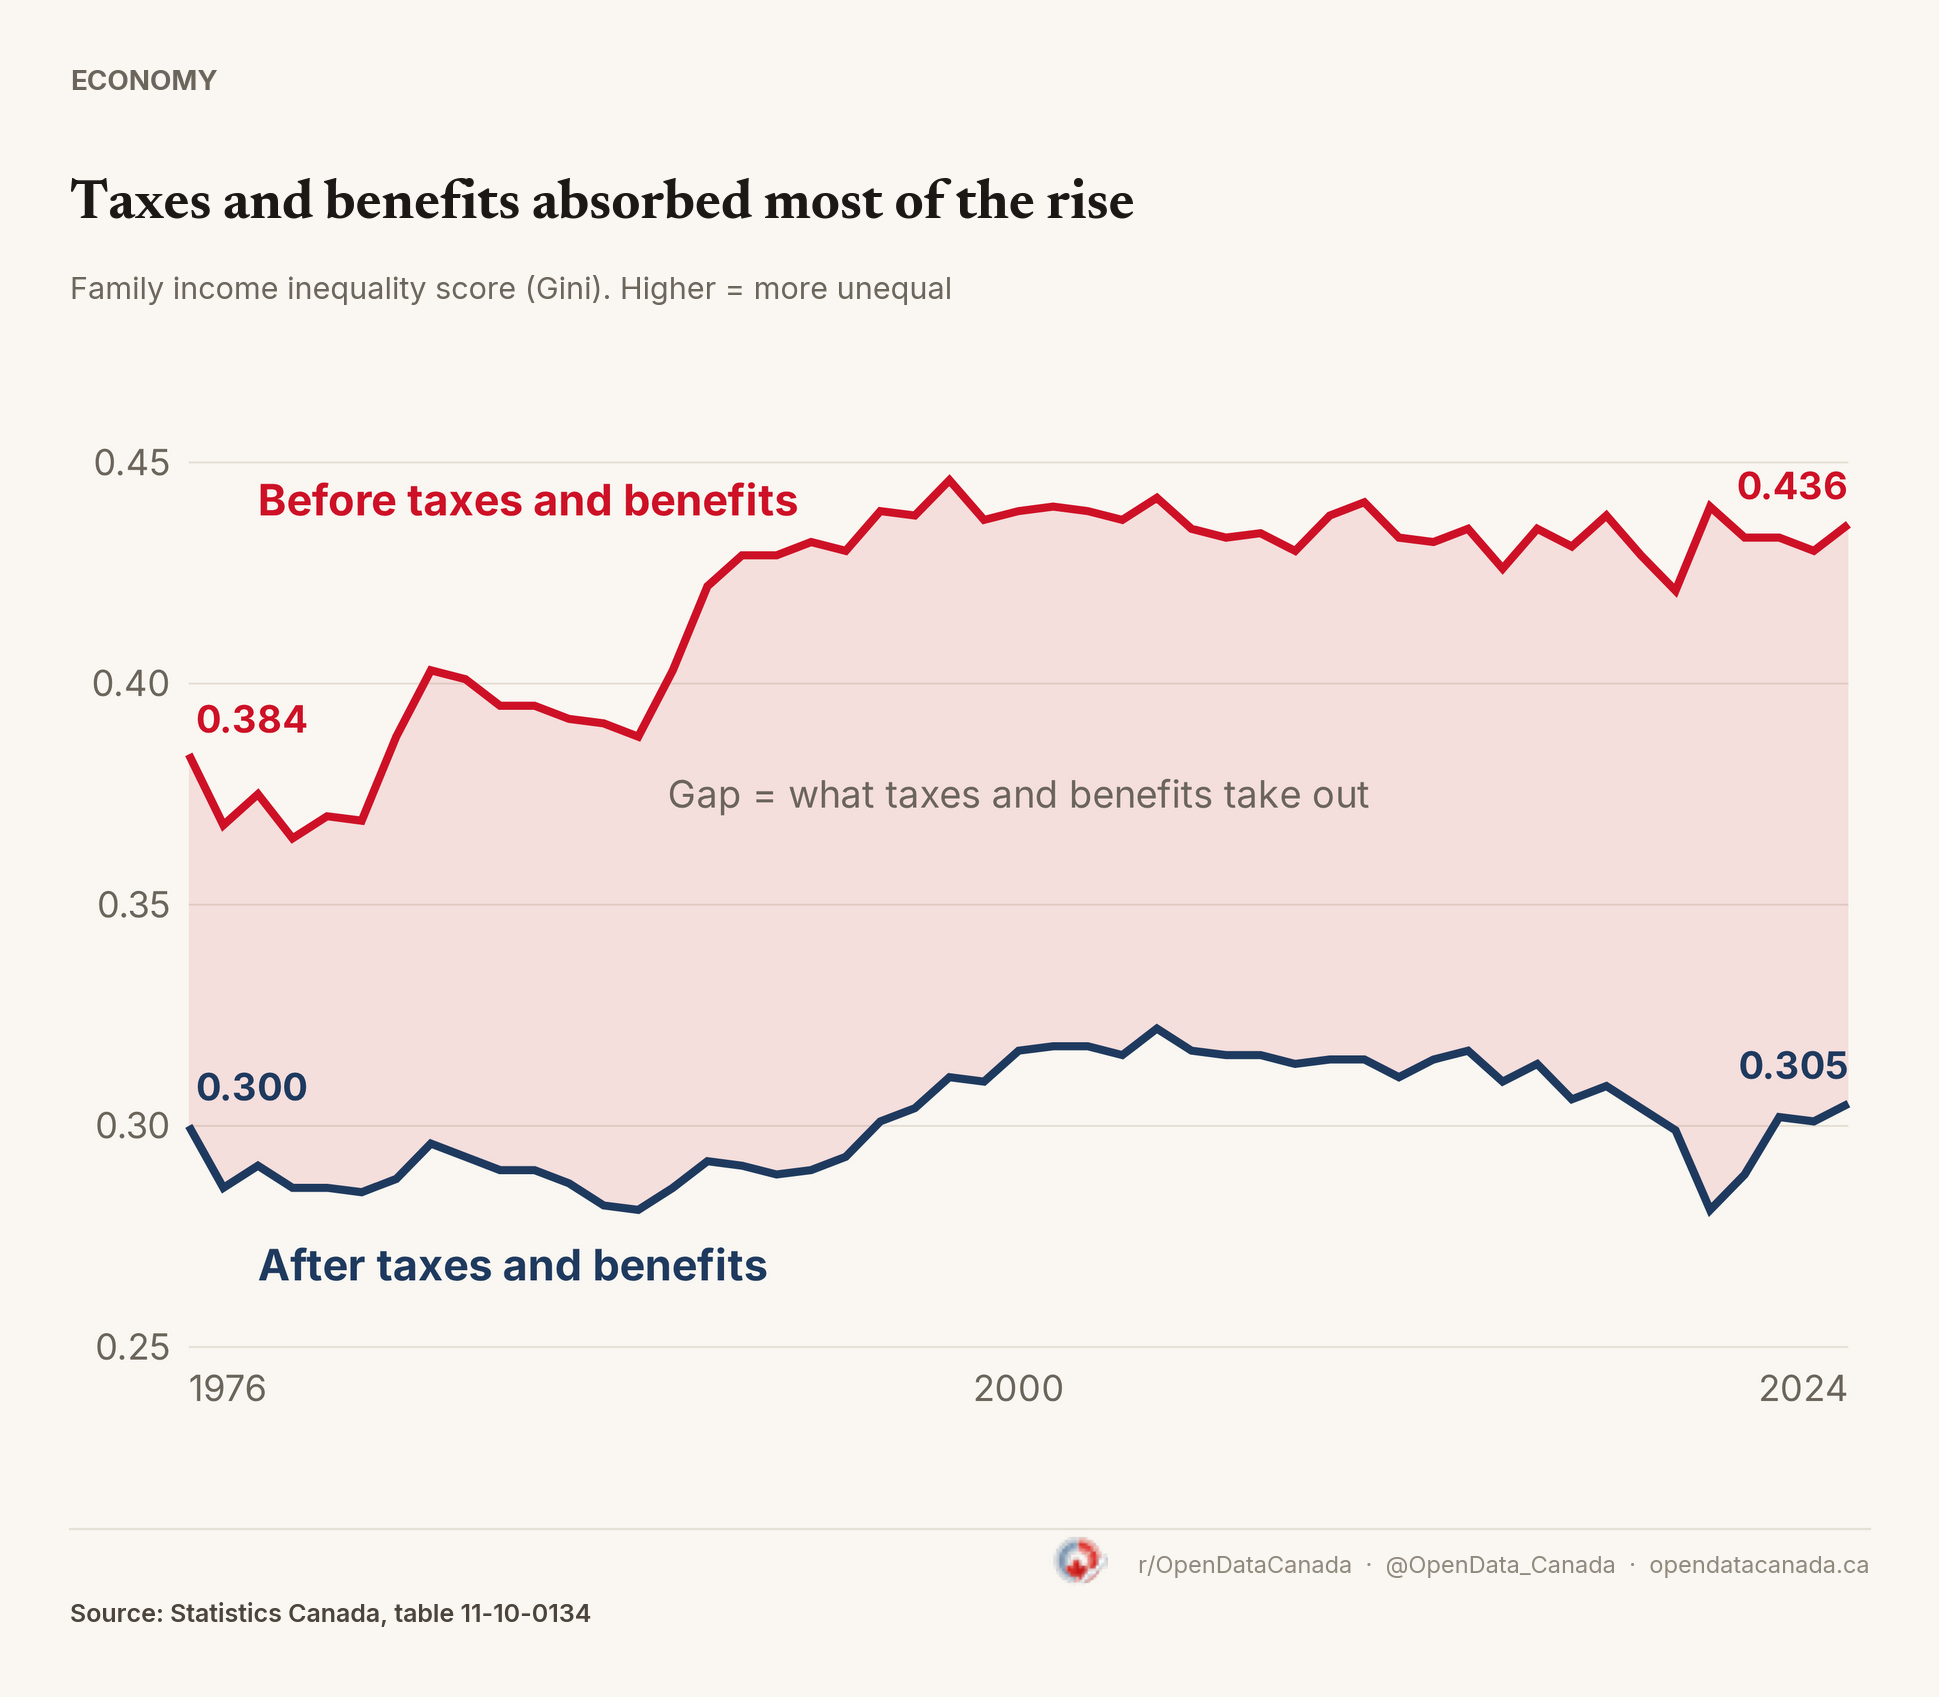
Canada has no yearly tax on overall net worth, so wealth gets no equivalent of that second line.
Age explains part of it, not the top
Wealth builds over a working life, so some of the bottom 40% are simply early in theirs. Median net worth was 159,100 dollars for those under 35 in 2023, 409,300 at 35 to 44, 675,800 at 45 to 54 and 873,400 at 55 to 64, before easing to 738,900 at 65 and over.
That climb accounts for a lot of the gap between a 30-year-old and a 60-year-old. It doesn't reach the top group. Even the 55-to-64 median is about one two-hundredth of the 171.5 million dollars it took to join the top 0.01%.
Where 10 million dollars falls
In a letter to the prime minister on 3 November, ahead of the 5 November federal budget, NDP Leader Avi Lewis asked Ottawa for a wealth tax starting at 1% on fortunes above 10 million dollars and rising to 3% on the largest. The party projects it could raise as much as 40 billion dollars a year. An estimated 108,000 families were over the 10 million line in 2023, about 0.6% of the total, and they held 20.6% of the country's net worth.
It took about 300,000 dollars in net worth to leave the bottom 40%, and 171.5 million to reach the top 0.01%.