Canadian Election Study · Analysis
Conservative voters hardened on immigration about 1.7 times as fast as the country overall
Three statements about immigrants, asked in the same words in the 2019 and 2025 Canadian Election Studies, show the average skepticism score rising among every party's voters, though only the Conservative and Liberal shifts clearly exceed chance. Conservative voters moved furthest, and the attitude became a much stronger predictor of the Conservative vote.
At each of the last three federal elections, the Canadian Election Study (CES) has asked a consistent battery of immigration questions: whether too many recent immigrants don't want to fit in, whether immigrants take jobs from other Canadians, and whether immigrants increase crime rates. Respondents answer on the same five-point agree-disagree scale, worded identically each time a statement is asked (the crime-rate item was dropped in 2021 only; more on that below). That consistency is rare in survey data, and it means the waves can be lined up directly, wave against wave, without adjusting for a changed question.
Averaging the three items into a single score, national opinion moved from 2.86 in 2019 to 3.16 in 2025, a rise of 0.31 on a scale that runs from 1 (strongly disagree, pro-immigration) to 5 (strongly agree, skeptical). The crime-rate question wasn't asked in 2021, so the three waves can only be compared on the two statements asked every time. On those two statements the national average dipped from 2.98 in 2019 to 2.81 in 2021, then jumped to 3.24 in 2025. That dip-then-jump shape is what makes 2025 read as a step change rather than a straight-line drift.
The CES has run alongside every federal election since 1965 and is the country's main academic source for this kind of tracked attitude data, which is why a wording change or a dropped item matters enough to flag rather than smooth over.
Conservative voters moved furthest
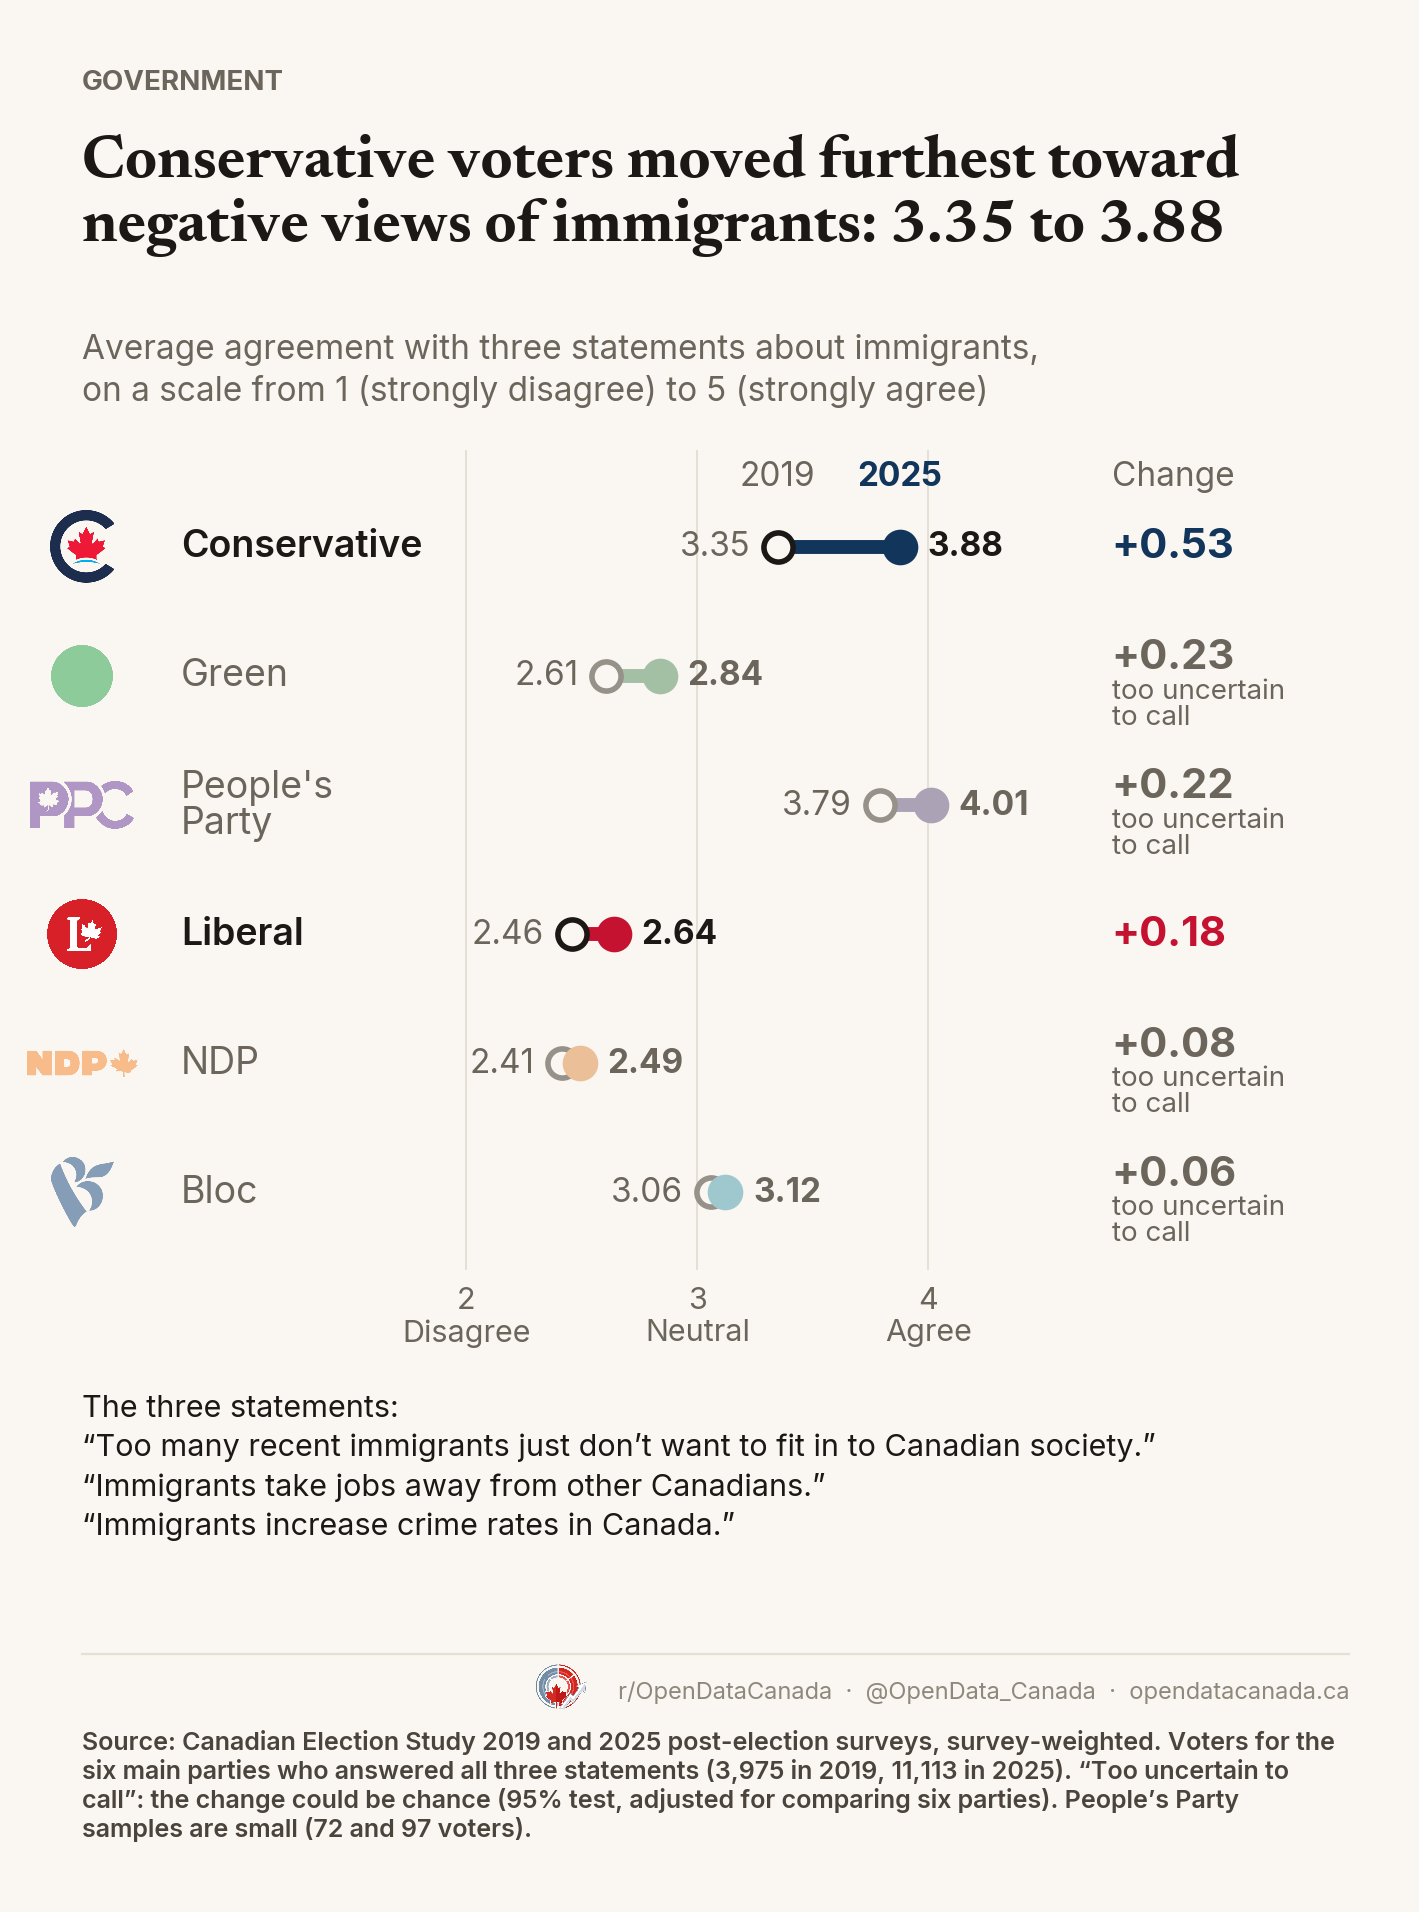
Break the same score down by vote and the gap opens up fast. Conservative voters were already the second-most skeptical group in 2019, at 3.35, behind only the much smaller People's Party base, and they moved furthest of the six, adding 0.53 points to land at 3.88 in 2025. That's about 1.7 times the national average shift, nearly three times the Liberal move (+0.18) and more than six times the NDP move (+0.08).
Green voters (+0.23) and People's Party voters (+0.22) moved by similar amounts from opposite ends of the scale: Green voters were the third-least skeptical group in 2019, People's Party voters the most skeptical in both waves. Bloc voters barely moved (+0.06), the smallest shift of the six, and stayed the third-most skeptical group.
On the combined score, none of the six party averages moved toward less skepticism, though four of those moves are too small to tell apart from chance. What stands out is magnitude, and Conservative voters are the outlier by enough that "everyone shifted" undersells what happened inside that one coalition.
| Party | 2019 mean (n) | 2025 mean (n) | Change |
|---|---|---|---|
| Conservative | 3.348 (1,358) | 3.876 (3,754) | +0.53 |
| Green | 2.605 (290) | 2.838 (198) | +0.23 |
| People's Party | 3.789 (72) | 4.010 (97) | +0.22 |
| Liberal | 2.456 (1,418) | 2.638 (5,337) | +0.18 |
| NDP | 2.413 (628) | 2.491 (892) | +0.08 |
| Bloc | 3.058 (209) | 3.121 (835) | +0.06 |
Sample sizes vary a lot by party, and not every shift in that table is distinguishable from zero. Testing each party's change against zero (survey-weighted mean, survey-adjusted standard error), the Conservative (+0.53) and Liberal (+0.18) shifts clear conventional significance easily, with p below 0.001, and still do after adjusting for testing six parties at once. NDP (+0.08, p=0.31) and Bloc (+0.06, p=0.50) do not; on the combined score, those two party bases show no measurable change (NDP voters did move on the jobs statement alone). Green (+0.23, p=0.08) and People's Party (+0.22, p=0.16) point the same skeptical direction, but with samples in the low hundreds or under 100 in a wave, neither clears the bar. Those four p-values are before adjustment; after it, all four sit between 0.34 and 0.61. Conservative voters' shift is clearly larger than the Liberal, NDP and Bloc shifts (p below 0.001, adjusted for multiple comparisons). It is about 0.3 points larger than the Green and People's Party shifts too, but those samples are too small to confirm the difference (adjusted p=0.07).
Put another way: the move didn't come from skeptical voters redistributing themselves into different parties, and it didn't come from six party bases each hardening by similar amounts. It came mainly from one already-skeptical group, Conservative voters, getting a lot more skeptical, and that group is large enough (roughly a third of main-party voters in both waves) to pull the average with it.
A single average only makes sense if the three statements measure one thing rather than three unrelated attitudes. A principal component analysis of the same three items says they do: in both waves one component explains about three-quarters of the variation (75% in 2019, 78% in 2025), with the three statements weighted almost equally. The charts use the simple mean because it stays on the original 1-to-5 scale.
The same attitude sorted votes far more sharply in 2025
A second cut of the same data asks a different question: not how skeptical the average Conservative voter is, but how much this attitude separates a Conservative voter from everyone else. Rank main-party voters by how strongly they agreed with the three statements, then compare the Conservative vote share in the most-negative tenth against the most-positive tenth. Each group is exactly 10% of voters by weight; where several voters share the same score at the cut-off, they are split proportionally. In 2025 the most-negative tenth is exactly the people who strongly agreed with all three statements.
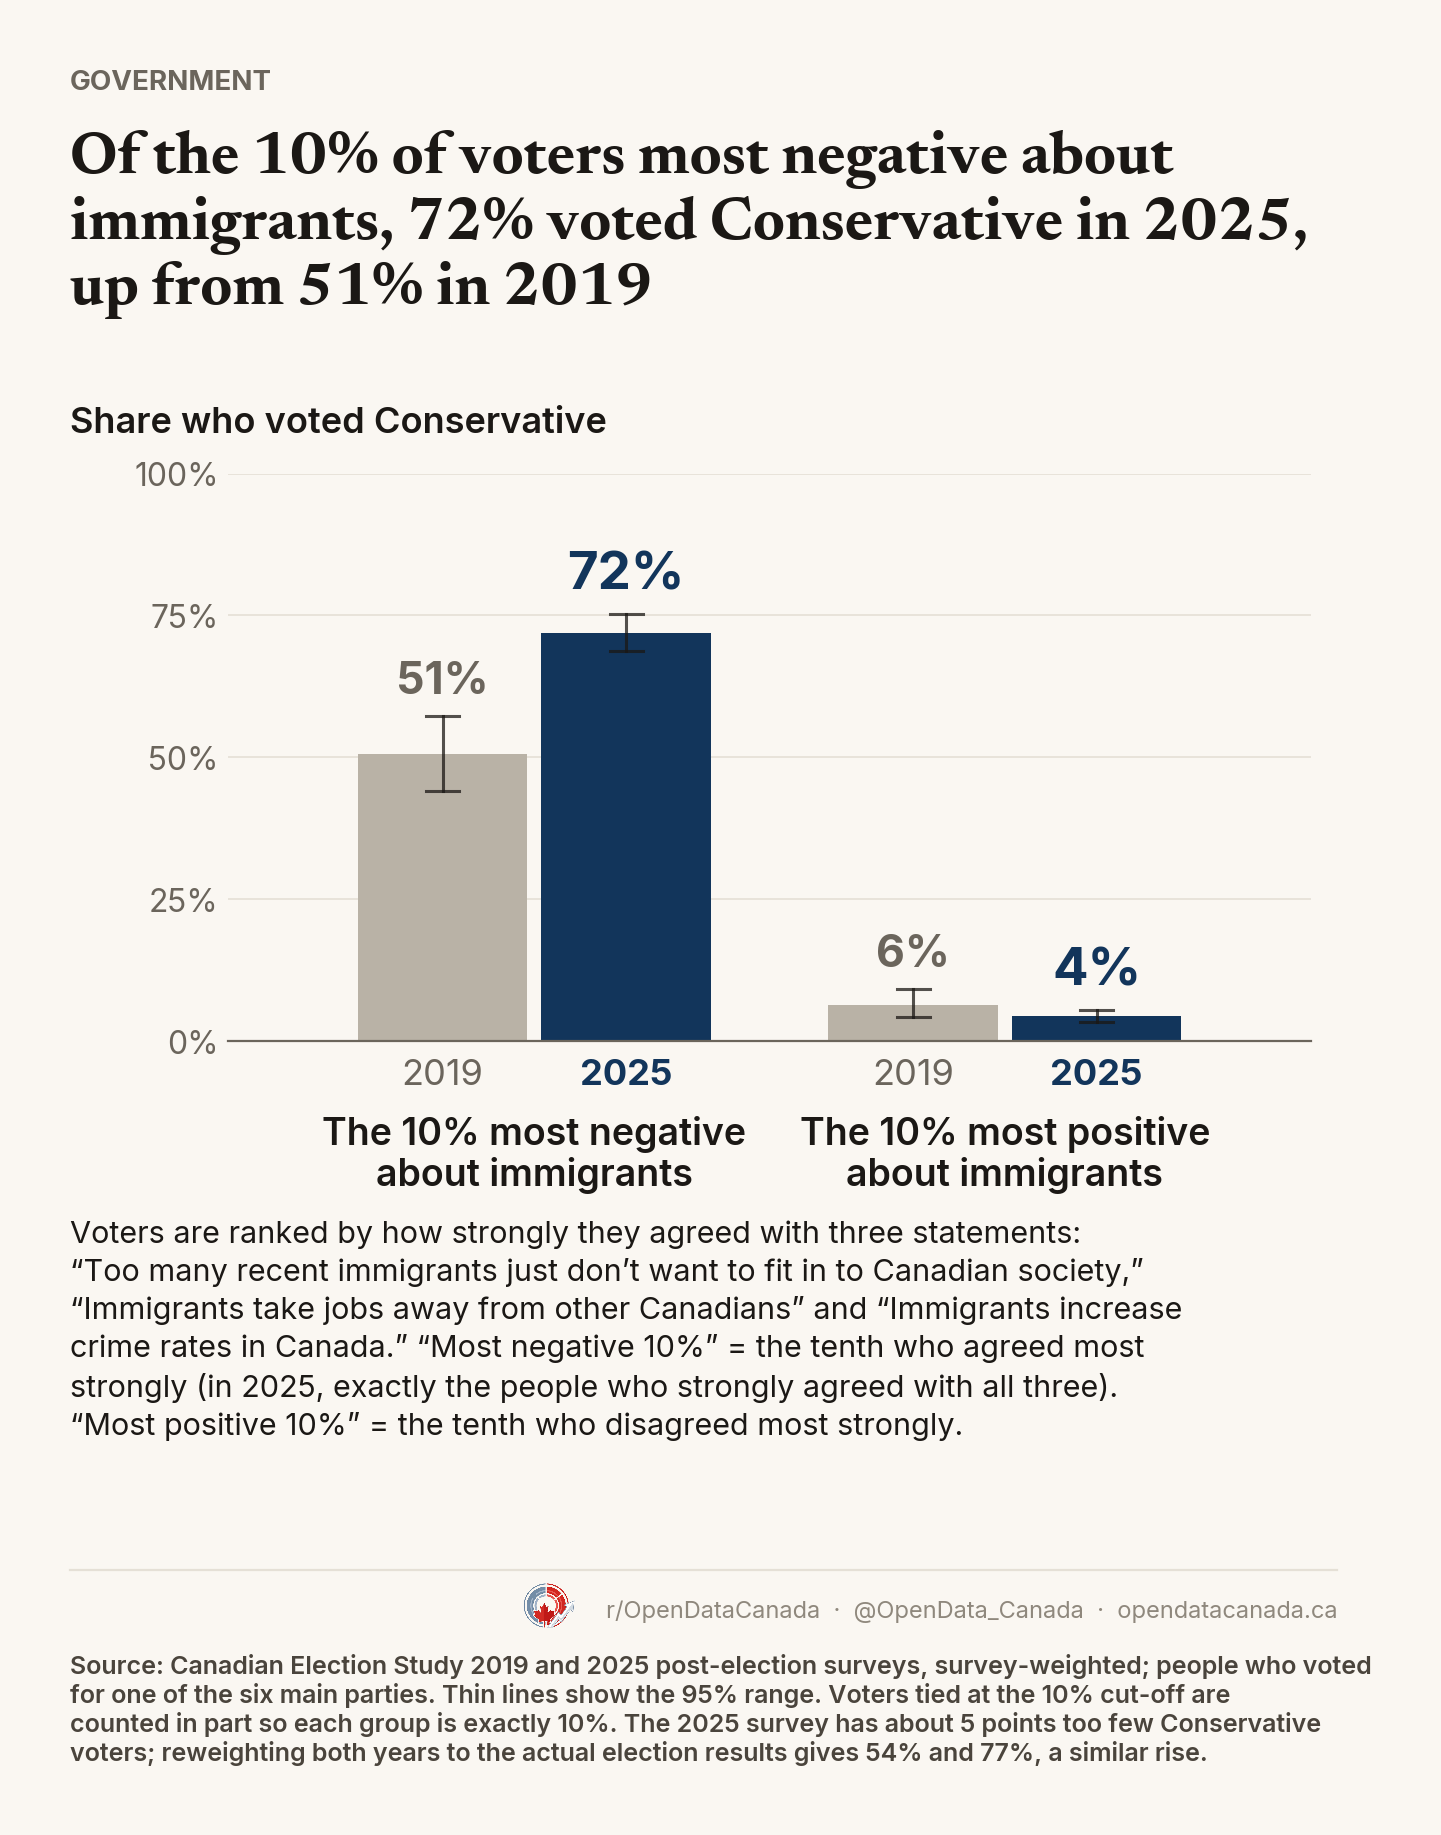
Among the most-negative tenth, 51% voted Conservative in 2019 and 72% in 2025. Among the most-positive tenth it went from 6% to 4%. The gap between the two groups grew from 44 to 68 points, a change of +23.5 points (95% range +16 to +31). On the two statements asked in all three waves, the gap was 41.9 points in 2019, 40.9 in 2021 and 64.1 in 2025: flat, then a 23-point jump. Immigration attitude was already a meaningful predictor of the Conservative vote before 2025. It became a much stronger one in the most recent wave, and the timing, no change in 2021 and then a sharp step up in 2025, matches the timing of the attitude shift itself.
The same pattern turns up in a different part of the CES questionnaire. Campaign-period respondents are also asked, in their own words, what the most important issue in the election is to them personally. The share whose answer mentions immigration was 2.7% in 2019, fell to 1.0% in 2021 and rose to 3.1% in 2025: down in 2021, up sharply in 2025, this time from an open-text question rather than the attitude battery.
What was happening outside the survey
The 2025 CES wave came after a period when Canada's non-permanent-resident population grew unusually fast. Statistics Canada estimated 1,500,978 non-permanent residents on July 1, 2022 and 2,198,679 a year later, a 46% rise in twelve months, and roughly three million by the fall of 2024. Ottawa then reversed course: a first cap on study permits in January 2024, a September 2024 goal of cutting temporary residents from 6.5% of the population to 5%, and an October 2024 levels plan that cut the 2025 permanent-resident target from 500,000 to 395,000. (The flows since then are tracked in Canada's immigration slowdown and the 2026 plan against actual admissions.)
That timeline runs alongside the CES attitude shift. It does not, on its own, explain it. Housing costs, a federal leadership change, a trade dispute with the United States and a cost-of-living squeeze all competed for attention across the same three elections.
What this data can and can't tell you
The CES data documents a relationship cleanly: a matched, identically worded, weighted battery shows real movement, and Conservative voters account for a disproportionate share of it. It is not evidence of what caused that movement, and three things limit how far the finding can be pushed.
The 2025 CES sample undercounts Conservative support. Among the main-party voters used here, 36.1% voted Conservative, against about 41.5% of the six-party vote in the certified 2025 result, a gap of about 5 points. Re-weighting both years to the certified results gives 54% and 77% for the most-negative tenth, a similar rise. That's a caveat about who showed up in the sample, not about how skeptical they said they were once they did. It is why this piece sticks to relative claims (how far a group shifted, how strongly an attitude predicts a vote) and doesn't treat any wave's numbers as a population-level vote estimate.
Every CES wave is fielded around an election campaign, not just 2025. So the 2025 finding isn't campaign-versus-non-campaign contamination. What can't be ruled out is that the 2025 campaign talked about immigration differently, or more, than the 2019 and 2021 campaigns did: a difference in salience and rhetoric between three campaigns, not an election-year effect.
The Conservative Party itself changed leaders between waves. Andrew Scheer led the party in 2019, Erin O'Toole in 2021 and Pierre Poilievre in 2025. The vote-sorting jump could reflect voters' attitudes hardening, the party campaigning more directly on immigration, or both moving together. This data can't cleanly separate a change in what voters believe from a change in what the party said to them.
Put together, the data supports a specific claim: immigration skepticism rose across the Canadian electorate between 2019 and 2025, it rose furthest and became a much stronger vote predictor among Conservative voters, and the shift came alongside rapid non-permanent-resident growth followed by a policy pullback. It does not support the stronger claim that the immigration surge caused the attitude shift. The data traces a relationship in time, not a mechanism.
One election, or a realignment
Immigration went from the top election issue for about 1 in 100 CES respondents in 2021 to about 3 in 100 in 2025. Over the same stretch, the attitude underneath it became one of the sharper lines between Conservative voters and everyone else. Whatever the cause, that is a measurable change in what separates one party's voters from the rest.
It is also one moment, not a settled trend. A flat stretch followed by one sharp jump is what a single unusual election would produce, and what a durable realignment would produce too; three data points can't tell those apart. Whether the 2025 numbers hold, keep rising or partly revert is a question only the next CES wave can answer.